B4S PriceLevel Watcher

Brief Description

The B4S PriceLevel Watcher is a useful indicator designed to empower traders with precise price level notifications. It allows users to set customizable notifications based on specific price types, such as close, high, low, ask, bid, or either ask or bid of the current candle.


Problem being solved

In the ever-evolving world of trading, staying attuned to price movements is paramount. Traders need to remain vigilant, ready to act swiftly as market conditions change. However, the challenge lies in the impossibility of keeping an unblinking eye on the charts 24/7. Critical price levels can be breached in the blink of an eye, leading to missed opportunities or unexpected losses.


How B4S PriceLevel Watcher Addresses the Challenge

The B4S PriceLevel Watcher is the solution to the trader's dilemma. By allowing users to set precise price level notifications with customizable sounds and modals, this indicator ensures that traders never miss a crucial market development. Here's how:

  1. Automated Alerts: The indicator automates the process of monitoring specific price levels. Users can set alerts for various price types, activating them with a single click.
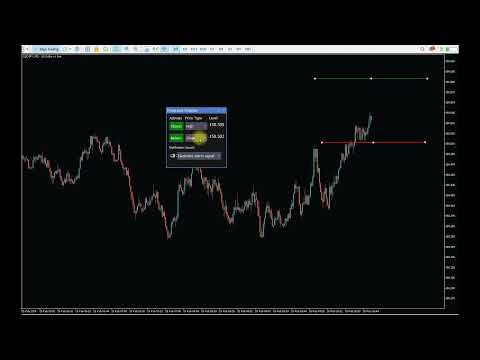
  2. Visual Guidance: The adjustable horizontal lines provide a visual representation of targeted price levels, making it easy for traders to set and modify alerts with precision.
  3. Persistent Settings: Save your preferred settings and eliminate the need to repeatedly configure the indicator. Your customized alerts persist across MT5 restarts, ensuring continuous monitoring without manual intervention.
  4. Flexible Notifications: Choose from a variety of sounds or opt for a silent modal notification. This flexibility allows traders to customize their alert system based on personal preferences and the urgency of the situation.


Features & Settings

User Settings Available
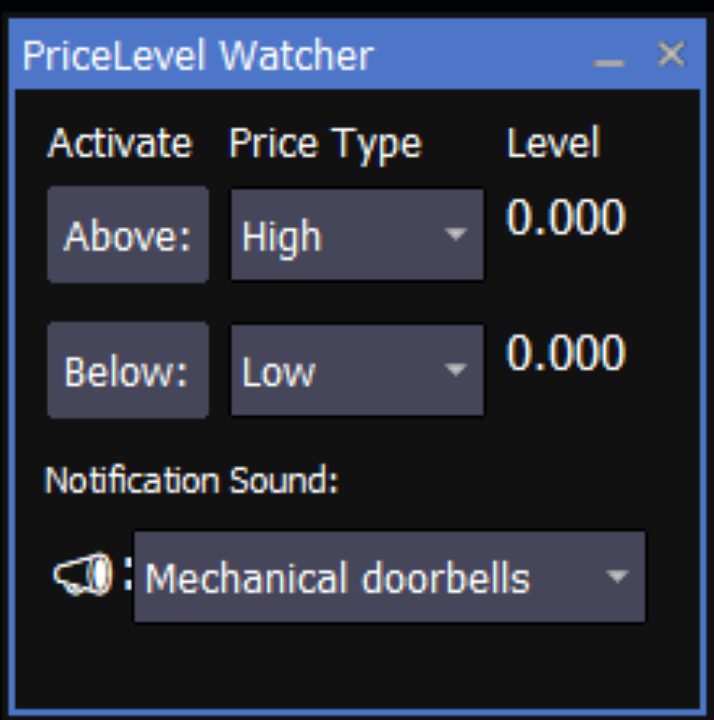
  1. Activation Types:
    • Above: Track when the price goes above a certain point.
    • Below: Monitor price movement below a specified level.
  2. Price Type Selection:
    • Choose from various price types (close, ask, bid, high, low) for each activation button.
    • Price type dropdown lists enable precise customization.
  3. Adjustable Horizontal Lines:
    • Pressing activation buttons draws horizontal lines on the chart.
    • Lines are fully adjustable, allowing users to set desired price levels visually.
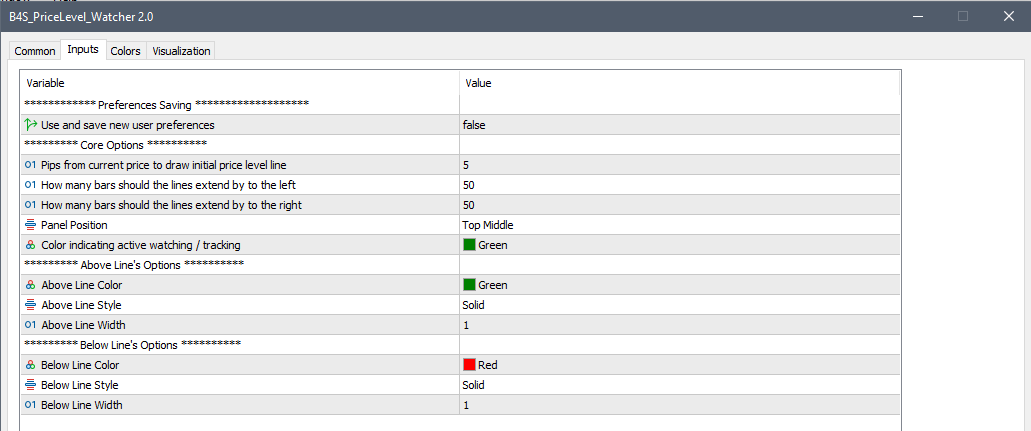
  4. Color Customization:
    • Set line colors based on user preferences.
    • Default color is green.
  5. Persistent Settings:
    • User preferences are saved, ensuring continuity across MT5 restarts.
    • Modify settings easily with a Boolean toggle.

Notifications

  1. Modal Notification:
    • A modal appears, displaying target price, price type, and timestamp (server and local time).
  2. Sound Alerts:
    • Choose from a variety of custom sounds or opt for no sound.
    • Tailor audio notifications based on specific price types and activation methods.


Why B4S PriceLevel Watcher?

  • Precision: Set precise price levels for alerts with various activation types.
  • Flexibility: Customize preferences to suit individual trading strategies.
  • Efficiency: Visualize and adjust alerts quickly with intuitive chart interactions.
  • Persistent Settings: Save time by keeping preferred settings across MT5 restarts.


How to Use

  1. Select Price Type:
    • Choose the desired price type for each activation button from the dropdown lists.
  2. Activate Alert:
    • Press Above or Below button to activate the desired price level.
  3. Adjust Line:
    • Drag the line to your target price level on the chart.
  4. Choose Notification Sound:
    • Select your preferred notification sound or opt for no sound.


Why It Matters

  1. Timely Decision-Making: Markets move rapidly, and delays in decision-making can result in missed profitable trades or preventable losses.
  2. Risk Management: Identifying key price levels is crucial for effective risk management. Failing to act promptly on price breaches may expose traders to unnecessary risks.
  3. Opportunity Maximization: Every second counts in trading. Being aware of price movements at the right moment enables traders to capitalize on emerging opportunities.
  4. Reduced Stress: Constantly monitoring charts can be mentally exhausting. Traders need a solution that provides alerts, allowing them to step away from the screen without fear of missing critical market events.


The Results

  • Stay informed about critical price movements with visual and audible notification alerts.
  • Streamline your trading strategy with persistent settings that save time and effort.


Take Charge of Your Trading Journey

With the B4S PriceLevel Watcher, traders can break free from the constraints of round-the-clock chart monitoring. Stay informed, make timely decisions, and seize opportunities without the stress of constantly staring at the screen. Elevate your trading experience and let the B4S PriceLevel Watcher empower you to trade with confidence and efficiency.


Related Topics

  1. B4S
  2. #PriceAlerts
  3. #TechnicalAnalysis
  4. #ForexTrading
  5. #MarketVolatility
  6. #TradingStrategies
  7. #PriceLevelNotifications
  8. #MT5Indicators
  9. #RiskManagement
  10. #TradingTools
  11. #MarketAlerts
  12. #PriceLevelAlerts
  13. #TradingEfficiency
  14. #TradeNotifications
  15. #ChartAnalysis
  16. #PriceMonitoring
Produtos recomendados
Noize Absorption Index - is the manual trading system that measures the difference of pressure between bears forces and bulls forces. Green line - is a noize free index that showing curent situation. Zero value of index shows totally choppy/flat market.Values above zero level shows how powerfull bullish wave is and values below zero measures bearish forces.Up arrow appears on bearish market when it's ready to reverse, dn arrow appears on weak bullish market, as a result of reverse expectation.
O indicador SMC Venom Model BPR é uma ferramenta profissional para os traders que trabalham com o conceito Smart Money (SMC). Identifica automaticamente dois padrões principais no gráfico de preços: FVG   (Fair Value Gap) é uma combinação de três velas, em que existe um gap entre a primeira e a terceira velas. Forma uma zona entre níveis onde não há suporte de volume, o que geralmente leva a uma correção de preço. BPR   (Balanced Price Range) é uma combinação de dois padrões FVG que formam uma
O nível Premium é um indicador único com mais de 80% de precisão nas previsões corretas! Este indicador foi testado pelos melhores Especialistas em Negociação por mais de dois meses! O indicador do autor você não encontrará em nenhum outro lugar! A partir das imagens você pode ver por si mesmo a precisão desta ferramenta! 1 é ótimo para negociar opções binárias com um tempo de expiração de 1 vela. 2 funciona em todos os pares de moedas, ações, commodities, criptomoedas Instruções: Assim
Was: $249  Now: $99   Market Profile defines a number of day types that can help the trader to determine market behaviour. A key feature is the Value Area, representing the range of price action where 70% of trading took place. Understanding the Value Area can give traders valuable insight into market direction and establish the higher odds trade. It is an excellent addition to any system you may be using. Inspired by Jim Dalton’s book “Mind Over Markets”, this indicator is designed to suit the
Nosso indicador   Basic Support and Resistance   é a solução necessária para aumentar sua análise técnica.Este indicador permite que você forneça níveis de suporte e resistência no gráfico/   versão MT4 grátis Recursos Integração dos níveis de Fibonacci: Com a opção de exibir níveis de Fibonacci, juntamente com os níveis de suporte e resistência, nosso indicador fornece uma visão ainda mais profunda do comportamento do mercado e possíveis áreas de reversão. Otimização de desempenho: Com a opçã
Volume Profile V6
Andrey Kolesnik
4.67 (3)
Indicador de perfil de volume de mercado + oscilador inteligente. Funciona em praticamente todos os instrumentos — pares de moedas, ações, futuros, criptomoedas, tanto em volumes reais quanto em ticks. É possível configurar a definição automática do intervalo de construção do perfil (por exemplo, por uma semana ou um mês, etc.), bem como definir o intervalo manualmente movendo os limites (duas linhas verticais: vermelha e azul). É exibido na forma de um histograma. A largura do histograma em um
CosmiCLab SMC FIBO CosmiCLab SMC FIBO is a professional trading indicator designed for traders who use Smart Money Concepts (SMC), market structure analysis and Fibonacci retracement levels. The indicator automatically detects market swings and builds Fibonacci levels based on the latest impulse movement. It also identifies market structure changes such as BOS (Break of Structure) and CHOCH (Change of Character), helping traders understand the current market direction. CosmiCLab SMC FIBO also pr
Este é sem dúvida o indicador de reconhecimento automático de formação de preço harmônico mais completo que você pode encontrar para a MetaTrader Platform. Ele detecta 19 padrões diferentes, leva as projeções de Fibonacci tão a sério quanto você, exibe a Zona de Reversão Potencial (PRZ) e encontra níveis adequados de stop loss e take-profit. [ Guia de instalação | Guia de atualização | Solução de problemas | FAQ | Todos os produtos ] Detecta 19 formações harmônicas de preços diferentes Traça
RSI Currency Strength Meter is a powerful and elegant multi-currency indicator that measures the real-time relative strength of the 8 major currencies using RSI logic. By calculating the smoothed performance of each currency across its major pairs and applying the RSI formula, it delivers clean and responsive strength lines that make it easy to spot which currencies are truly strong or weak at any moment. This indicator is particularly useful for visualizing currency correlations and divergence
Supply and Demand Pro
Godbless C Nygu
4 (1)
Join Deriv link on profile>>> GET THIS FULL COPY AND GET ANOTHER FREE INDICATOR ONE OF THE BEST AND USEFULL INDICATORS IN THE WORLD ..This is the one of the best usefull indicators which has chosen to be used by top traders in the world. AUTOMATIC SUPPORT AND RESISTANCE This way of trading is also called Supply and demand, On this way of trading you can see auto colours appear where the market changes direction buying or selling Direction. ALL KIND OF PAIRS METALS AND INDICIES ARE INCLUDED A
Price Magnet — Price Density and Attraction Levels Indicator Price Magnet is a professional analytical tool designed to identify key support and resistance levels based on statistical Price Density. The indicator analyzes a specified historical period and detects price levels where the market spent the most time. These zones act as “magnets,” attracting price action or forming a structural base for potential reversals. Unlike traditional Volume Profile tools, Price Magnet focuses on price-time d
MultiTimeframe Support and Resistance Zones
Mohamed Gamal Abdelnasser Yous Hashesh
A powerful indicator that highlights key market zones and helps traders identify potential opportunities across multiple timeframes. Designed for clarity and efficiency, it provides real-time alerts to keep you informed of important price levels. Key Features: Works on multiple timeframes: M1, M5, M15, M30, H1, H4, D1, W1, MN1. Customizable zone colors for each timeframe. Real-time alerts and notifications when price reaches significant zones. Automatically manages chart objects to keep your wor
Monitor your order
Eslam Mohamed Hassanein Hassan Aly
Advanced Lot & Profit Monitor PRO is a powerful MT5 indicator that provides real-time monitoring of your trading positions directly on the chart. It displays the number of orders, total lot sizes, and profit (including swap) for Buy and Sell positions separately, as well as the overall account performance. Designed with a clean and customizable interface, this tool helps traders stay in control of their exposure and risk at all times. Key Features: Real-time monitoring of open positions Sepa
Trading Utility for Forex Currency Pairs Only not for Gold  Functions Auto Lot Calculation based on Risk Auto stoploss  Auto TakeProfit Breakeven Auto Close Half % Close in percentage with respect to the PIPs Pending Orders BuyLimit Sell Limit with distances BuyStop Sell Stop    with distances Trading Informations Risk in percentage For Multiple trades Combine Takeprofit and Combine Stoplosses
Pro Gold System Indicator
PEDRO JOAQUIM GONCALVES GOMES
ADVANCED FUNCTIONALITIES: Trend Score (0-100) with visual bar Intelligent signals with adjustable strength (1-10) Risk management with automatic TP/SL Audible and visual alerts Price zones with smooth filling Multi-indicator analysis (RSI, ATR, BB, EMAs) DESIGN FEATURES Modern Visual: Smooth and well-spaced lines (EMA with 2-3px width) Vibrant and professional colors (Sky Blue, Orange, Gold) Modern arrows (code 233/234) for buy/sell signals Configurable dark/light theme Adjustable transparency f
Harmonic Pattern Structure Harmonic Pattern Structure é um indicador profissional para MetaTrader 5 que detecta automaticamente padrões harmônicos clássicos utilizando validação rigorosa de ratios de Fibonacci e estrutura XABCD. Projetado para traders que buscam precisão, clareza visual e padronização, o indicador identifica zonas de reversão com base em geometria de preço, ajudando na tomada de decisão de forma objetiva e consistente. PADRÕES HARMÔNICOS DETECTADOS Gartley (222) Butterfly
O indicador DYJ BoS identifica e marca automaticamente os principais elementos das alterações na estrutura do mercado, incluindo: Ruptura da Estrutura (BoS): ocorre quando o preço faz um grande movimento, rompendo o ponto anterior da estrutura. Marca possíveis linhas de tendência de alta e de baixa (UP e DN, ou seja, novos máximos e novos mínimos consecutivos) e, quando o preço rompe essas linhas, marca-as com setas vermelhas (de baixa) e verdes (de alta) . Um BoS ocorre normalmente quando o
RBreaker
Zhong Long Wu
RBreaker Gold Indicators é uma estratégia de negociação intradiária de curto prazo para futuros de ouro que combina duas abordagens: o seguimento de tendência e as reversões intradiárias. Ela permite capturar lucros durante mercados em tendência e também realizar lucros oportunamente e operar na direção oposta quando o mercado se reverte. Esta estratégia foi classificada por 15 anos consecutivos entre as dez estratégias de negociação mais lucrativas pela revista americana Futures Truth. Ela pos
Advanced Volume Profile Analysis Tool for MetaTrader 5 The Kecia Volume Profile Order Finder provides traders with volume profile analysis capabilities. This MT5 indicator combines volume profile visualization with statistical calculations to help identify potential trading opportunities and suggests entry, stop loss, and take profit levels based on market structure. Market Profile Visualization Transform your chart with customizable volume profile visualizations: Multiple visualization options
Your Trend Friend
Luigi Nunes Labigalini
5 (1)
A tendência é sua amiga! Veja a cor do indicador e faça suas operações nessa direção. Ele não repinta. Ou seja, depois que cada candle se fecha, a cor dele é definitiva e não irá se alterar. Você pode focar em movimentos mais curtos e rápidos ou tendências mais longas, basta testar o que melhor se encaixa no seu operacional de acordo com o ativo e tempo gráfico usado. Altere o parâmetro de entrada "Length" e o indicador irá se adaptar automaticamente (quanto maior ele for, maior a tendência an
# DRAWDOWN INDICATOR V4.0 - The Essential Tool to Master Your Trading ## Transform Your Trading with a Complete Real-Time Performance Overview In the demanding world of Forex and CFD trading, **knowing your real-time performance** isn't a luxury—it's an **absolute necessity**. The **Drawdown Indicator V4.0** is much more than a simple indicator: it's your **professional dashboard** that gives you a clear, precise, and instant view of your trading account status. --- ## Why This Indicator
Level Volume Pro
John Samfel Bucton Josol
HAT IT DOES   MONTHLY HIGH & LOW — AUTO-DRAWN EVERY MONTH Draws the High and Low of every month for the current year (or any year you set). Each level extends as a horizontal ray into the future so you always see where price is reacting to historical monthly extremes. Color-coded (blue = high, red = low), labeled (JAN HIGH, FEB LOW etc.), fully customizable width and style. Toggle individual months on or off.   WEEKLY HIGH & LOW
Price manipulation risk
Vincent Albert Feugier
Price Manipulation Risk Indicator Advanced Tool for Market Risk Evaluation & Manipulation Detection Price Manipulation Risk Indicator is a professional tool designed to measure the current risk level in the market. It evaluates price behavior, market activity, and candle dynamics to detect unstable or potentially manipulated environments. This indicator helps traders avoid traps , filter false signals , and improve timing in both entries and exits. Product Purpose Provide an immediate a
Step into the world of Forex trading with confidence, clarity, and precision using Gold Indicator a next-generation tool engineered to take your trading performance to the next level. Whether you’re a seasoned professional or just beginning your journey in the currency markets, Gold Indicator equips you with powerful insights and help you trade smarter, not harder. Built on the proven synergy of three advanced indicators, Gold Indicator focuses exclusively on medium and long-term trends elimina
Laguerre SuperTrend Clouds   adds an Adaptive Laguerre averaging algorithm and alerts to the widely popular SuperTrend indicator. As the name suggests,   Laguerre SuperTrend Clouds (LSC)   is a trending indicator which works best in trendy (not choppy) markets. The SuperTrend is an extremely popular indicator for intraday and daily trading, and can be used on any timeframe. Incorporating Laguerre's equation to this can facilitate more robust trend detection and smoother filters. The LSC uses the
Max Min Delta Indicator - Market Volume Imbalance Analysis Gain Deeper Insights into Market Volume Imbalance with Delta Analysis What is the Max Min Delta Indicator? The Max Min Delta Indicator is a powerful market volume analysis tool that visually represents maximum and minimum delta values using a histogram. It helps traders identify market strength, weakness, absorption, and aggressive buying/selling activity with precision. Key Features Histogram Visualization: Displays Max Delta (Green) an
CoPilot dashboard MT5
Frederic Jacques Collomb
CoPilot — Painel de trading diário Conheça os seus números. Opere com clareza. Versão MT4 O que é o CoPilot? O CoPilot é um assistente de trading de nível profissional que exibe em tempo real todas as estatísticas de desempenho diário diretamente no gráfico — com uma curva de equidade ao vivo que se atualiza operação por operação. Desenvolvido para traders ativos que precisam de visibilidade instantânea da sua sessão sem sair do gráfico, o CoPilot agrega cada operação fechada do dia em todos os
Fibo Channels
Jeffrey Quiatchon
Fibo Daily Channel Indicator The  Indicator is a powerful tool for traders, providing precise daily support and resistance levels based on Fibonacci retracement and extension calculations. This indicator automatically draws key pivot points (PP, R1, R2, S1, S2) as well as additional extension levels (R3, R4, S3, S4), helping traders identify potential reversal and breakout zones with ease. It includes customizable alerts and push notifications, allowing traders to receive updates whenever the pr
Gann Time–Price Square Cycles (MT5) This indicator applies the concept of time–price balance introduced by W.D. Gann. It detects price swings on the chart and projects Quarter, Half, and Full cycle time intervals forward, marking them with vertical lines. The tool is designed to help traders study the relationship between swing size and elapsed time directly on MT5 charts. Functions Detects swing highs and lows based on pivot depth and minimum swing size. Projects Quarter, Half, and Full harmon
Prime Power ML é um Currency Strength Meter avançado com dois modelos de redes neurais ONNX que filtram sinais por probabilidade de ganho antes de exibi-los. Ao contrário dos indicadores CSM tradicionais que mostram cada divergência entre moedas, o Prime Power ML destaca apenas os sinais onde a AI confirma uma vantagem estatística. Como funciona O indicador calcula em tempo real a força de 8 moedas principais (USD, EUR, GBP, JPY, AUD, CAD, CHF, NZD) usando pontuação RSI em todos os 28 pares. Qua
Os compradores deste produto também adquirem
Azimuth Pro
Ottaviano De Cicco
5 (6)
Azimuth Pro V2: Estrutura Fractal Sintética e Entradas Confirmadas para MT5 Visão geral Azimuth Pro é um indicador de estrutura swing multinível da Merkava Labs . Quatro camadas de swing aninhadas, VWAP ancorado em swings, detecção de padrões ABC, filtragem estrutural de três timeframes e entradas confirmadas em barra fechada — um gráfico, um fluxo de trabalho dos micro-swings aos macro-ciclos. Este não é um produto de sinais cegos. É um fluxo de trabalho baseado em estrutura para traders que v
Divergence Bomber
Ihor Otkydach
4.9 (86)
Cada comprador deste indicador recebe adicionalmente, e de forma gratuita: A ferramenta exclusiva "Bomber Utility", que acompanha automaticamente cada operação, define os níveis de Stop Loss e Take Profit e fecha operações de acordo com as regras da estratégia; Arquivos de configuração (set files) para ajustar o indicador em diferentes ativos; Set files para configurar o Bomber Utility nos modos: "Risco Mínimo", "Risco Balanceado" e "Estratégia de Espera"; Um vídeo tutorial passo a passo que aju
Quantum TrendPulse
Bogdan Ion Puscasu
5 (22)
Apresentando   Quantum TrendPulse   , a ferramenta de negociação definitiva que combina o poder do   SuperTrend   ,   RSI   e   Stochastic   em um indicador abrangente para maximizar seu potencial de negociação. Projetado para traders que buscam precisão e eficiência, este indicador ajuda você a identificar tendências de mercado, mudanças de momentum e pontos de entrada e saída ideais com confiança. Principais características: Integração SuperTrend:   siga facilmente a tendência predominante do
OmniSync Projection
Antonio-alin Teculescu
5 (1)
Chronos Fractal Engine is an innovative price projection indicator for MetaTrader 5, designed to transform your technical analysis by intelligently identifying and projecting historical price patterns. Built upon an advanced correlation algorithm and the fractal principles of the market, this powerful tool visualizes potential future price movements, giving you a unique edge in your trading decisions. What is Chronos Fractal Engine? At its core, the Chronos Fractal Engine employs a sophisticat
ARICoins
Temirlan Kdyrkhan
ARICoin is a powerful trading companion designed to generate high-probability entry signals with dynamic TP/SL/DP levels based on volatility. Built-in performance tracking shows win/loss stats, PP1/PP2 hits, and success rates all updated live. Key Features: Buy/Sell signals with adaptive volatility bands Real-time TP/SL/DP levels based on ATR Built-in MA Filter with optional ATR/StdDev volatility Performance stats panel (Success, Profit/Loss, PP1/PP2) Alerts via popup, sound, push, or email Cust
Btmm state engine pro
Garry James Goodchild
5 (4)
BTMM State Engine Pro is a MetaTrader 5 indicator for traders who use the Beat The Market Maker approach: Asian session context, kill zone timing, level progression, peak formation detection, and a multi-pair scanner from a single chart. It combines cycle state logic with a built-in scanner dashboard so you do not need the same tool on many charts at once. What it does Draws the Asian session range; session times can follow broker server offset or be set in inputs. Tracks level progression (L
Antes de tudo, vale ressaltar que esta Ferramenta de Negociação é um Indicador Não Repintante, Não Redesenhante e Não Atrasado, o que a torna ideal para negociação profissional. Curso online, manual do utilizador e demonstração. O Indicador de Conceitos de Ação de Preço Inteligente é uma ferramenta muito poderosa tanto para traders novos quanto experientes. Ele combina mais de 20 indicadores úteis em um único, combinando ideias avançadas de negociação como Análise do Trader do Círculo Interno
Apresentando       Quantum Breakout PRO   , o inovador Indicador MQL5 que está transformando a maneira como você negocia Breakout Zones! Desenvolvido por uma equipe de traders experientes com experiência comercial de mais de 13 anos,       Quantum Breakout PRO       foi projetado para impulsionar sua jornada comercial a novos patamares com sua estratégia de zona de fuga inovadora e dinâmica. O Quantum Breakout Indicator lhe dará setas de sinal em zonas de breakout com 5 zonas-alvo de lucro e su
Grabber System MT5
Ihor Otkydach
4.83 (23)
Apresento a você um excelente indicador técnico: Grabber, que funciona como uma estratégia de trading “tudo incluído”, pronta para usar. Em um único código estão integradas ferramentas poderosas de análise técnica de mercado, sinais de entrada (setas), funções de alertas e notificações push. Cada comprador deste indicador também recebe gratuitamente: Utilitário Grabber: ferramenta para gerenciamento automático de ordens abertas Vídeo tutorial passo a passo: como instalar, configurar e operar com
Bill Williams Advanced
Siarhei Vashchylka
5 (11)
Bill Williams Advanced is designed for automatic chart analysis using Bill Williams' "Profitunity" system. The indicator analyzes four timeframes at once. Manual (Be sure to read before purchasing) Advantages 1. Analyzes the chart using Bill Williams' "Profitunity" system. Signals are displayed in a table in the corner of the screen and on the price chart. 2. Finds all known AO and AC signals, as well as zone signals. Equipped with a trend filter based on the Alligator. 3. Finds "Divergence Bar
RelicusRoad Pro: Sistema Operacional Quantitativo de Mercado 70% DE DESCONTO ACESSO VITALÍCIO (TEMPO LIMITADO) - JUNTE-SE A 2.000+ TRADERS Por que a maioria dos traders falha mesmo com indicadores "perfeitos"? Porque eles operam Conceitos Únicos no vácuo. Um sinal sem contexto é uma aposta. Você precisa de CONFLUÊNCIA . RelicusRoad Pro não é um simples indicador de seta. É um Ecossistema Quantitativo de Mercado completo. Ele mapeia a "Estrada do Valor Justo", distinguindo ruído de rupturas estru
Berma Bands
Muhammad Elbermawi
5 (8)
O indicador Berma Bands (BBs) é uma ferramenta valiosa para traders que buscam identificar e capitalizar tendências de mercado. Ao analisar a relação entre o preço e os BBs, os traders podem discernir se um mercado está em uma fase de tendência ou de variação. Visite o [ Blog Berma Home ] para saber mais. As Bandas de Berma são compostas por três linhas distintas: a Banda de Berma Superior, a Banda de Berma Média e a Banda de Berma Inferior. Essas linhas são plotadas em torno do preço, criando u
ARIPoint
Temirlan Kdyrkhan
ARIPoint is a powerful trading companion designed to generate high-probability entry signals with dynamic TP/SL/DP levels based on volatility. Built-in performance tracking shows win/loss stats, PP1/PP2 hits, and success rates all updated live. Key Features: Buy/Sell signals with adaptive volatility bands Real-time TP/SL/DP levels based on ATR Built-in MA Filter with optional ATR/StdDev volatility Performance stats panel (Success, Profit/Loss, PP1/PP2) Alerts via popup, sound, push, or email Cu
ICT PO3 (Power of 3) AMD Protocol Framework Indicator True Time & Structure Integration   |  Non-Repainting | Real-Time  | Multi-Asset  | MT4 Version Available Full Setup Guide & Strategy Playbook: https://www.mql5.com/en/blogs/post/768683 MT4 Version: https://www.mql5.com/en/market/product/171742 Indicator Overview The ICT PO3 AMD Protocol Framework is a complete structural overlay for MetaTrader 5 that maps the True Daily Cycle directly onto your lower-timeframe execution chart. It projects
TPA True Price Action indicator reveals the true price action of the market makers through 100% non-repainting signals strictly at the close of a candle! TPA shows entries and re-entries, every time the bulls are definitely stronger than the bears and vice versa. Not to confuse with red/green candles. The shift of power gets confirmed at the earliest stage and is ONE exit strategy of several. There are available now two free parts of the TPA User Guide for our customers. The first "The Basics"
AriX
Temirlan Kdyrkhan
1 (4)
AriX Indicator for MT5 A powerful trend-following and signal-evaluation tool AriX is a custom MT5 indicator that combines Moving Averages and ATR-based risk/reward logic to generate clear buy/sell signals. It visualizes dynamic SL/TP levels, evaluates past trade outcomes, and displays win/loss statistics in a clean on-chart panel. Key features include: Buy/Sell signals based on MA crossovers ATR-based SL/TP1/TP2/TP3 levels with visual lines and labels Signal outcome tracking with real-time stat
Advanced Supply Demand MT5
Bernhard Schweigert
4.53 (15)
Atualmente com 33% de desconto! A melhor solução para qualquer Trader Novato ou especialista! Este indicador é uma ferramenta de negociação exclusiva, de alta qualidade e acessível porque incorporamos uma série de recursos proprietários e uma nova fórmula. Com esta atualização, você poderá mostrar fusos horários duplos. Você não só será capaz de mostrar um TF mais alto, mas também mostrar ambos, o TF do gráfico, MAIS o TF mais alto: MOSTRANDO ZONAS ANINHADAS. Todos os traders de Oferta e Demanda
Meravith MT5
Ivan Stefanov
5 (1)
Ferramenta dos market makers. O Meravith irá: Analisar todos os timeframes e exibir a tendência atual em vigor. Destacar zonas de liquidez (equilíbrio de volume) onde o volume comprador e vendedor é igual. Mostrar todos os níveis de liquidez de diferentes timeframes diretamente no seu gráfico. Gerar e apresentar análise de mercado em formato de texto para sua referência. Calcular alvos, níveis de suporte e pontos de stop-loss com base na tendência atual. Calcular a relação risco/retorno das suas
PZ Trend Trading MT5
PZ TRADING SLU
3.8 (5)
O Trend Trading é um indicador projetado para lucrar o máximo possível com as tendências que ocorrem no mercado, cronometrando retrocessos e rupturas. Ele encontra oportunidades de negociação analisando o que o preço está fazendo durante as tendências estabelecidas. [ Guia de instalação | Guia de atualização | Solução de problemas | FAQ | Todos os produtos ] Negocie mercados financeiros com confiança e eficiência Lucre com as tendências estabelecidas sem ser chicoteado Reconhecer retrocessos
Trend Forecaster
Alexey Minkov
5 (7)
12% OFF EASTER SALE The Trend Forecaster indicator utilizes a unique proprietary algorithm to determine entry points for a breakout trading strategy. The indicator identifies price clusters, analyzes price movement near levels, and provides a signal when the price breaks through a level. The Trend Forecaster indicator is suitable for all financial assets, including currencies (Forex), metals, stocks, indices, and cryptocurrencies. You can also adjust the indicator to work on any time frames, alt
FX Analysis is an all-in-one MT5 indicator dashboard that combines eight analytical tools in a single panel, helping traders identify high-probability setups without switching between charts or indicators. Designed for standard forex pairs on MetaTrader 5. Best results on M15 - H4 timeframes when all components are used together as part of the included workflow. Components Volatility Analyzer Displays historical average movement by hour and by day of the week. A real-time Pip Balance shows the
Shock Pullback
Suleiman Alhawamdah
5 (1)
De forma simples, você pode começar a operar quando o movimento dos números brancos — conhecidos como "pips" — começar a aparecer ao lado do candle atual. Os "pips" brancos indicam que uma operação de compra ou venda está ativa e se movendo na direção correta, conforme indicado pela cor branca. Quando o movimento dos pips brancos para e se transforma em uma cor verde estática, isso sinaliza o fim do momento atual. A cor verde dos números representa o lucro total obtido em "pips", independenteme
Este é um indicador para MT5 que fornece sinais precisos para entrar em uma negociação sem redesenhar. Ele pode ser aplicado a qualquer ativo financeiro: forex, criptomoedas, metais, ações, índices. Ele fornecerá estimativas bastante precisas e informará quando é melhor abrir e fechar um negócio. Assista o vídeo (6:22) com um exemplo de processamento de apenas um sinal que compensou o indicador! A maioria dos traders melhora seus resultados de negociação durante a primeira semana de negociação c
Introduction to X3 Chart Pattern Scanner X3 Cherart Pattern Scanner is the non-repainting and non-lagging indicator detecting X3 chart patterns including Harmonic pattern, Elliott Wave pattern, X3 patterns, and Japanese Candlestick patterns. Historical patterns match with signal patterns. Hence, you can readily develop the solid trading strategy in your chart. More importantly, this superb pattern scanner can detect the optimal pattern of its kind. In addition, you can switch on and off individu
Este indicador é um indicador para análise automática de ondas que é perfeito para negociações práticas! Caso... Nota:   Não estou acostumado a usar nomes ocidentais para classificação de ondas. Devido à influência da convenção de nomenclatura de Tang Lun (Tang Zhong Shuo Zen), nomeei a onda básica como   uma caneta   e a banda de onda secundária como   um segmento   . ao mesmo tempo, o segmento tem a direção da tendência.   O segmento de tendência principal   é nomeado (esse método de nomencl
Difícil de encontrar e com pouca frequência, as divergências são um dos cenários de negociação mais confiáveis. Este indicador localiza e verifica automaticamente divergências ocultas e regulares usando seu oscilador favorito. [ Guia de instalação | Guia de atualização | Solução de problemas | FAQ | Todos os produtos ] Fácil de trocar Encontra divergências regulares e ocultas Suporta muitos osciladores conhecidos Implementa sinais de negociação baseados em fugas Exibe níveis adequados de sto
PZ Day Trading MT5
PZ TRADING SLU
2.83 (6)
Este indicador detecta reversões de preços em zigue-zague, usando apenas análise de ação de preços e um canal donchiano. Ele foi projetado especificamente para negociações de curto prazo, sem repintar ou retroceder. É uma ferramenta fantástica para traders astutos, com o objetivo de aumentar o tempo de suas operações. [ Guia de instalação | Guia de atualização | Solução de problemas | FAQ | Todos os produtos ] Surpreendentemente fácil de negociar Fornece valor em cada período de tempo Impleme
Ultimate SMC Indicator
Hicham Mahmoud Almoustafa
1 (1)
Ultimate SMC Indicator v2.20 — Smart Money Concepts All-in-One Stop switching between 5 different indicators. Ultimate SMC gives you everything Smart Money traders need — in one clean indicator with interactive controls. GUIDE What makes this different? Most SMC indicators show you Order Blocks or FVGs separately. You still have to figure out which zones actually matter. Ultimate SMC does the hard work: it scans for Order Blocks, Fair Value Gaps, Liquidity Sweeps, Supply & Demand zones, Fibo
Ajuda a determinar se este ponto é adequado para comprar. Ajuda a determinar se este ponto é adequado para vender. Quando os quatro indicadores atingem o fundo ao mesmo tempo, concentre-se nas oportunidades de repique. Quando os quatro indicadores estão simultaneamente no topo, concentre-se nas oportunidades de queda. Este sistema foi desenvolvido com base em tecnologia algorítmica chinesa avançada e em uma estrutura de modelagem matemática de alto nível. Eu uso este indicador principalmente no
ACB Breakout Arrows MT5
KEENBASE SOFTWARE SOLUTIONS
3.5 (2)
O indicador ACB Breakout Arrows fornece um sinal de entrada crucial no mercado ao detectar um padrão especial de rompimento. O indicador escaneia constantemente o gráfico em busca de um momento de consolidação em uma direção e fornece o sinal preciso logo antes do movimento principal. Obtenha o scanner de múltiplos ativos e múltiplos períodos aqui - Scanner para ACB Breakout Arrows MT5 Principais recursos Níveis de Stop Loss e Take Profit são fornecidos pelo indicador. Acompanha um painel Scan
Mais do autor
Product Description: Adaptive Y-Axis Scaling is a powerful MT5 indicator designed to enhance your trading experience by providing precise control over the Y-axis (price) scaling of your charts. This innovative tool allows you to customize the price scaling by specifying the number of pips from the visible chart's highs and lows. The calculated price range from this input is then used to set the maximum and minimum prices for the open chart, ensuring an optimized and comprehensive view of market
FREE
Introducing the B4S BidLine CandleTimer An insightful indicator that combines real-time bid line visualization with a dynamic countdown timer. Gain a competitive edge in your trading as you stay informed about the time remaining until the next candle starts, all displayed seamlessly on your chart. Why B4S BidLine CandleTimer? Unleash the potential of your trading strategy with the B4S BidLine CandleTimer. Here's why this indicator stands out: Real-Time Bid Line: Witness market movements like nev
B4S ChartExplorer
Henry Waribu Macharia
Brief Description: An advanced navigation, news display, and control panel indicator designed to revolutionize your chart analysis experience. Seamlessly navigate through timeframes, dates, and times with an intuitive control panel, and stay informed with visually represented detailed news events. Now with enhanced features and improvements for an even better trading experience. Key Features: User-Friendly Control Panel: Easily navigate through timeframes, dates, and times. Enable or disable the
Brief Description B4S Economic News Radar now offers enhanced features to keep traders informed and empowered. Experience comprehensive news coverage directly on your trading chart, including upcoming and past events, customizable reminders, and automatic time zone adjustments. Why News Events Matter: Market volatility triggered by economic indicators, central bank decisions, and geopolitical events can significantly impact trading outcomes. Stay ahead of these shifts with timely information and
Brief Description: A tool to display historical Open, High, Low, and Close (OHLC) price points for various time periods. Gain insights into market behavior with data from yesterday, the day before, the previous week, and the previous month. Recognize liquidity zones effectively. Features: 1. Comprehensive Timeframe Insights: Visualize crucial OHLC points for different timeframes. Historical data for yesterday, day before yesterday, previous week, and previous month. 2. Built on ICT's Teachings:
Brief Description The indicator is a powerful tool based on Inner Circle Trader's trading theory. It strategically plots lines at key prices relative to time, highlighting crucial market moments such as Tokyo Open, New York Midnight, London Open, New York Open, New York 8:30 AM, and New York Session End. The indicator is built on the foundation of Inner Circle Trader's trading theory, emphasizing the significance of key open times as liquidity and reference zones. These zones act as magnets for
B4S ICT Killzones
Henry Waribu Macharia
Brief Description The B4S_ICT_Killzones indicator is designed to enhance your trading strategy by highlighting key market times based on the Inner Circle Trader's (ICT) proven trading model. This indicator intelligently plots colored boxes around critical "killzone" periods, providing valuable insights into market behavior influenced by different geographical and time zone locations and time variations. Features / Indicator Settings 1. Killzone Identification Asian Range: Target the Asian tradin
Brief Description: The B4S_Institutional_Round_Number_Prices indicator identifies and marks key price levels, known as round number prices or institutional price levels, renowned for their psychological significance. These levels often influence institutional activity, attracting attention and triggering significant market moves.   Features: Round Number Price Identification: The indicator excels at identifying round number prices, providing you with crucial insights into potential market moveme
Filtro:
Sem comentários
Responder ao comentário