 MetaTrader 5
 Experts
 Indicadores
 Bibliotecas
 Utilitários
 Widgets
 Regras
Conheça o Mercado MQL5 no YouTube, assista aos vídeos tutoriais
Como comprar um robô de negociação ou indicador?
Execute seu EA na
hospedagem virtual
hospedagem virtual
Teste indicadores/robôs de negociação antes de comprá-los
Quer ganhar dinheiro no Mercado?
Como apresentar um produto para o consumidor final?
Indicadores Técnicos para MetaTrader 5 - 214
 É com base nos sinais de indicadores técnicos que se aplicam as decisões para abertura ou fechamento de uma transação nos mercados de ações e Forex. A essência dos indicadores reside na previsão de mudanças de preço, com base na conversão matemática de preço e/ou volumes de um instrumento financeiro.
Teste os indicadores técnicos para prever melhor o comportamento do mercado e lucrar com isso.

# Reversal Probability Gauge - Historical frequency by analogy
*Category: Oscillators | Difficulty: advanced | Window: separate window below the chart | Markets: Universal (Forex, indices, commodities, crypto, stocks) | Suggested timeframes: M30, H1, H4, D1*
## Short description
> Searches history for bars with a state similar to the current one and counts in what percentage of those cases price then moved the opposite way. It is an observed frequency, not a forecast.
## Full description
#

is a versatile analytical tool designed for both advanced traders and beginners. It combines classic trend line analysis with automatic Fibonacci level plotting to deliver precise market entries and structural clarity. Built as an intuitive and clean on-screen dashboard, this indicator simplifies multi-timeframe analysis without cluttering your main workspace. Technical Analysis and Entry Points The indicator automates the most critical aspects of price action and structural trading: Trend L
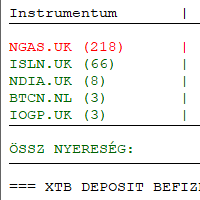
Introducing my indicator in Meta Trader 5. XTB export analysis and charting and export of currency conversion to csv for tax return. This indicator is an independent development and has no official connection with XTB S.A. https://youtu.be/z9JVhqKdKns
Hungary: Meta Trader 5 ben indikátorom bemutatása. XTB export elemzése és chartra kiíratása és adóbevalláshoz deviza konverzió csv.-be exportálása. Ez az indikátor egy független fejlesztés, és semmilyen hivatalos kapcsolatban nem áll az XTB S.A. v

QUANTUM OCEAN SIGNALS MT5
Quantum Ocean Signals MT5 is a multi-filter decision-support indicator for MetaTrader 5. It evaluates trend direction, momentum, directional strength, volatility and candle confirmation to display structured BUY and SELL setups after a candle has closed.
The indicator does not open or manage trades. It gives manual traders a clear trade plan consisting of a signal, an adaptive Stop Loss and three optional Take Profit reference levels.
MAIN FEATURES
• Closed-candle

Level Alert Utility is an essential workflow tool for MetaTrader 5 designed to eliminate constant screen fatigue. Effortlessly drag the interactive level line directly on your chart—the indicator instantly configures trigger rules and delivers real-time notifications via customizable sound repeats, popup alerts, mobile Push notifications, and email. Equipped with high-speed millisecond monitoring, gap and impulse protection, quick-action chart buttons, hotkey support, and state persistence acros

SMC SYNTHRIDERS — Smart Money, Liquidity and Market Phase Trading Indicator SMC SYNTHRIDERS is a MetaTrader 5 market-analysis and signal indicator developed by MohSOLUTIONS . It is designed for traders who analyse price through market structure, liquidity behaviour, Smart Money Concepts, multi-timeframe context and market phases . Rather than generating signals from a single condition, SMC SYNTHRIDERS combines multiple layers of market information to identify conditions where a structured tradin

MACandleApproxPro — Advanced MA Candle Reconstruction & Multi-Dimensional Market Structure Indicator Overview MACandleApproxPro is a comprehensive technical analysis tool designed for professional traders. It breaks through the limitations of traditional moving averages by reconstructing MA data into "MA Candles" through complex algorithms. This unique visualization filters out market noise, allowing you to examine price trends, momentum shifts, and critical market structures from a more

# Level Strength Ranker - Only the two levels that matter
*Category: Support and Resistance | Difficulty: intermediate | Window: chart window (overlaid on price) | Markets: Universal (Forex, indices, commodities, crypto, stocks) | Suggested timeframes: M30, H1, H4, D1*
## Short description
> Scores every level by number of touches, size of reactions and recency, drawing only the strongest one above and below price.
## Full description
### Overview
Not all levels are equal. A level touched

# Round Number Magnet - Do round numbers really matter?
*Category: Support and Resistance | Difficulty: beginner | Window: chart window (overlaid on price) | Markets: Universal (Forex, indices, commodities, crypto, stocks) | Suggested timeframes: M15, M30, H1, H4, D1*
## Short description
> Draws round levels with an automatically computed step and measures how much price actually reacts to them on this specific instrument.
## Full description
### Overview
Round numbers attract orders: st

# Break Retest Detector - The full sequence, not just the break
*Category: Support and Resistance | Difficulty: intermediate | Window: chart window (overlaid on price) | Markets: Universal (Forex, indices, commodities, crypto, stocks) | Suggested timeframes: M15, M30, H1, H4, D1*
## Short description
> Recognises the full sequence of break, return to the level and reaction. It signals only when all three conditions occur in the correct order.
## Full description
### Overview
Breaking a le

Multi-Symbol MTF Scanner
Apanhe o setup no momento exacto em que o padrão se completa O Multi-Symbol MTF Scanner vigia toda a sua watchlist em vários timeframes ao mesmo tempo e assinala o momento exacto em que um mercado completa um setup de swing multi-fase. Foi concebido para traders que seguem uma rotina multi-timeframe e multi-símbolo e não querem percorrer dezenas de gráficos para encontrar o único setup que está pronto. Todo o setup é calculado nativamente dentro da ferramenta, fase a fas

# Dynamic Pivot Zones - Pivots as zones, not lines
*Category: Support and Resistance | Difficulty: beginner | Window: chart window (overlaid on price) | Markets: Universal (Forex, indices, commodities, crypto, stocks) | Suggested timeframes: M5, M15, M30, H1*
## Short description
> Turns pivots into zones whose width depends on the previous period volatility. The levels stay fixed for the whole session, with no recalculation.
## Full description
### Overview
Classic pivots are infinitely

# Supply Demand Zone Mapper - Compressed base and decisive departure
*Category: Support and Resistance | Difficulty: intermediate | Window: chart window (overlaid on price) | Markets: Universal (Forex, indices, commodities, crypto, stocks) | Suggested timeframes: M15, M30, H1, H4, D1*
## Short description
> Recognises consolidation bases followed by a decisive move and draws them as zones, which remain until price crosses them fully.
## Full description
### Overview
A demand zone forms wh

# Untested Level Finder - The levels still intact
*Category: Support and Resistance | Difficulty: beginner | Window: chart window (overlaid on price) | Markets: Universal (Forex, indices, commodities, crypto, stocks) | Suggested timeframes: M15, M30, H1, H4, D1*
## Short description
> Draws only the swing levels price has never retested since they formed. A level stops being drawn the moment it is tested.
## Full description
### Overview
A level that has already rejected price three times

# Confluence Score Map - Where several references converge
*Category: Support and Resistance | Difficulty: advanced | Window: chart window (overlaid on price) | Markets: Universal (Forex, indices, commodities, crypto, stocks) | Suggested timeframes: M30, H1, H4, D1*
## Short description
> Computes four independent families of levels and draws only the price bands where at least the required minimum number of references converges.
## Full description
### Overview
A level where several inde

# False Breakout Filter - The failed break as a signal
*Category: Support and Resistance | Difficulty: intermediate | Window: chart window (overlaid on price) | Markets: Universal (Forex, indices, commodities, crypto, stocks) | Suggested timeframes: M15, M30, H1, H4, D1*
## Short description
> Watches every break for a fixed number of bars and classifies it only afterwards. A failed break produces an arrow the opposite way, because it is itself a signal.
## Full description
### Overview
E

# Range Boundary Tracker - Edges that do not follow price
*Category: Support and Resistance | Difficulty: intermediate | Window: chart window (overlaid on price) | Markets: Universal (Forex, indices, commodities, crypto, stocks) | Suggested timeframes: M15, M30, H1, H4, D1*
## Short description
> Recognises when the market enters a range, fixes its two extremes and holds them still while the range lasts, as a trader would draw them.
## Full description
### Overview
A channel that follows

# Level Decay Model - A level that wears out
*Category: Support and Resistance | Difficulty: advanced | Window: chart window (overlaid on price) | Markets: Universal (Forex, indices, commodities, crypto, stocks) | Suggested timeframes: M30, H1, H4, D1*
## Short description
> Assigns each level a strength that decays over time and with every test it undergoes. The level is abandoned once residual strength falls below the threshold.
## Full description
### Overview
A level does not have unl

Indicador Crypto_Forex "Padrão Homem Enforcado e Martelo Invertido" para MT5, sem repintura, sem atraso. - O indicador "Padrão Homem Enforcado e Martelo Invertido" é um indicador muito poderoso para negociação de Price Action. - O indicador detecta padrões de Martelo Invertido de alta e Homem Enforcado de baixa no gráfico: - Martelo Invertido de alta - Sinal de seta azul no gráfico (veja as imagens). - Homem Enforcado de baixa - Sinal de seta vermelha no gráfico (veja as imagens). - Com alertas

Makito AD is a volume-based market analysis indicator designed to identify market trends and changes in market direction by analyzing the relationship between price action and volume . The indicator uses a dynamic line that changes color based on the current market condition , making it easier to visually identify whether market pressure is becoming bullish, bearish, or showing potential divergence. Key Features Volume-Based Analysis — Uses volume and price action to assess market direction. Dyn

Probability Cone MT5 — Statistical Price Projection Indicator Probability Cone MT5 is a technical analysis tool that projects statistically grounded price ranges forward on the chart. Using a log-normal volatility model — the same mathematical approach behind option pricing and quantitative risk tools — the indicator calculates where price is statistically likely to travel over a chosen time horizon. Statistical Price Projection Instead of eyeballing support, resistance, or a breakout target, Pr

Footprint Visual Order flow footprint chart, drawn directly in the main window, sharing the real price scale of your candles. Short description (for the Market listing) Footprint Visual draws a real bid/ask footprint — buy and sell volume per price level, POC, Value Area and net delta — for each of the most recent bars, right next to your candles. Built on genuine volume_real tick data (not tick-count approximations), it works on any symbol whose broker feed reports real trade volume, and is tun

Marca o intervalo de máxima/mínima de uma sessão personalizada e gera sinais de compra/venda por rompimento de pavio, filtrados por um Supertrend adaptativo integrado, com confirmação opcional de viés em timeframe superior e ADX, além de linhas guia de TP/SL automáticas. Principais recursos Caixa de intervalo de sessão — rastreia e desenha automaticamente a máxima/mínima de qualquer sessão personalizada (seu horário SAST, a sessão asiática ou a abertura de Londres), atualizada em tempo real e tr

Stop Watching Key Price Levels. Get Alerted. Horizontal Line Alert automatically monitors a price level and alerts you when price closes above, closes below, or touches the line . Go beyond a basic horizontal-line alert with candle confirmation, candle-size filtering, and price-action conditions . KEY FEATURES Close Above
Detect qualifying bullish candles closing above your horizontal level. Close Below
Detect qualifying bearish candles closing below your level. Close Above / Bel

Como funciona O indicador calcula o VWAP (Volume Weighted Average Price) — o preço médio ponderado pelo volume negociado, muito usado por operadores institucionais como referência de "preço justo" do dia. Diferente de uma média móvel comum, o VWAP dá mais peso aos períodos de maior volume, refletindo onde a maior parte do dinheiro realmente foi negociada. O produto reúne três formas de calcular essa média no mesmo indicador, sem precisar instalar ferramentas separadas: Diária : a soma reinicia

Stop guessing where a pullback ends. Most traders can spot a trend. The hard part is the entry — buying too early into a falling knife, or chasing after the move has already gone. Fibonacci Trend Compass solves exactly that one problem, and it does it on autopilot. Three steps, fully automatic: It reads the trend. An adaptive ATR trend engine paints the chart green or red and tells you which side of the market you are allowed to trade. It maps the impulse leg. Confirmed swing highs and lows

Kiwi Smart Trend System MT5 is a multi-feature trend and signal indicator for MetaTrader 5. The indicator combines trend direction, momentum, volatility, volume and multi-timeframe analysis in one clear chart system. It is designed to help traders identify market direction, evaluate signal conditions and plan potential entries with configurable risk-to-reward zones. Kiwi Smart Trend System is an analytical indicator. It does not open, modify or close trades. MAIN FEATURES Bullish and bearish tre

Iron Entry — Real-Time Signal Engine with Trend Filter & Momentum Candles Why You Should Choose This Indicator
Most signal tools redraw their arrows after the fact, by the time you notice a "signal," it's already changed or vanished. Iron Entry doesn't do that.
This indicator locks in its pivots and signals the moment they close, and once printed, they never move, disappear, or repaint. What you see live is exactly what stays on your chart tomorrow, next week, and next year. That means you c

# Candle Body Anatomy - Candle proportions in numbers
*Category: Pattern Recognition | Difficulty: beginner | Window: separate window below the chart | Markets: Universal (Forex, indices, commodities, crypto, stocks) | Suggested timeframes: M15, M30, H1, H4, D1*
## Short description
> Splits every candle into body and wicks as a percentage of the range and classifies it on explicit numeric thresholds instead of qualitative judgement.
## Full description
### Overview
Traditional candle nam

# Engulfing Quality Score - Not all engulfings are equal
*Category: Pattern Recognition | Difficulty: intermediate | Window: chart window (overlaid on price) | Markets: Universal (Forex, indices, commodities, crypto, stocks) | Suggested timeframes: M15, M30, H1, H4, D1*
## Short description
> Checks the engulfing pattern and scores it on four additional criteria, flagging only those exceeding the quality threshold.
## Full description
### Overview
The engulfing pattern is among the best k

# Inside Bar Breakout Map - Compression with ready levels
*Category: Pattern Recognition | Difficulty: beginner | Window: chart window (overlaid on price) | Markets: Universal (Forex, indices, commodities, crypto, stocks) | Suggested timeframes: M15, M30, H1, H4, D1*
## Short description
> Counts consecutive inside bars and draws the two breakout levels of the mother bar, holding them fixed while the pattern is active.
## Full description
### Overview
An inside bar, entirely contained wit

# Pin Bar Rejection Scanner - Rejection where it matters
*Category: Pattern Recognition | Difficulty: intermediate | Window: chart window (overlaid on price) | Markets: Universal (Forex, indices, commodities, crypto, stocks) | Suggested timeframes: M15, M30, H1, H4, D1*
## Short description
> Recognises bars with a dominant wick but flags them only when they are significant in absolute terms and occur at a recent extreme.
## Full description
### Overview
A bar with a very long wick tells

# Three Bar Structure Map - Geometry without thresholds
*Category: Pattern Recognition | Difficulty: beginner | Window: separate window below the chart | Markets: Universal (Forex, indices, commodities, crypto, stocks) | Suggested timeframes: M15, M30, H1, H4, D1*
## Short description
> Classifies every three bar group into four geometric configurations, using no arbitrary threshold: two bars either exceed each other or they do not.
## Full description
### Overview
Every group of three co
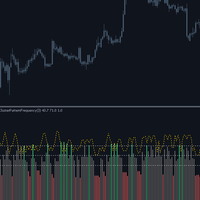
# Cluster Pattern Frequency - Eight sequences and their statistics
*Category: Pattern Recognition | Difficulty: advanced | Window: separate window below the chart | Markets: Universal (Forex, indices, commodities, crypto, stocks) | Suggested timeframes: M30, H1, H4, D1*
## Short description
> Encodes every three bar sequence into one of eight possible configurations and measures the historical frequency of it being followed by an upward move.
## Full description
### Overview
Every three b

Level Reaction traça níveis de suporte e resistência a partir de um tempo gráfico maior e marca dois tipos de reação do preço a eles: uma continuação de rompimento (breakout) e uma reversão no nível. Funciona em qualquer símbolo e tempo gráfico disponível no seu terminal. Como os níveis são construídos No início de cada barra de tempo gráfico maior, o indicador pega a máxima, a mínima e o fechamento da barra anterior e deriva cinco níveis de resistência e cinco de suporte em torno desse fechamen

# Momentum Thrust Pattern - Thrust, pause, resumption
*Category: Pattern Recognition | Difficulty: intermediate | Window: chart window (overlaid on price) | Markets: Universal (Forex, indices, commodities, crypto, stocks) | Suggested timeframes: M15, M30, H1, H4, D1*
## Short description
> Recognises the thrust, contained pause and resumption beyond the extreme sequence, signalling only once all three phases have completed.
## Full description
### Overview
Directional moves almost always

# Higher Timeframe Bias - The higher timeframe without deception
*Category: Multi Timeframe Hybrids | Difficulty: intermediate | Window: separate window below the chart | Markets: Universal (Forex, indices, commodities, crypto, stocks) | Suggested timeframes: M5, M15, M30, H1, H4*
## Short description
> Brings a higher timeframe direction onto the current chart using only already closed bars, avoiding the most insidious form of repaint.
## Full description
### Overview
Multi timeframe ind

This draws fewer zones than the free order block indicators do. That's the whole point, and it's worth saying before you look at a screenshot and decide something is broken. On the gold chart I grabbed while writing this, the engine found 54 points of interest and marked 2 as tradeable. The other 52 sit on the chart only if you ask for them, greyed out and labelled what the material calls them: traps. Why it draws less than everything else Every order block tool I've used marks every block. Scro

An indicator that marks support and resistance areas by counting how many separate times price has returned to them. Every counted return is marked on the chart, so the count can be checked against the chart history.
What it draws Elektra Look Left draws two zones. One below price, for buys. One above price, for sells. Nothing else is added to the chart. Each zone is drawn as a rectangle rather than a single line. The height of the rectangle is the measured spread of the swings that formed

Introducing my indicator in Meta Trader 5. Trading212 export analysis and charting and exporting to csv. This indicator is an independent development and has no official connection with Trading212 (Trading 212 Markets Ltd.). https://www.youtube.com/watch?v=_hzdqUJgwo4
Hungary: Meta Trader 5 ben indikátorom bemutatása. Trading212 export elemzése és chartra kiíratása és csv.-be exportálása. Ez az indikátor egy független fejlesztés, és semmilyen hivatalos kapcsolatban nem áll a Trading212 vállalat

Trendline MachineGun MT5 Trendline MachineGun é um indicador automático de linhas de tendência de suporte e resistência para MetaTrader 5. Ele foi desenvolvido para traders que desejam analisar a estrutura do mercado sem precisar desenhar e comparar manualmente diversas linhas de tendência. O indicador identifica máximas e mínimas de swing confirmadas, cria várias linhas de tendência candidatas, avalia a força de cada linha, remove estruturas muito semelhantes e mantém no gráfico as linhas consi
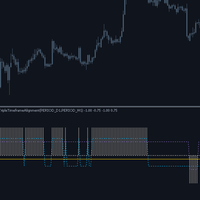
# Triple Timeframe Alignment - Three horizons, one score
*Category: Multi Timeframe Hybrids | Difficulty: intermediate | Window: separate window below the chart | Markets: Universal (Forex, indices, commodities, crypto, stocks) | Suggested timeframes: M5, M15, M30, H1, H4*
## Short description
> Checks whether current, middle and higher timeframes point the same way, showing both the overall score and each horizon direction.
## Full description
### Overview
Full alignment of the three tim

# HTF Level Projector - The levels everyone watches
*Category: Multi Timeframe Hybrids | Difficulty: beginner | Window: chart window (overlaid on price) | Markets: Universal (Forex, indices, commodities, crypto, stocks) | Suggested timeframes: M5, M15, M30, H1, H4*
## Short description
> Projects onto the current chart the high, low and close of the last complete higher period, updating only on period close.
## Full description
### Overview
Yesterday high and low are shared references, no

# Timeframe Divergence Monitor - When horizons disagree
*Category: Multi Timeframe Hybrids | Difficulty: intermediate | Window: separate window below the chart | Markets: Universal (Forex, indices, commodities, crypto, stocks) | Suggested timeframes: M5, M15, M30, H1, H4*
## Short description
> Measures the momentum disagreement between current and higher timeframes, highlighting phases where the two horizons move in opposite directions.
## Full description
### Overview
When the current t

# Volume Support Resistance Map - Supports and resistances drawn by volume
*Category: Experimental | Difficulty: intermediate | Window: chart window (overlaid on price) | Markets: Universal (Forex, indices, commodities, crypto, stocks) | Suggested timeframes: M15, M30, H1, H4, D1*
## Short description
> Horizontal bars drawn on the chart, long in proportion to the volume traded at each level: above price the selling volume marking resistances, below it the buying volume marking supports.
##

Uma descrição completa para publicar seu indicador no MQL5 Market ou em plataformas de negociação: Candle Timer Jason – Contador de Tempo para Velas (MT5) O Candle Timer Jason é um indicador prático e ultra leve desenvolvido para o MetaTrader 5, ideal para traders de Forex, B3 e Criptomoedas que precisam acompanhar o tempo exato restante para o fechamento do candle atual. Saber exatamente quantos minutos e segundos faltam para o término de uma vela é fundamental para tomar decisões precisas de e

️ Candle Timer Advanced Suite Glass 3D effect for MetaTrader 5
Gain the ultimate edge in precision timing with the Candle Timer Advanced Suite. This is not just a simple countdown; it is a professional-grade analytical tool designed to keep you perfectly synchronized with the market, ensuring you never miss a critical entry or exit due to server lag or misinterpretation. Built specifically for MetaTrader 5, this suite offers unparalleled flexibility, allowing you to visualize time exactly how

Cross Over Trend – Indicador de Cruzamento EMA/SMA Cross Over Trend é um indicador técnico simples e eficiente para MetaTrader 5 que visualiza a relação entre uma Média Móvel Exponencial (EMA) e uma Média Móvel Simples (SMA) . O indicador facilita a identificação da direção atual da tendência, dividindo automaticamente as fases do mercado em tendência de alta (UpTrend) e tendência de baixa (DownTrend) com base na relação entre a EMA e a SMA. Funcionamento O indicador compara os valores atuais da
Indicador de Desvio VWAP (VWAP Deviation Indicator) O Indicador de Desvio VWAP é uma ferramenta de análise de preços baseada em volume, desenvolvida para identificar a relação entre o preço atual, uma base VWAP calculada dinamicamente e os respetivos níveis de desvio. Ao contrário de uma média móvel simples, este indicador utiliza ponderação pelo volume de ticks , permitindo que os níveis de preço associados a uma maior atividade de negociação tenham maior importância no cálculo do VWAP. O indic

VWAP Analytics Advanced Suite for MetaTrader 5
Gain institutional-grade market insight with the VWAP Analytics Advanced Suite , a professional Volume Weighted Average Price indicator built exclusively for MetaTrader 5. This tool goes beyond a simple VWAP line; it is a complete analytical ecosystem designed to identify trend bias, measure market deviation, and provide high-probability entry and exit signals with precision timing. Whether you are a day trader, scalper, or swing trader, this su

Spread & Broker Server Analytics Advanced Suite Glass 3D effect for MetaTrader 5 ( Dashboard & compact dashboard)
Master the fundamental mechanism of market liquidity with the Spread Analytics Advanced Suite, a professional-grade monitoring and alert tool built exclusively for MetaTrader 5. In modern trading, the Bid-Ask spread is your primary transaction cost. This suite provides the transparency and precision required to manage these costs effectively, ensuring you trade only when conditio

Moment Analytics: Confluence Dashboard Advanced Suite for MetaTrader 5
Gain an unparalleled edge in market timing and trend confirmation with the Moment Analytics Confluence Dashboard , a professional-grade analytical suite built exclusively for MetaTrader 5. This tool consolidates nine of the most powerful momentum and volatility indicators into a single, cohesive on-chart HUD (Heads-Up Display), eliminating chart clutter and providing instant, at-a-glance confluence signals. Whether you ar

Price Alerts Advanced Suite for MetaTrader 5
Take control of your trading execution with the Price Alerts Advanced Suite , a professional-grade technical analysis tool built exclusively for MetaTrader 5. This suite goes far beyond simple horizontal lines; it is a complete analytical ecosystem designed to identify key market levels, monitor price action in real-time, and deliver instant notifications across multiple channels. Whether you are a day trader, swing trader, or algorithmic develope

Bollinger Trend Signals MT5 - Um indicador de tendência baseado nas Bandas de Bollinger. Todos os sinais são gerados sem redesenho ou atraso. Identifica um canal de tendência direcional,
potenciais pontos de entrada e saída.
Como funciona o indicador
A funcionalidade do indicador baseia-se na utilização combinada de um canal de tendência e de um sistema para determinar os pontos de preço máximos e mínimos.
A linha azul é a principal linha de tendência suavizada; quando está acima do preço, o

Um indicador que monta um sistema complexo a partir de indicadores padrão e realiza backtesting imediato no histórico de um gráfico. Uma matriz de 16 indicadores em 9 timeframes: clicar numa célula adiciona um indicador à combinação para o período desejado, a combinação vota e o limite de votação gera um sinal. As estatísticas são recalculadas a cada alteração na composição: resultado, número de operações, percentagem de operações lucrativas, fator de lucro, valor esperado e drawdown. O otimiza

MTF LRMA Plus: Multi-Timeframe Trading Decision System Linear Regression Moving Average with ADX Trend Strength Analysis Across 6 Timeframes Product Overview MTF LRMA Plus is a professional-grade trading indicator that combines Linear Regression Moving Average (LRMA) trend analysis with ADX (Average Directional Index) trend strength measurement across 6 key timeframes (D1, H4, H1, M30, M15, M5). It delivers actionable insights through an intuitive visual dashboard, helping traders identify h

GOLDEN CROSS V1.0 - Moving Average Crossover Indicator with Quality Score General Description The GOLDEN CROSS is an advanced technical indicator developed for MetaTrader 5 that combines moving average crossovers with a quality scoring system based on multiple technical filters. It is designed to identify high-probability entry points, offering traders interactive visual tools and comprehensive risk management features. Indicator Structure and Logic 1. Crossover System Fas

KITO Opportunity ATLAS
MARKET OPPORTUNITY INTELLIGENCE FOR MT5 The market rarely suffers from a shortage of signals. The real challenge is knowing which opportunities deserve your attention—and which ones deserve to be ignored. Kito Atlas transforms your MetaTrader 5 terminal into a multi-market opportunity command centre. From one compact dashboard, it scans multiple symbols and timeframes, compares several forms of market evidence, ranks the strongest opportunities and opens a structured price

This custom algorithmic indicator is a zero-lag, non-repainting trading tool engineered for precision entries. By fusing a proprietary combination of momentum and structural metrics behind the scenes, it identifies immediate market exhaustion points without relying on delayed data. Because it calculates and locks its logic the exact millisecond a bar closes, signals will never shift, lag, or repaint after the fact.
Execution & Trade Management:
The One-Candle Rule: The primary execution strate

QQE Signal – Indicador de Estimativa Quantitativa Qualitativa (QQE)
QQE Signal é um indicador técnico baseado em oscilador para MetaTrader 5, desenvolvido para ajudar a identificar possíveis mudanças de tendência e alterações no momentum do mercado através de um RSI suavizado e de uma linha QQE calculada dinamicamente. O indicador apresenta de forma clara a relação entre a linha azul baseada no RSI e a linha QQE suavizada preta pontilhada , utilizando também o importante nível 50 como referênci

MA Flow No.2 See the Flow of Bulls & Bears at a Glance, and Keep the Rhythm of the Market in Your Hands
Tired of staring at dozens of moving averages until your eyes blur? Unsure when to enter, or where to place your stop? MA Flow No.2 upgrades the humble moving average into a complete trend-trading system. No more scattered lines on your chart — instead, a living "river of bulls and bears". Up to 100 moving averages roll together in real time. On every single bar, you can see at a glance w

Volume Footprint é um indicador de order flow por nível de preço para o MetaTrader 5. Em vez de uma única vela, cada barra é decomposta em linhas de preço individuais que mostram o volume bid e ask negociado naquele nível — assim você vê exatamente onde compradores e vendedores negociaram dentro da barra, e não apenas onde o preço fechou. O indicador agrega o fluxo de ticks do gráfico num timeframe menor (selecionado automaticamente em relação ao período do gráfico, ou fixado manualmente) e clas

Sultan of Swing Sultan of Swing is a clean and reliable swing-based signal indicator designed for traders who want clear entries without confusion or lag. The indicator detects price swings and delivers signals only at the open of a new bar. sometimes mid-bar signals but no repainting, and no unnecessary noise. Key Features Non-repainting – Signals stay fixed always. New bar signals only – Alerts appear at the start of the candle, sometimes in the Middle. Price swing logic – Built purely on mar

DaySwingPro Institutional — Multi-Factor Day & Swing Trading Engine Confluence-based BUY/SELL signals with institutional risk management, Smart Money Concepts and a live HUD — engineered with a strict zero-repaint architecture. What is it for? DaySwingPro Institutional is built for day and swing traders who hold positions from one day to several weeks (recommended timeframes: H1, H4, D1 ). Instead of firing arrows on every minor fluctuation, it waits for the trend, momentum and mark

Uma seta manda você comprar. O Obsidian Scalper Pro diz onde comprar, onde fica o stop, onde estão os três alvos, qual deve ser o tamanho da posição para o seu risco e quanto vale o setup em 100. Cada sinal chega como um plano de operação pronto e desenhado no gráfico, e uma janela de estatísticas integrada mostra o resultado honesto dos últimos cem, taxa de acerto com intervalo de confiança inclusive. Cada decisão é tomada em barra fechada, então o histórico que você está olhando é o histórico

Um pool de liquidez é uma máxima ou mínima de swing confirmada que ainda não foi tomada. Um sweep de liquidez é a barra na qual o preço negocia além desse nível e depois fecha de volta dentro do intervalo - o mesmo evento que os traders também chamam de caça ao stop, corrida ao stop, captura de liquidez ou rompimento falso. O Liquidity Sweep Pools MTF marca tanto os pools quanto os sweeps de liquidez feitos sobre eles, no gráfico atual e em um timeframe superior que você escolher, e adiciona um

Supply and Demand + Market Structure Smart Money order block detection, volume-weighted confirmation, and full BOS/CHoCH market structure Check out Rudy Bank for more features: https: // www.mql5.com/en/market/product/193059 Check out Iron Entry for zone entry confirmations: https: // www.mql5.com/en/market/product/193937
Overview
SupplyDemand Edge finds and draws institutional supply and demand order blocks directly on your chart, then backs every one of them up with real market data — volume

See the Market From the Higher-Timeframe Perspective. Ashinton MTF-Trend Pro is a professional multi-timeframe trend analysis indicator for MetaTrader 5, designed to help traders quickly identify directional alignment across Monthly (MN1), Weekly (W1), Daily (D1), and H4 timeframes.
Instead of analyzing each timeframe manually, MTF-Trend Pro brings the bigger market picture into one clean, intuitive dashboard, helping you determine whether the higher timeframes are aligned, conflicted, or deve

ElliottWave Pro — Automatic Wave 2 Detection and Wave 3 Targets An indicator for MetaTrader 5 that automates Elliott Wave and Fibonacci analysis. ElliottWave Pro detects the end of the first impulse (Wave 1), calculates the corrective zone (Wave 2) and draws a ready-to-use trading setup with Stop Loss and Take Profit levels. Key Features Automatic Wave 1 detection: connects points P0 and P1 to show the trend structure. Wave 2 entry zone: a rectangular retracement zone with Fibonacci levels 38.2%

SMC Sentinel — Indicador de Smart Money Concepts Opere com a estrutura. Veja o mercado de uma forma diferente. SMC Sentinel é um avançado indicador de análise de Smart Money Concepts (SMC) para MetaTrader 5 , desenvolvido para reunir vários conceitos de ação do preço em um único sistema de análise gráfica limpo e personalizável. Em vez de depender de um único sinal, o SMC Sentinel analisa a estrutura do mercado, liquidez, desequilíbrios de preço, zonas institucionais, áreas de retração e context
O Mercado MetaTrader contém robôs de negociação e indicadores técnicos para traders, disponíveis diretamente no terminal.
O sistema de pagamento MQL5.community está disponível para todos os usuários registrados do site do MQL5.com para transações em todos os Serviços MetaTrader. Você pode depositar e sacar dinheiro usando WebMoney, PayPal ou um cartão de banco.

Você está perdendo oportunidades de negociação:
- Aplicativos de negociação gratuitos
- 8 000+ sinais para cópia
- Notícias econômicas para análise dos mercados financeiros
Registro
Login
Você concorda com a política do site e com os termos de uso
Se você não tem uma conta, por favor registre-se