 MetaTrader 5
 エキスパート
 インディケータ
 ライブラリ
 ユーティリティ
 ウィジェット
 ルール
YouTubeにあるマーケットチュートリアルビデオをご覧ください
ロボットや指標を購入する
仮想ホスティングで
EAを実行
EAを実行
ロボットや指標を購入前にテストする
マーケットで収入を得る
販売のためにプロダクトをプレゼンテーションする方法
MetaTrader 5のためのテクニカル指標 - 214
 テクニカル指標からのシグナルは、株式および外国為替市場での取引の開始と終了に重要な役割を果たします。指標の本質は、将来の価格変動を予測することを目的とした金融銘柄価格の数学的変換です。
テクニカル指標をテストして、市場の動きとそれからの利益をより正確に予測します。

is a versatile analytical tool designed for both advanced traders and beginners. It combines classic trend line analysis with automatic Fibonacci level plotting to deliver precise market entries and structural clarity. Built as an intuitive and clean on-screen dashboard, this indicator simplifies multi-timeframe analysis without cluttering your main workspace. Technical Analysis and Entry Points The indicator automates the most critical aspects of price action and structural trading: Trend L
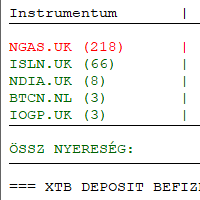
Introducing my indicator in Meta Trader 5. XTB export analysis and charting and export of currency conversion to csv for tax return. This indicator is an independent development and has no official connection with XTB S.A. https://youtu.be/z9JVhqKdKns
Hungary: Meta Trader 5 ben indikátorom bemutatása. XTB export elemzése és chartra kiíratása és adóbevalláshoz deviza konverzió csv.-be exportálása. Ez az indikátor egy független fejlesztés, és semmilyen hivatalos kapcsolatban nem áll az XTB S.A. v

QUANTUM OCEAN SIGNALS MT5
Quantum Ocean Signals MT5 is a multi-filter decision-support indicator for MetaTrader 5. It evaluates trend direction, momentum, directional strength, volatility and candle confirmation to display structured BUY and SELL setups after a candle has closed.
The indicator does not open or manage trades. It gives manual traders a clear trade plan consisting of a signal, an adaptive Stop Loss and three optional Take Profit reference levels.
MAIN FEATURES
• Closed-candle

Level Alert Utility is an essential workflow tool for MetaTrader 5 designed to eliminate constant screen fatigue. Effortlessly drag the interactive level line directly on your chart—the indicator instantly configures trigger rules and delivers real-time notifications via customizable sound repeats, popup alerts, mobile Push notifications, and email. Equipped with high-speed millisecond monitoring, gap and impulse protection, quick-action chart buttons, hotkey support, and state persistence acros

SMC SYNTHRIDERS — Smart Money, Liquidity and Market Phase Trading Indicator SMC SYNTHRIDERS is a MetaTrader 5 market-analysis and signal indicator developed by MohSOLUTIONS . It is designed for traders who analyse price through market structure, liquidity behaviour, Smart Money Concepts, multi-timeframe context and market phases . Rather than generating signals from a single condition, SMC SYNTHRIDERS combines multiple layers of market information to identify conditions where a structured tradin

MACandleApproxPro — Advanced MA Candle Reconstruction & Multi-Dimensional Market Structure Indicator Overview MACandleApproxPro is a comprehensive technical analysis tool designed for professional traders. It breaks through the limitations of traditional moving averages by reconstructing MA data into "MA Candles" through complex algorithms. This unique visualization filters out market noise, allowing you to examine price trends, momentum shifts, and critical market structures from a more

# Level Strength Ranker - Only the two levels that matter
*Category: Support and Resistance | Difficulty: intermediate | Window: chart window (overlaid on price) | Markets: Universal (Forex, indices, commodities, crypto, stocks) | Suggested timeframes: M30, H1, H4, D1*
## Short description
> Scores every level by number of touches, size of reactions and recency, drawing only the strongest one above and below price.
## Full description
### Overview
Not all levels are equal. A level touched

# Round Number Magnet - Do round numbers really matter?
*Category: Support and Resistance | Difficulty: beginner | Window: chart window (overlaid on price) | Markets: Universal (Forex, indices, commodities, crypto, stocks) | Suggested timeframes: M15, M30, H1, H4, D1*
## Short description
> Draws round levels with an automatically computed step and measures how much price actually reacts to them on this specific instrument.
## Full description
### Overview
Round numbers attract orders: st

# Break Retest Detector - The full sequence, not just the break
*Category: Support and Resistance | Difficulty: intermediate | Window: chart window (overlaid on price) | Markets: Universal (Forex, indices, commodities, crypto, stocks) | Suggested timeframes: M15, M30, H1, H4, D1*
## Short description
> Recognises the full sequence of break, return to the level and reaction. It signals only when all three conditions occur in the correct order.
## Full description
### Overview
Breaking a le

Multi-Symbol MTF Scanner
パターンが完成したその瞬間にセットアップを捉える Multi-Symbol MTF Scannerは、ウォッチリスト全体を複数の時間足で一度に監視し、相場が多段階のスイングセットアップを完成させた、まさにその瞬間をお知らせします。マルチタイムフレーム・マルチシンボルのルーティンで取引され、準備の整った一つのセットアップを見つけるために何十ものチャートをクリックして回りたくないトレーダーのために作られています。 セットアップ全体はツール内部でネイティブに、段階ごとに計算されるため、ほかに何もインストールする必要はありません。各セルはセットアップがどこまで形成されたかを「Y段階中X段階」として表示し、最終段階が発生した瞬間に緑色のBUYまたは赤色のSELLへと変わり、ポップアップ、サウンド、そしてスマートフォンへのプッシュ通知でお知らせします。マークするのはエントリーポイントのみで、決済はすべてお客様ご自身の管理下にあります。
MetaTrader 4およびMetaTrader 5に対応しており、Marketでは別々の製品として販売されて

# Dynamic Pivot Zones - Pivots as zones, not lines
*Category: Support and Resistance | Difficulty: beginner | Window: chart window (overlaid on price) | Markets: Universal (Forex, indices, commodities, crypto, stocks) | Suggested timeframes: M5, M15, M30, H1*
## Short description
> Turns pivots into zones whose width depends on the previous period volatility. The levels stay fixed for the whole session, with no recalculation.
## Full description
### Overview
Classic pivots are infinitely

# Supply Demand Zone Mapper - Compressed base and decisive departure
*Category: Support and Resistance | Difficulty: intermediate | Window: chart window (overlaid on price) | Markets: Universal (Forex, indices, commodities, crypto, stocks) | Suggested timeframes: M15, M30, H1, H4, D1*
## Short description
> Recognises consolidation bases followed by a decisive move and draws them as zones, which remain until price crosses them fully.
## Full description
### Overview
A demand zone forms wh

# Untested Level Finder - The levels still intact
*Category: Support and Resistance | Difficulty: beginner | Window: chart window (overlaid on price) | Markets: Universal (Forex, indices, commodities, crypto, stocks) | Suggested timeframes: M15, M30, H1, H4, D1*
## Short description
> Draws only the swing levels price has never retested since they formed. A level stops being drawn the moment it is tested.
## Full description
### Overview
A level that has already rejected price three times

# Confluence Score Map - Where several references converge
*Category: Support and Resistance | Difficulty: advanced | Window: chart window (overlaid on price) | Markets: Universal (Forex, indices, commodities, crypto, stocks) | Suggested timeframes: M30, H1, H4, D1*
## Short description
> Computes four independent families of levels and draws only the price bands where at least the required minimum number of references converges.
## Full description
### Overview
A level where several inde

# False Breakout Filter - The failed break as a signal
*Category: Support and Resistance | Difficulty: intermediate | Window: chart window (overlaid on price) | Markets: Universal (Forex, indices, commodities, crypto, stocks) | Suggested timeframes: M15, M30, H1, H4, D1*
## Short description
> Watches every break for a fixed number of bars and classifies it only afterwards. A failed break produces an arrow the opposite way, because it is itself a signal.
## Full description
### Overview
E

# Range Boundary Tracker - Edges that do not follow price
*Category: Support and Resistance | Difficulty: intermediate | Window: chart window (overlaid on price) | Markets: Universal (Forex, indices, commodities, crypto, stocks) | Suggested timeframes: M15, M30, H1, H4, D1*
## Short description
> Recognises when the market enters a range, fixes its two extremes and holds them still while the range lasts, as a trader would draw them.
## Full description
### Overview
A channel that follows

# Level Decay Model - A level that wears out
*Category: Support and Resistance | Difficulty: advanced | Window: chart window (overlaid on price) | Markets: Universal (Forex, indices, commodities, crypto, stocks) | Suggested timeframes: M30, H1, H4, D1*
## Short description
> Assigns each level a strength that decays over time and with every test it undergoes. The level is abandoned once residual strength falls below the threshold.
## Full description
### Overview
A level does not have unl

MT5用仮想通貨インジケーター「ハンギングマンと逆ハンマーパターン」。リペイントなし、遅延なし。 - 「ハンギングマンと逆ハンマーパターン」は、プライスアクション取引に非常に強力なインジケーターです。 - チャート上で強気の逆ハンマーパターンと弱気のハンギングマンパターンを検出します。 - 強気の逆ハンマー:チャート上に青い矢印シグナル(画像参照)。 - 弱気のハンギングマン:チャート上に赤い矢印シグナル(画像参照)。 - PCアラートとモバイル通知機能付き。 - シグナル矢印は4種類のスタイルから選択可能。 - 「ハンギングマンと逆ハンマーパターン」は、サポート/レジスタンスレベルや指値注文との組み合わせに最適です。 高品質のトレーディングロボットとインジケーターはこちらをクリック! この製品は、MQL5ウェブサイトでのみ提供されているオリジナル製品です。

Makito AD is a volume-based market analysis indicator designed to identify market trends and changes in market direction by analyzing the relationship between price action and volume . The indicator uses a dynamic line that changes color based on the current market condition , making it easier to visually identify whether market pressure is becoming bullish, bearish, or showing potential divergence. Key Features Volume-Based Analysis — Uses volume and price action to assess market direction. Dyn

Probability Cone MT5 — Statistical Price Projection Indicator Probability Cone MT5 is a technical analysis tool that projects statistically grounded price ranges forward on the chart. Using a log-normal volatility model — the same mathematical approach behind option pricing and quantitative risk tools — the indicator calculates where price is statistically likely to travel over a chosen time horizon. Statistical Price Projection Instead of eyeballing support, resistance, or a breakout target, Pr

Footprint Visual Order flow footprint chart, drawn directly in the main window, sharing the real price scale of your candles. Short description (for the Market listing) Footprint Visual draws a real bid/ask footprint — buy and sell volume per price level, POC, Value Area and net delta — for each of the most recent bars, right next to your candles. Built on genuine volume_real tick data (not tick-count approximations), it works on any symbol whose broker feed reports real trade volume, and is tun

カスタム設定したセッションの高値・安値レンジを表示し、内蔵の適応型Supertrendでフィルタリングされたヒゲブレイクアウトの買い/売りシグナルを発生させます。上位足バイアスの確認とADXフィルターはオプションで、TP/SLガイドラインも自動描画します。 主な機能 セッションレンジボックス — 任意のカスタムセッション(ご自身のSAST取引時間、アジアセッション、ロンドンオープンなど)の高値・安値を自動で追跡・描画し、リアルタイムで更新、セッション終了時に確定します。 内蔵Supertrendトレンドフィルター — 独立したSupertrendエンジンで以下を搭載: ルックバック期間内のATRのパーセンタイル順位に応じて乗数を調整する適応係数オプション。ボラティリティに応じて拡大縮小します。 上位足(HTF)バイアス確認オプション — 上位足のSupertrendが作業足の方向と一致する場合のみシグナルとしてカウントされます。 トレンドの弱いレンジ相場でのシグナルを避けるためのADXフィルター(オプション)。 ブレイクアウトシグナル — セッション/日ごとに買い矢印1本、売り矢印1本

Stop Watching Key Price Levels. Get Alerted. Horizontal Line Alert automatically monitors a price level and alerts you when price closes above, closes below, or touches the line . Go beyond a basic horizontal-line alert with candle confirmation, candle-size filtering, and price-action conditions . KEY FEATURES Close Above
Detect qualifying bullish candles closing above your horizontal level. Close Below
Detect qualifying bearish candles closing below your level. Close Above / Bel

How it works The indicator calculates VWAP (Volume Weighted Average Price) — the average price weighted by traded volume, widely used by institutional traders as the intraday "fair price" benchmark. Unlike a regular moving average, VWAP gives more weight to periods with higher volume, showing where most of the money was actually traded. The product combines three ways of calculating this average in a single indicator, so there is no need to install separate tools: Daily: the sum resets every da

Stop guessing where a pullback ends. Most traders can spot a trend. The hard part is the entry — buying too early into a falling knife, or chasing after the move has already gone. Fibonacci Trend Compass solves exactly that one problem, and it does it on autopilot. Three steps, fully automatic: It reads the trend. An adaptive ATR trend engine paints the chart green or red and tells you which side of the market you are allowed to trade. It maps the impulse leg. Confirmed swing highs and lows

Kiwi Smart Trend System MT5 is a multi-feature trend and signal indicator for MetaTrader 5. The indicator combines trend direction, momentum, volatility, volume and multi-timeframe analysis in one clear chart system. It is designed to help traders identify market direction, evaluate signal conditions and plan potential entries with configurable risk-to-reward zones. Kiwi Smart Trend System is an analytical indicator. It does not open, modify or close trades. MAIN FEATURES Bullish and bearish tre

Iron Entry — Real-Time Signal Engine with Trend Filter & Momentum Candles Why You Should Choose This Indicator
Most signal tools redraw their arrows after the fact, by the time you notice a "signal," it's already changed or vanished. Iron Entry doesn't do that.
This indicator locks in its pivots and signals the moment they close, and once printed, they never move, disappear, or repaint. What you see live is exactly what stays on your chart tomorrow, next week, and next year. That means you c

# Candle Body Anatomy - Candle proportions in numbers
*Category: Pattern Recognition | Difficulty: beginner | Window: separate window below the chart | Markets: Universal (Forex, indices, commodities, crypto, stocks) | Suggested timeframes: M15, M30, H1, H4, D1*
## Short description
> Splits every candle into body and wicks as a percentage of the range and classifies it on explicit numeric thresholds instead of qualitative judgement.
## Full description
### Overview
Traditional candle nam

# Engulfing Quality Score - Not all engulfings are equal
*Category: Pattern Recognition | Difficulty: intermediate | Window: chart window (overlaid on price) | Markets: Universal (Forex, indices, commodities, crypto, stocks) | Suggested timeframes: M15, M30, H1, H4, D1*
## Short description
> Checks the engulfing pattern and scores it on four additional criteria, flagging only those exceeding the quality threshold.
## Full description
### Overview
The engulfing pattern is among the best k

# Inside Bar Breakout Map - Compression with ready levels
*Category: Pattern Recognition | Difficulty: beginner | Window: chart window (overlaid on price) | Markets: Universal (Forex, indices, commodities, crypto, stocks) | Suggested timeframes: M15, M30, H1, H4, D1*
## Short description
> Counts consecutive inside bars and draws the two breakout levels of the mother bar, holding them fixed while the pattern is active.
## Full description
### Overview
An inside bar, entirely contained wit

# Pin Bar Rejection Scanner - Rejection where it matters
*Category: Pattern Recognition | Difficulty: intermediate | Window: chart window (overlaid on price) | Markets: Universal (Forex, indices, commodities, crypto, stocks) | Suggested timeframes: M15, M30, H1, H4, D1*
## Short description
> Recognises bars with a dominant wick but flags them only when they are significant in absolute terms and occur at a recent extreme.
## Full description
### Overview
A bar with a very long wick tells

# Three Bar Structure Map - Geometry without thresholds
*Category: Pattern Recognition | Difficulty: beginner | Window: separate window below the chart | Markets: Universal (Forex, indices, commodities, crypto, stocks) | Suggested timeframes: M15, M30, H1, H4, D1*
## Short description
> Classifies every three bar group into four geometric configurations, using no arbitrary threshold: two bars either exceed each other or they do not.
## Full description
### Overview
Every group of three co
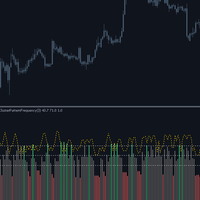
# Cluster Pattern Frequency - Eight sequences and their statistics
*Category: Pattern Recognition | Difficulty: advanced | Window: separate window below the chart | Markets: Universal (Forex, indices, commodities, crypto, stocks) | Suggested timeframes: M30, H1, H4, D1*
## Short description
> Encodes every three bar sequence into one of eight possible configurations and measures the historical frequency of it being followed by an upward move.
## Full description
### Overview
Every three b

Level Reaction は、上位のタイムフレームからサポートとレジスタンスのレベルを描画し、ブレイクアウトの継続とレベルでの反発という2種類の価格反応をマークします。ターミナルで利用可能なすべてのシンボルとタイムフレームで機能します。 レベルの構築方法 各上位タイムフレームのバーの開始時に、インジケーターは前のバーの高値、安値、終値を取得し、その終値の周囲に5つのレジスタンスと5つのサポートレベルを導き出します。レベル間の間隔は、前のバーの範囲の広さに適応します。上位タイムフレームは、チャートの期間から自動的に選択されます。線は、それらが属する期間に対してのみ描画されます。 2種類のシグナル トレンドフィルター(EMA)の方向へ価格がレベルを抜けて確定した時に、ブレイクアウトシグナルが点灯します。シグナルは交差したバーでのみ生成され、保ち合い中のチャートへの重複表示を防ぎます。 価格がレベルに触れ、加重ストキャスティクスが極端な数値(レジスタンスで買われすぎ、サポートで売られすぎ)を示した時に反発シグナルが点灯します。各レベルは、上位タイムフレームの期間ごとに1つの反発シグナルの

# Momentum Thrust Pattern - Thrust, pause, resumption
*Category: Pattern Recognition | Difficulty: intermediate | Window: chart window (overlaid on price) | Markets: Universal (Forex, indices, commodities, crypto, stocks) | Suggested timeframes: M15, M30, H1, H4, D1*
## Short description
> Recognises the thrust, contained pause and resumption beyond the extreme sequence, signalling only once all three phases have completed.
## Full description
### Overview
Directional moves almost always

# Higher Timeframe Bias - The higher timeframe without deception
*Category: Multi Timeframe Hybrids | Difficulty: intermediate | Window: separate window below the chart | Markets: Universal (Forex, indices, commodities, crypto, stocks) | Suggested timeframes: M5, M15, M30, H1, H4*
## Short description
> Brings a higher timeframe direction onto the current chart using only already closed bars, avoiding the most insidious form of repaint.
## Full description
### Overview
Multi timeframe ind

This draws fewer zones than the free order block indicators do. That's the whole point, and it's worth saying before you look at a screenshot and decide something is broken. On the gold chart I grabbed while writing this, the engine found 54 points of interest and marked 2 as tradeable. The other 52 sit on the chart only if you ask for them, greyed out and labelled what the material calls them: traps. Why it draws less than everything else Every order block tool I've used marks every block. Scro

An indicator that marks support and resistance areas by counting how many separate times price has returned to them. Every counted return is marked on the chart, so the count can be checked against the chart history.
What it draws Elektra Look Left draws two zones. One below price, for buys. One above price, for sells. Nothing else is added to the chart. Each zone is drawn as a rectangle rather than a single line. The height of the rectangle is the measured spread of the swings that formed

Introducing my indicator in Meta Trader 5. Trading212 export analysis and charting and exporting to csv. This indicator is an independent development and has no official connection with Trading212 (Trading 212 Markets Ltd.). https://www.youtube.com/watch?v=_hzdqUJgwo4
Hungary: Meta Trader 5 ben indikátorom bemutatása. Trading212 export elemzése és chartra kiíratása és csv.-be exportálása. Ez az indikátor egy független fejlesztés, és semmilyen hivatalos kapcsolatban nem áll a Trading212 vállalat

Trendline MachineGun MT5 Trendline MachineGunは、MetaTrader 5用のサポートおよびレジスタンス・トレンドライン自動検出インジケーターです。 多数のトレンドラインを手動で描画して比較する手間を減らし、価格構造を整理された状態で分析したいトレーダー向けに設計されています。 本インジケーターは、確定したスイング高値とスイング安値を検出し、複数のトレンドライン候補を作成します。その後、各ラインの強度を評価し、位置や傾きが非常に似ているラインを除外して、より重要な構造をチャート上に残します。 初期設定では、最大8本のランク付けされたトレンドラインと、3つの主要ラベルのみを表示します。必要な情報を維持しながら、チャートの過度な混雑を防ぎます。 トレンドラインの自動検出 Trendline MachineGunは、確定したスイングポイントを使用して過去の価格構造を分析します。 インジケーターは以下を自動的に描画します。 スイング安値に基づくサポート・トレンドライン スイング高値に基づくレジスタンス・トレンドライン Main SupportとMai
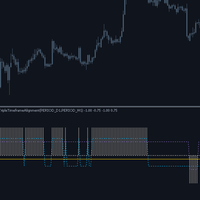
# Triple Timeframe Alignment - Three horizons, one score
*Category: Multi Timeframe Hybrids | Difficulty: intermediate | Window: separate window below the chart | Markets: Universal (Forex, indices, commodities, crypto, stocks) | Suggested timeframes: M5, M15, M30, H1, H4*
## Short description
> Checks whether current, middle and higher timeframes point the same way, showing both the overall score and each horizon direction.
## Full description
### Overview
Full alignment of the three tim

# HTF Level Projector - The levels everyone watches
*Category: Multi Timeframe Hybrids | Difficulty: beginner | Window: chart window (overlaid on price) | Markets: Universal (Forex, indices, commodities, crypto, stocks) | Suggested timeframes: M5, M15, M30, H1, H4*
## Short description
> Projects onto the current chart the high, low and close of the last complete higher period, updating only on period close.
## Full description
### Overview
Yesterday high and low are shared references, no

# Timeframe Divergence Monitor - When horizons disagree
*Category: Multi Timeframe Hybrids | Difficulty: intermediate | Window: separate window below the chart | Markets: Universal (Forex, indices, commodities, crypto, stocks) | Suggested timeframes: M5, M15, M30, H1, H4*
## Short description
> Measures the momentum disagreement between current and higher timeframes, highlighting phases where the two horizons move in opposite directions.
## Full description
### Overview
When the current t

# Volume Support Resistance Map - Supports and resistances drawn by volume
*Category: Experimental | Difficulty: intermediate | Window: chart window (overlaid on price) | Markets: Universal (Forex, indices, commodities, crypto, stocks) | Suggested timeframes: M15, M30, H1, H4, D1*
## Short description
> Horizontal bars drawn on the chart, long in proportion to the volume traded at each level: above price the selling volume marking resistances, below it the buying volume marking supports.
##

Here is the description translated and optimized for the MQL5 Market : Candle Timer Jason – Candle Countdown Indicator (MT5) Candle Timer Jason is a lightweight, high-performance utility developed for MetaTrader 5. It is designed for Forex, Stock, and Crypto traders who need to monitor the exact remaining time before the current candle closes. Knowing precisely how many minutes and seconds are left in a bar is essential for execution timing, helping you avoid premature entries or getting caught

️ Candle Timer Advanced Suite Glass 3D effect for MetaTrader 5
Gain the ultimate edge in precision timing with the Candle Timer Advanced Suite. This is not just a simple countdown; it is a professional-grade analytical tool designed to keep you perfectly synchronized with the market, ensuring you never miss a critical entry or exit due to server lag or misinterpretation. Built specifically for MetaTrader 5, this suite offers unparalleled flexibility, allowing you to visualize time exactly how

Cross Over Trend – EMA/SMA クロスオーバー・インジケーター Cross Over Trend は、MetaTrader 5向けのシンプルかつ効果的なテクニカル指標で、 指数移動平均線(EMA) と 単純移動平均線(SMA) の関係を視覚的に表示します。 このインジケーターは、EMAとSMAの位置関係に基づいて市場の状態を自動的に 上昇トレンド(UpTrend) と 下降トレンド(DownTrend) に分類し、現在のトレンド方向を簡単に把握できるようにします。 動作原理 インジケーターはEMAとSMAの現在値を比較します。 EMA > SMA → UpTrend EMA ≤ SMA → DownTrend EMAがSMAより上にある場合、該当する領域は UpTrend として表示されます。 EMAがSMAを下回ると、表示は DownTrend に切り替わります。 これにより、EMAとSMAを手動で比較することなく、現在の市場方向を素早く明確に確認できます。 主な機能 EMA/SMAクロスオーバーの検出 UpTrend と DownTrend の個別表示 EMA
VWAP偏差インジケーター(VWAP Deviation Indicator) VWAP偏差インジケーター は、出来高を加味した価格分析ツールで、現在の価格と動的に計算されるVWAP基準値、およびその偏差レベルとの関係を分析するために設計されています。 単純移動平均とは異なり、このインジケーターは ティックボリュームによる加重 を使用します。これにより、取引活動が活発な価格帯がVWAPの計算においてより大きな影響を持つようになります。 インジケーターには中央の VWAP Basis と、 2倍および3倍の偏差バンド が表示されます。これにより、現在の価格位置、価格の過度な乖離、平均回帰が発生する可能性のある領域を動的に分析できます。 主な機能 出来高加重VWAP 選択した計算期間のティックボリュームを使用して、カスタムVWAPを計算します。 動的偏差バンド VWAPを中心として、以下の4つの偏差レベルを表示します。 Upper Dev 2 — VWAP + 2×偏差 Upper Dev 3 — VWAP + 3×偏差 Lower Dev 2 — VWAP − 2×偏差 Lower De

VWAP Analytics Advanced Suite for MetaTrader 5
Gain institutional-grade market insight with the VWAP Analytics Advanced Suite , a professional Volume Weighted Average Price indicator built exclusively for MetaTrader 5. This tool goes beyond a simple VWAP line; it is a complete analytical ecosystem designed to identify trend bias, measure market deviation, and provide high-probability entry and exit signals with precision timing. Whether you are a day trader, scalper, or swing trader, this su

Spread & Broker Server Analytics Advanced Suite Glass 3D effect for MetaTrader 5 ( Dashboard & compact dashboard)
Master the fundamental mechanism of market liquidity with the Spread Analytics Advanced Suite, a professional-grade monitoring and alert tool built exclusively for MetaTrader 5. In modern trading, the Bid-Ask spread is your primary transaction cost. This suite provides the transparency and precision required to manage these costs effectively, ensuring you trade only when conditio

Moment Analytics: Confluence Dashboard Advanced Suite for MetaTrader 5
Gain an unparalleled edge in market timing and trend confirmation with the Moment Analytics Confluence Dashboard , a professional-grade analytical suite built exclusively for MetaTrader 5. This tool consolidates nine of the most powerful momentum and volatility indicators into a single, cohesive on-chart HUD (Heads-Up Display), eliminating chart clutter and providing instant, at-a-glance confluence signals. Whether you ar

Price Alerts Advanced Suite for MetaTrader 5
Take control of your trading execution with the Price Alerts Advanced Suite , a professional-grade technical analysis tool built exclusively for MetaTrader 5. This suite goes far beyond simple horizontal lines; it is a complete analytical ecosystem designed to identify key market levels, monitor price action in real-time, and deliver instant notifications across multiple channels. Whether you are a day trader, swing trader, or algorithmic develope

Bollinger Trend Signals MT5 - ボリンジャーバンドに基づいたトレンドインジケーターです。すべてのシグナルは再描画や遅延なしで生成されます。方向性のあるトレンドチャネルを特定し、潜在的なエントリーポイントとエグジットポイントを示します。
インジケーターの仕組み
このインジケーターの機能は、トレンドチャネルと高値・安値を決定するシステムの組み合わせに基づいています。
青い線は、平滑化されたメイントレンドラインです。この線が価格より上にある場合、トレンドチャネルは弱気です。価格より下にある場合、トレンドチャネルは強気です。
オレンジ色の矢印は下降トレンドシグナルを、水色の矢印は上昇トレンドシグナルを示します。
強気トレンドにおいては、オレンジ色の点はエグジットオプションであり、ピークでの価格ストップを定義します。水色の点は上昇の再開を示し、再エントリーまたはポジションの追加に使用されます。
弱気トレンドにおいては、水色の点はエグジットオプションであり、底での価格ストップを定義します。オレンジ色の点は再エントリーまたはポジションの追加に使用されます。

標準的なインジケーターから複雑なシステムを構築し、チャートの履歴データに基づいて即座にバックテストを実行するインジケーターです。9つの時間枠にわたる16個のインジケーターのマトリックスで構成され、セルをクリックすると、指定した期間のインジケーターが組み合わせに追加されます。組み合わせは投票を行い、投票閾値に基づいてシグナルが生成されます。構成が変更されるたびに、結果、取引回数、利益率、利益率、期待値、ドローダウンなどの統計情報が再計算されます。遺伝的オプティマイザーが構成を自動的に選択し、完成したシステムはキーとして保存され、任意のチャートに転送できます。
( ユーザーマニュアル )
インジケーターの選択、投票閾値、および決済ルールはトレーダーが行いますが、インジケーターはセルの計算、バックテスト、および構成の探索を処理します。
機能
このインジケーターは3つのモードで動作します。マトリックスラボは、マトリックス、統計、オプティマイザーを備えた完全なラボです。ストラテジーモジュールは、コンセンサス、エントリープラン、または現在のポジションと6桁の履歴データを表示する、単一の既

MTF LRMA Plus: Multi-Timeframe Trading Decision System Linear Regression Moving Average with ADX Trend Strength Analysis Across 6 Timeframes Product Overview MTF LRMA Plus is a professional-grade trading indicator that combines Linear Regression Moving Average (LRMA) trend analysis with ADX (Average Directional Index) trend strength measurement across 6 key timeframes (D1, H4, H1, M30, M15, M5). It delivers actionable insights through an intuitive visual dashboard, helping traders identify h

GOLDEN CROSS V1.0 - Moving Average Crossover Indicator with Quality Score General Description The GOLDEN CROSS is an advanced technical indicator developed for MetaTrader 5 that combines moving average crossovers with a quality scoring system based on multiple technical filters. It is designed to identify high-probability entry points, offering traders interactive visual tools and comprehensive risk management features. Indicator Structure and Logic 1. Crossover System Fas

KITO Opportunity ATLAS
MARKET OPPORTUNITY INTELLIGENCE FOR MT5 The market rarely suffers from a shortage of signals. The real challenge is knowing which opportunities deserve your attention—and which ones deserve to be ignored. Kito Atlas transforms your MetaTrader 5 terminal into a multi-market opportunity command centre. From one compact dashboard, it scans multiple symbols and timeframes, compares several forms of market evidence, ranks the strongest opportunities and opens a structured price

This custom algorithmic indicator is a zero-lag, non-repainting trading tool engineered for precision entries. By fusing a proprietary combination of momentum and structural metrics behind the scenes, it identifies immediate market exhaustion points without relying on delayed data. Because it calculates and locks its logic the exact millisecond a bar closes, signals will never shift, lag, or repaint after the fact.
Execution & Trade Management:
The One-Candle Rule: The primary execution strate

QQE Signal – 定性・定量推定(QQE)インジケーター
QQE Signal は、MetaTrader 5向けのオシレーター型テクニカルインジケーターです。平滑化されたRSIと動的に計算されるQQEラインを使用し、トレンドの変化や市場モメンタムの変化を分析するために設計されています。 青色のRSIベースのシグナルライン と 黒色の点線QQEライン の関係を明確に表示し、重要な 50レベル を中心的な基準として使用します。 主な特徴 QQEシグナルライン 青色のラインは、平滑化されたRSI値を表します。 ラインの動きを確認することで、市場モメンタムの変化や価格方向の転換の可能性を分析できます。 平滑化QQEライン 黒色の点線は、青色のラインに対する動的な基準ラインとして機能します。 2本のラインのクロスは、市場モメンタムの変化を分析するために利用できます。 〰️ 50レベル 50レベルはオシレーターの中心的な基準です。 50以上 → 強気モメンタム 50以下 → 弱気モメンタム 買いシグナル 潜在的な BUY(買い)シグナル は、以下の条件で発生します。 青色

MA Flow No.2 See the Flow of Bulls & Bears at a Glance, and Keep the Rhythm of the Market in Your Hands
Tired of staring at dozens of moving averages until your eyes blur? Unsure when to enter, or where to place your stop? MA Flow No.2 upgrades the humble moving average into a complete trend-trading system. No more scattered lines on your chart — instead, a living "river of bulls and bears". Up to 100 moving averages roll together in real time. On every single bar, you can see at a glance w

Volume Footprintは、MetaTrader 5向けの価格帯別オーダーフロー・インジケーターです。1本のローソク足だけを表示するのではなく、各バーを個々の価格行に分解し、その価格帯で約定したbid・ask出来高を表示します。つまり、価格がどこで引けたかだけでなく、バーの内部で買い手と売り手がどこで取引したかが正確に分かります。 本インジケーターは、チャートのティックフィードをより小さい時間足(チャート期間に応じて自動選択、または手動固定)で集計し、MetaTrader自体の価格・出来高データを用いて各ティックをbid側・ask側に分類します。 オーダーフロー・ツールキット Point of Control (POC) — バー内で最大出来高となった価格。専用の行で表示されます。 Value Area — バーの合計出来高の一定割合を含む価格帯(初期設定70%)。設定変更可能です。 Stacked Imbalance — 一方が一定比率で連続して優勢となる価格行を検出します。 Absorption — バーの高値・安値端で、価格が追随しないまま大きな逆方向出来高が吸収されたこ

Sultan of Swing Sultan of Swing is a clean and reliable swing-based signal indicator designed for traders who want clear entries without confusion or lag. The indicator detects price swings and delivers signals only at the open of a new bar. sometimes mid-bar signals but no repainting, and no unnecessary noise. Key Features Non-repainting – Signals stay fixed always. New bar signals only – Alerts appear at the start of the candle, sometimes in the Middle. Price swing logic – Built purely on mar

DaySwingPro Institutional — Multi-Factor Day & Swing Trading Engine Confluence-based BUY/SELL signals with institutional risk management, Smart Money Concepts and a live HUD — engineered with a strict zero-repaint architecture. What is it for? DaySwingPro Institutional is built for day and swing traders who hold positions from one day to several weeks (recommended timeframes: H1, H4, D1 ). Instead of firing arrows on every minor fluctuation, it waits for the trend, momentum and mark

矢印は買えと言うだけです。Obsidian Scalper Pro は、どこで買うのか、ストップをどこに置くのか、三つの目標がどこにあるのか、あなたのリスクに対して建玉をどれだけの大きさにすべきか、そしてそのセットアップが100点満点で何点なのかまで伝えます。すべてのシグナルは、チャート上に描かれた完成した売買プランとして届き、内蔵の統計ウィンドウが直近百件の正直な結果を、信頼区間付きの勝率まで含めて示します。すべての判断は確定足で下されるので、あなたが見ている履歴は、あなたが実際に取れたはずの履歴そのものです。 本インジケーターはゴールド(XAUUSD)のM30で最も力を発揮しますが、他のどの銘柄と時間足でもご利用いただけます。 このインジケーターに合わせた戦略をご希望ですか? ご購入後にMQL5でメッセージをお送りください。こちらからお送りします。 できること Obsidian Scalper Pro は確立したトレンドの中のプルバックエントリーを見つけ、その一つ一つに完成したプランを渡します。Entry、SL、TP1、TP2、そして任意の TP3 が、価格ラベルと R:R 比を伴

流動性プールとは、まだ取られていない確定済みのスイングハイまたはスイングローのことです。流動性スイープとは、価格がその水準を超えて取引され、その後レンジ内に戻って終値をつけるバーのことで、同じ出来事はストップハント、ストップラン、流動性グラブ、または偽のブレイクアウトとも呼ばれます。 Liquidity Sweep Pools MTF は、プールとそこで行われた流動性スイープの両方を、現在のチャートと選択した上位時間足でマークし、アクティブなプールのライブパネル、プール形成時の出来高フィルター、検出されたスイープの CSV エクスポートを追加します。 ここでのマルチタイムフレーム確認とは、各流動性スイープを、目の前のチャートを離れることなく上位時間足のプールと照らし合わせて読むことができ、両方の水準セットがそれぞれの色で並べて描画されることを意味します。 何をマークするか 正確に一つのこと、プールの形状です。描画されるすべてのプールは、価格水準、方向、距離、経過時間を持ち、同じ4つの値がパネルと CSV ファイルに入ります。それが語彙のすべてであり、だからこそ出力はバーごとに検証しやす

Supply and Demand + Market Structure Smart Money order block detection, volume-weighted confirmation, and full BOS/CHoCH market structure Check out Rudy Bank for more features: https: // www.mql5.com/en/market/product/193059 Check out Iron Entry for zone entry confirmations: https: // www.mql5.com/en/market/product/193937
Overview
SupplyDemand Edge finds and draws institutional supply and demand order blocks directly on your chart, then backs every one of them up with real market data — volume

See the Market From the Higher-Timeframe Perspective. Ashinton MTF-Trend Pro is a professional multi-timeframe trend analysis indicator for MetaTrader 5, designed to help traders quickly identify directional alignment across Monthly (MN1), Weekly (W1), Daily (D1), and H4 timeframes.
Instead of analyzing each timeframe manually, MTF-Trend Pro brings the bigger market picture into one clean, intuitive dashboard, helping you determine whether the higher timeframes are aligned, conflicted, or deve

ElliottWave Pro — Automatic Wave 2 Detection and Wave 3 Targets An indicator for MetaTrader 5 that automates Elliott Wave and Fibonacci analysis. ElliottWave Pro detects the end of the first impulse (Wave 1), calculates the corrective zone (Wave 2) and draws a ready-to-use trading setup with Stop Loss and Take Profit levels. Key Features Automatic Wave 1 detection: connects points P0 and P1 to show the trend structure. Wave 2 entry zone: a rectangular retracement zone with Fibonacci levels 38.2%

SMC Sentinel — Smart Money Concepts インジケーター 相場構造とともにトレードし、市場を違った視点から見よう。 SMC Sentinel は、MetaTrader 5 向けに開発された高度な Smart Money Concepts(SMC)分析インジケーター です。複数のプライスアクション概念を、シンプルでカスタマイズ可能な1つのチャート分析システムに統合します。 単一のシグナルだけに依存するのではなく、SMC Sentinel は市場構造、流動性、価格の不均衡、機関投資家ゾーン、リトレースメント領域、トレンドコンテキストを分析し、 価格がどこから来たのか、何に反応しているのか、そしてどこで潜在的なセットアップが形成されているのか を理解するのに役立ちます。 主な機能 マーケットストラクチャー MT5 チャート上で重要な構造変化を直接確認できます。 Swing Highs & Swing Lows BOS — Break of Structure CHoCH — Change of Character メジャーストラクチャーのフィルタリン

Trend Market — Smart Money Concepts (SMC) Indicator with Order Blocks, FVG & Auto TP System Trend Market is a complete Smart Money Concepts toolkit built to help you read institutional price behavior with clarity — market structure, liquidity zones, and precise risk-based profit targets, all in one indicator. The Strategy This indicator is built around real Smart Money Concepts (SMC) trading logic: Market Structure Detection (BOS / CHoCH) — Using fractal-based swing analysis, the indicator auto
MetaTraderマーケットは、履歴データを使ったテストと最適化のための無料のデモ自動売買ロボットをダウンロードできる唯一のストアです。
アプリ概要と他のカスタマーからのレビューをご覧になり、ターミナルにダウンロードし、購入する前に自動売買ロボットをテストしてください。完全に無料でアプリをテストできるのはMetaTraderマーケットだけです。

取引の機会を逃しています。
- 無料取引アプリ
- 8千を超えるシグナルをコピー
- 金融ニュースで金融マーケットを探索