 MetaTrader 5
 专家
 指标
 程序库
 实用工具
 窗口小部件
 规则
适用于MetaTrader 5的技术指标 - 214
 技术指标的信号外汇和股票市场的开仓交易和平仓交易起着至关重要的作用。指标的本质就是一种交易品种的数学转换,旨在预测未来的价格变化。
测试技术指标可以更有利于预测市场行为并从中获利。

is a versatile analytical tool designed for both advanced traders and beginners. It combines classic trend line analysis with automatic Fibonacci level plotting to deliver precise market entries and structural clarity. Built as an intuitive and clean on-screen dashboard, this indicator simplifies multi-timeframe analysis without cluttering your main workspace. Technical Analysis and Entry Points The indicator automates the most critical aspects of price action and structural trading: Trend L
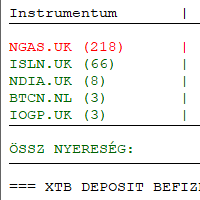
Introducing my indicator in Meta Trader 5. XTB export analysis and charting and export of currency conversion to csv for tax return. This indicator is an independent development and has no official connection with XTB S.A. https://youtu.be/z9JVhqKdKns
Hungary: Meta Trader 5 ben indikátorom bemutatása. XTB export elemzése és chartra kiíratása és adóbevalláshoz deviza konverzió csv.-be exportálása. Ez az indikátor egy független fejlesztés, és semmilyen hivatalos kapcsolatban nem áll az XTB S.A. v

QUANTUM OCEAN SIGNALS MT5
Quantum Ocean Signals MT5 is a multi-filter decision-support indicator for MetaTrader 5. It evaluates trend direction, momentum, directional strength, volatility and candle confirmation to display structured BUY and SELL setups after a candle has closed.
The indicator does not open or manage trades. It gives manual traders a clear trade plan consisting of a signal, an adaptive Stop Loss and three optional Take Profit reference levels.
MAIN FEATURES
• Closed-candle

Level Alert Utility is an essential workflow tool for MetaTrader 5 designed to eliminate constant screen fatigue. Effortlessly drag the interactive level line directly on your chart—the indicator instantly configures trigger rules and delivers real-time notifications via customizable sound repeats, popup alerts, mobile Push notifications, and email. Equipped with high-speed millisecond monitoring, gap and impulse protection, quick-action chart buttons, hotkey support, and state persistence acros

SMC SYNTHRIDERS — Smart Money, Liquidity and Market Phase Trading Indicator SMC SYNTHRIDERS is a MetaTrader 5 market-analysis and signal indicator developed by MohSOLUTIONS . It is designed for traders who analyse price through market structure, liquidity behaviour, Smart Money Concepts, multi-timeframe context and market phases . Rather than generating signals from a single condition, SMC SYNTHRIDERS combines multiple layers of market information to identify conditions where a structured tradin

MACandleApproxPro — 高阶均线蜡烛重构与多维度市场结构指标 产品概述 MACandleApproxPro 是一款专为专业交易者设计的综合性技术分析工具。它突破了传统均线的局限,通过复杂的算法将移动平均线重构为 “MA 蜡烛”形态 。这种独特的可视化方式,让您能够过滤市场噪音,以更直观的视角审视价格趋势、动量变化以及关键的市场结构。 本指标集成了多时间框架(MTF)分析、ADX 趋势强度过滤、流动性扫荡(Liquidity Sweep)检测以及多品种扫描器,为您提供一站式的价格行为分析解决方案。 核心功能亮点 1. 三组独立的 MA 蜡烛系统 指标支持同时运行 3 组独立的均线蜡烛(Candle 1, 2, 3)。 每组均可独立配置周期、均线类型及涨跌颜色。 Candle 1 默认作为基础层,支持多时间框架(MTF)叠加,帮助您在主图表上直接观察更高周期的趋势结构。 2. 六种高级均线算法 支持 SMA, EMA, WMA, VWMA, HMA, RMA 六种算法。 独特的递归计算逻辑(Recursive Calculation)确保了 EMA

# Level Strength Ranker - Only the two levels that matter
*Category: Support and Resistance | Difficulty: intermediate | Window: chart window (overlaid on price) | Markets: Universal (Forex, indices, commodities, crypto, stocks) | Suggested timeframes: M30, H1, H4, D1*
## Short description
> Scores every level by number of touches, size of reactions and recency, drawing only the strongest one above and below price.
## Full description
### Overview
Not all levels are equal. A level touched

# Round Number Magnet - Do round numbers really matter?
*Category: Support and Resistance | Difficulty: beginner | Window: chart window (overlaid on price) | Markets: Universal (Forex, indices, commodities, crypto, stocks) | Suggested timeframes: M15, M30, H1, H4, D1*
## Short description
> Draws round levels with an automatically computed step and measures how much price actually reacts to them on this specific instrument.
## Full description
### Overview
Round numbers attract orders: st

# Break Retest Detector - The full sequence, not just the break
*Category: Support and Resistance | Difficulty: intermediate | Window: chart window (overlaid on price) | Markets: Universal (Forex, indices, commodities, crypto, stocks) | Suggested timeframes: M15, M30, H1, H4, D1*
## Short description
> Recognises the full sequence of break, return to the level and reaction. It signals only when all three conditions occur in the correct order.
## Full description
### Overview
Breaking a le

Multi-Symbol MTF Scanner
形态完成的瞬间,即刻捕捉入场机会 Multi-Symbol MTF Scanner 可在多个时间周期上同时监控您的整个自选品种列表,并在某个市场完成多阶段波段形态的确切时刻向您发出提示。它专为遵循多周期、多品种交易流程的交易者打造,让您无需逐一点开数十张图表,去寻找那唯一一个已经就绪的入场机会。 整个形态均由工具内部原生逐阶段计算,因此无需额外安装任何组件。每一个单元格都会以「X / Y 阶段」的形式显示形态已形成到何种程度,并在最后一个阶段触发的瞬间变为绿色 BUY 或红色 SELL,同时弹出提示、播放声音,并向您的手机推送通知。它仅标示入场点;离场则始终完全由您自己掌控。
兼容 MetaTrader 4 与 MetaTrader 5,在 Market 上作为两个独立产品分别销售。 扫描器将原始价格解析为从快到慢的四个波段深度,然后检验一个完整的形态:波段结构是否对齐、波段数量是否正确、动能的最后一次推进,以及作为触发条件的快速与慢速 EMA 交叉,同时要求价格位于当日开盘价的正确一侧。它原生复现了广为人知的 Xard 波段圆点法(

# Dynamic Pivot Zones - Pivots as zones, not lines
*Category: Support and Resistance | Difficulty: beginner | Window: chart window (overlaid on price) | Markets: Universal (Forex, indices, commodities, crypto, stocks) | Suggested timeframes: M5, M15, M30, H1*
## Short description
> Turns pivots into zones whose width depends on the previous period volatility. The levels stay fixed for the whole session, with no recalculation.
## Full description
### Overview
Classic pivots are infinitely

# Supply Demand Zone Mapper - Compressed base and decisive departure
*Category: Support and Resistance | Difficulty: intermediate | Window: chart window (overlaid on price) | Markets: Universal (Forex, indices, commodities, crypto, stocks) | Suggested timeframes: M15, M30, H1, H4, D1*
## Short description
> Recognises consolidation bases followed by a decisive move and draws them as zones, which remain until price crosses them fully.
## Full description
### Overview
A demand zone forms wh

# Untested Level Finder - The levels still intact
*Category: Support and Resistance | Difficulty: beginner | Window: chart window (overlaid on price) | Markets: Universal (Forex, indices, commodities, crypto, stocks) | Suggested timeframes: M15, M30, H1, H4, D1*
## Short description
> Draws only the swing levels price has never retested since they formed. A level stops being drawn the moment it is tested.
## Full description
### Overview
A level that has already rejected price three times

# Confluence Score Map - Where several references converge
*Category: Support and Resistance | Difficulty: advanced | Window: chart window (overlaid on price) | Markets: Universal (Forex, indices, commodities, crypto, stocks) | Suggested timeframes: M30, H1, H4, D1*
## Short description
> Computes four independent families of levels and draws only the price bands where at least the required minimum number of references converges.
## Full description
### Overview
A level where several inde

# False Breakout Filter - The failed break as a signal
*Category: Support and Resistance | Difficulty: intermediate | Window: chart window (overlaid on price) | Markets: Universal (Forex, indices, commodities, crypto, stocks) | Suggested timeframes: M15, M30, H1, H4, D1*
## Short description
> Watches every break for a fixed number of bars and classifies it only afterwards. A failed break produces an arrow the opposite way, because it is itself a signal.
## Full description
### Overview
E

# Range Boundary Tracker - Edges that do not follow price
*Category: Support and Resistance | Difficulty: intermediate | Window: chart window (overlaid on price) | Markets: Universal (Forex, indices, commodities, crypto, stocks) | Suggested timeframes: M15, M30, H1, H4, D1*
## Short description
> Recognises when the market enters a range, fixes its two extremes and holds them still while the range lasts, as a trader would draw them.
## Full description
### Overview
A channel that follows

# Level Decay Model - A level that wears out
*Category: Support and Resistance | Difficulty: advanced | Window: chart window (overlaid on price) | Markets: Universal (Forex, indices, commodities, crypto, stocks) | Suggested timeframes: M30, H1, H4, D1*
## Short description
> Assigns each level a strength that decays over time and with every test it undergoes. The level is abandoned once residual strength falls below the threshold.
## Full description
### Overview
A level does not have unl

适用于MT5平台的“吊颈线和倒锤线形态”加密货币外汇指标,无重绘,无延迟。 - “吊颈线和倒锤线形态”指标是一款功能强大的价格行为交易指标。 - 该指标可检测图表上的看涨倒锤线形态和看跌吊颈线形态: - 看涨倒锤线形态:图表上显示蓝色箭头信号(见图)。 - 看跌吊颈线形态:图表上显示红色箭头信号(见图)。 - 支持电脑端和移动端通知。 - 提供4种不同的信号箭头样式。 - “吊颈线和倒锤线形态”指标非常适合与支撑/阻力位和挂单结合使用。 点击此处查看更多优质交易机器人和指标! 本产品为原创产品,仅在MQL5网站独家销售。 ......................................................

Makito AD is a volume-based market analysis indicator designed to identify market trends and changes in market direction by analyzing the relationship between price action and volume . The indicator uses a dynamic line that changes color based on the current market condition , making it easier to visually identify whether market pressure is becoming bullish, bearish, or showing potential divergence. Key Features Volume-Based Analysis — Uses volume and price action to assess market direction. Dyn

Probability Cone MT5 — Statistical Price Projection Indicator Probability Cone MT5 is a technical analysis tool that projects statistically grounded price ranges forward on the chart. Using a log-normal volatility model — the same mathematical approach behind option pricing and quantitative risk tools — the indicator calculates where price is statistically likely to travel over a chosen time horizon. Statistical Price Projection Instead of eyeballing support, resistance, or a breakout target, Pr

Footprint Visual Order flow footprint chart, drawn directly in the main window, sharing the real price scale of your candles. Short description (for the Market listing) Footprint Visual draws a real bid/ask footprint — buy and sell volume per price level, POC, Value Area and net delta — for each of the most recent bars, right next to your candles. Built on genuine volume_real tick data (not tick-count approximations), it works on any symbol whose broker feed reports real trade volume, and is tun

标记自定义交易时段的高低点区间,并在插针突破该区间时,通过内置的自适应 Supertrend 过滤后发出买卖信号,可选高周期趋势确认和 ADX 过滤,并自动绘制止盈止损参考线。
主要功能 时段区间框 — 自动跟踪并绘制任意自定义时段(例如您自己的 SAST 交易时段、亚洲时段或伦敦开盘)的高低点,实时更新,时段结束后锁定。 内置 Supertrend 趋势过滤器 — 独立运行的 Supertrend 引擎,具备: 自适应系数选项,根据 ATR 在回看周期内的百分位排名动态调整倍数,随波动率自动收紧或放宽; 可选的高周期(HTF)趋势确认——只有当高周期 Supertrend 方向与当前周期一致时,信号才被计入; 可选的 ADX 过滤器,避免在弱趋势/震荡行情中产生信号。 突破信号 — 每个时段/每天最多一个买入箭头和一个卖出箭头,当K线插针突破区间高点或低点,且 Supertrend 过滤器确认时触发。 止盈/止损参考线 — 信号触发时自动绘制入场、止损、止盈射线,其距离按当日时段区间的百分比计算,并在 SAST 午夜自动截止。 完全可配置 — 时段时间、时区偏移、Supertre

Stop Watching Key Price Levels. Get Alerted. Horizontal Line Alert automatically monitors a price level and alerts you when price closes above, closes below, or touches the line . Go beyond a basic horizontal-line alert with candle confirmation, candle-size filtering, and price-action conditions . KEY FEATURES Close Above
Detect qualifying bullish candles closing above your horizontal level. Close Below
Detect qualifying bearish candles closing below your level. Close Above / Bel

How it works The indicator calculates VWAP (Volume Weighted Average Price) — the average price weighted by traded volume, widely used by institutional traders as the intraday "fair price" benchmark. Unlike a regular moving average, VWAP gives more weight to periods with higher volume, showing where most of the money was actually traded. The product combines three ways of calculating this average in a single indicator, so there is no need to install separate tools: Daily: the sum resets every da

Stop guessing where a pullback ends. Most traders can spot a trend. The hard part is the entry — buying too early into a falling knife, or chasing after the move has already gone. Fibonacci Trend Compass solves exactly that one problem, and it does it on autopilot. Three steps, fully automatic: It reads the trend. An adaptive ATR trend engine paints the chart green or red and tells you which side of the market you are allowed to trade. It maps the impulse leg. Confirmed swing highs and lows

Kiwi Smart Trend System MT5 is a multi-feature trend and signal indicator for MetaTrader 5. The indicator combines trend direction, momentum, volatility, volume and multi-timeframe analysis in one clear chart system. It is designed to help traders identify market direction, evaluate signal conditions and plan potential entries with configurable risk-to-reward zones. Kiwi Smart Trend System is an analytical indicator. It does not open, modify or close trades. MAIN FEATURES Bullish and bearish tre

Iron Entry — Real-Time Signal Engine with Trend Filter & Momentum Candles Why You Should Choose This Indicator
Most signal tools redraw their arrows after the fact, by the time you notice a "signal," it's already changed or vanished. Iron Entry doesn't do that.
This indicator locks in its pivots and signals the moment they close, and once printed, they never move, disappear, or repaint. What you see live is exactly what stays on your chart tomorrow, next week, and next year. That means you c

# Candle Body Anatomy - Candle proportions in numbers
*Category: Pattern Recognition | Difficulty: beginner | Window: separate window below the chart | Markets: Universal (Forex, indices, commodities, crypto, stocks) | Suggested timeframes: M15, M30, H1, H4, D1*
## Short description
> Splits every candle into body and wicks as a percentage of the range and classifies it on explicit numeric thresholds instead of qualitative judgement.
## Full description
### Overview
Traditional candle nam

# Engulfing Quality Score - Not all engulfings are equal
*Category: Pattern Recognition | Difficulty: intermediate | Window: chart window (overlaid on price) | Markets: Universal (Forex, indices, commodities, crypto, stocks) | Suggested timeframes: M15, M30, H1, H4, D1*
## Short description
> Checks the engulfing pattern and scores it on four additional criteria, flagging only those exceeding the quality threshold.
## Full description
### Overview
The engulfing pattern is among the best k

# Inside Bar Breakout Map - Compression with ready levels
*Category: Pattern Recognition | Difficulty: beginner | Window: chart window (overlaid on price) | Markets: Universal (Forex, indices, commodities, crypto, stocks) | Suggested timeframes: M15, M30, H1, H4, D1*
## Short description
> Counts consecutive inside bars and draws the two breakout levels of the mother bar, holding them fixed while the pattern is active.
## Full description
### Overview
An inside bar, entirely contained wit

# Pin Bar Rejection Scanner - Rejection where it matters
*Category: Pattern Recognition | Difficulty: intermediate | Window: chart window (overlaid on price) | Markets: Universal (Forex, indices, commodities, crypto, stocks) | Suggested timeframes: M15, M30, H1, H4, D1*
## Short description
> Recognises bars with a dominant wick but flags them only when they are significant in absolute terms and occur at a recent extreme.
## Full description
### Overview
A bar with a very long wick tells

# Three Bar Structure Map - Geometry without thresholds
*Category: Pattern Recognition | Difficulty: beginner | Window: separate window below the chart | Markets: Universal (Forex, indices, commodities, crypto, stocks) | Suggested timeframes: M15, M30, H1, H4, D1*
## Short description
> Classifies every three bar group into four geometric configurations, using no arbitrary threshold: two bars either exceed each other or they do not.
## Full description
### Overview
Every group of three co
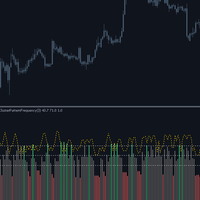
# Cluster Pattern Frequency - Eight sequences and their statistics
*Category: Pattern Recognition | Difficulty: advanced | Window: separate window below the chart | Markets: Universal (Forex, indices, commodities, crypto, stocks) | Suggested timeframes: M30, H1, H4, D1*
## Short description
> Encodes every three bar sequence into one of eight possible configurations and measures the historical frequency of it being followed by an upward move.
## Full description
### Overview
Every three b

Level Reaction 从更高的时间周期绘制支撑和阻力位, 并标记价格对这些级别的两种反应:突破延续和水平反转。 它适用于终端中可用的任何交易品种和任何时间周期。 级别的构建方式 在每个更高时间周期柱形图开始时, 指标会提取前一根柱形图的最高价、 最低价和收盘价, 并围绕该收盘价推导出五个阻力位和五个支撑位。 级别之间的间距会根据前一根柱形图的范围宽度进行自适应调整。 更高的时间周期会根据您的图表周期自动选择。 线条仅绘制在其所属的期间内。 两种信号类型 当价格在趋势过滤器 (EMA) 的方向上收盘穿过一个级别时, 会触发突破信号。 信号仅在交叉的柱形图上生成, 从而避免在盘整期间图表上出现重复的箭头。 当价格触及级别, 且加权随机指标显示极端读数(阻力位超买, 支撑位超卖)时, 会触发反转信号。 在每个更高时间周期内, 每个级别只能触发一次反转信号。 这两种信号类型都可以独立关闭。 冷却时间设置强制规定任意两个信号之间的最小柱数。 可选过滤器 更高时间周期偏差过滤器可以要求每个信号在允许触发之前, 必须与独立的更高时间周期上的趋势保持一致。 会话过滤器将信号限制在服务器时间选定

# Momentum Thrust Pattern - Thrust, pause, resumption
*Category: Pattern Recognition | Difficulty: intermediate | Window: chart window (overlaid on price) | Markets: Universal (Forex, indices, commodities, crypto, stocks) | Suggested timeframes: M15, M30, H1, H4, D1*
## Short description
> Recognises the thrust, contained pause and resumption beyond the extreme sequence, signalling only once all three phases have completed.
## Full description
### Overview
Directional moves almost always

# Higher Timeframe Bias - The higher timeframe without deception
*Category: Multi Timeframe Hybrids | Difficulty: intermediate | Window: separate window below the chart | Markets: Universal (Forex, indices, commodities, crypto, stocks) | Suggested timeframes: M5, M15, M30, H1, H4*
## Short description
> Brings a higher timeframe direction onto the current chart using only already closed bars, avoiding the most insidious form of repaint.
## Full description
### Overview
Multi timeframe ind

This draws fewer zones than the free order block indicators do. That's the whole point, and it's worth saying before you look at a screenshot and decide something is broken. On the gold chart I grabbed while writing this, the engine found 54 points of interest and marked 2 as tradeable. The other 52 sit on the chart only if you ask for them, greyed out and labelled what the material calls them: traps. Why it draws less than everything else Every order block tool I've used marks every block. Scro

An indicator that marks support and resistance areas by counting how many separate times price has returned to them. Every counted return is marked on the chart, so the count can be checked against the chart history.
What it draws Elektra Look Left draws two zones. One below price, for buys. One above price, for sells. Nothing else is added to the chart. Each zone is drawn as a rectangle rather than a single line. The height of the rectangle is the measured spread of the swings that formed

Introducing my indicator in Meta Trader 5. Trading212 export analysis and charting and exporting to csv. This indicator is an independent development and has no official connection with Trading212 (Trading 212 Markets Ltd.). https://www.youtube.com/watch?v=_hzdqUJgwo4
Hungary: Meta Trader 5 ben indikátorom bemutatása. Trading212 export elemzése és chartra kiíratása és csv.-be exportálása. Ez az indikátor egy független fejlesztés, és semmilyen hivatalos kapcsolatban nem áll a Trading212 vállalat

Trendline MachineGun MT5 Trendline MachineGun 是一款适用于 MetaTrader 5 的自动支撑与阻力趋势线指标,专为希望减少手动绘制工作并保持图表整洁的交易者设计。 指标通过分析已确认的波段高点和波段低点,自动生成多条趋势线候选,评估每条趋势线的强度,移除位置和斜率过于相似的线,并在图表上保留更具参考价值的市场结构。 默认情况下,图表最多显示八条经过排名的趋势线,同时只显示三个主要文字标签,在提供必要信息的同时避免图表过度拥挤。 自动趋势线检测 Trendline MachineGun 根据已确认的波段点持续分析历史价格结构。 指标可以自动绘制: 基于波段低点的支撑趋势线; 基于波段高点的阻力趋势线; 主要支撑与主要阻力; 多条趋势线形成的 Pressure Zone; 每条有效趋势线的强度评分。 趋势线只会向未来延伸指定数量的K线,不会无限延伸至整个图表。 强度排名 每条有效趋势线都会获得一个从 0 到 100 的强度评分。 评分主要考虑: 价格对趋势线的历史触碰次数; 趋势线锚点的时效性; 新K线形成后趋势线是否仍然具有参考价值。 评
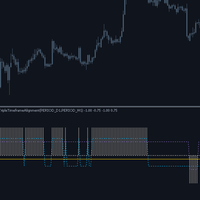
# Triple Timeframe Alignment - Three horizons, one score
*Category: Multi Timeframe Hybrids | Difficulty: intermediate | Window: separate window below the chart | Markets: Universal (Forex, indices, commodities, crypto, stocks) | Suggested timeframes: M5, M15, M30, H1, H4*
## Short description
> Checks whether current, middle and higher timeframes point the same way, showing both the overall score and each horizon direction.
## Full description
### Overview
Full alignment of the three tim

# HTF Level Projector - The levels everyone watches
*Category: Multi Timeframe Hybrids | Difficulty: beginner | Window: chart window (overlaid on price) | Markets: Universal (Forex, indices, commodities, crypto, stocks) | Suggested timeframes: M5, M15, M30, H1, H4*
## Short description
> Projects onto the current chart the high, low and close of the last complete higher period, updating only on period close.
## Full description
### Overview
Yesterday high and low are shared references, no

# Timeframe Divergence Monitor - When horizons disagree
*Category: Multi Timeframe Hybrids | Difficulty: intermediate | Window: separate window below the chart | Markets: Universal (Forex, indices, commodities, crypto, stocks) | Suggested timeframes: M5, M15, M30, H1, H4*
## Short description
> Measures the momentum disagreement between current and higher timeframes, highlighting phases where the two horizons move in opposite directions.
## Full description
### Overview
When the current t

# Volume Support Resistance Map - Supports and resistances drawn by volume
*Category: Experimental | Difficulty: intermediate | Window: chart window (overlaid on price) | Markets: Universal (Forex, indices, commodities, crypto, stocks) | Suggested timeframes: M15, M30, H1, H4, D1*
## Short description
> Horizontal bars drawn on the chart, long in proportion to the volume traded at each level: above price the selling volume marking resistances, below it the buying volume marking supports.
##

Here is the description translated and optimized for the MQL5 Market : Candle Timer Jason – Candle Countdown Indicator (MT5) Candle Timer Jason is a lightweight, high-performance utility developed for MetaTrader 5. It is designed for Forex, Stock, and Crypto traders who need to monitor the exact remaining time before the current candle closes. Knowing precisely how many minutes and seconds are left in a bar is essential for execution timing, helping you avoid premature entries or getting caught

️ Candle Timer Advanced Suite Glass 3D effect for MetaTrader 5
Gain the ultimate edge in precision timing with the Candle Timer Advanced Suite. This is not just a simple countdown; it is a professional-grade analytical tool designed to keep you perfectly synchronized with the market, ensuring you never miss a critical entry or exit due to server lag or misinterpretation. Built specifically for MetaTrader 5, this suite offers unparalleled flexibility, allowing you to visualize time exactly how

Cross Over Trend – EMA/SMA 交叉趋势指标 Cross Over Trend 是一款适用于 MetaTrader 5 的简单而高效的技术指标,用于直观显示 指数移动平均线(EMA) 与 简单移动平均线(SMA) 之间的关系。 该指标可以帮助交易者快速识别当前市场趋势,并根据 EMA 与 SMA 的相对位置自动将市场阶段划分为 上升趋势(UpTrend) 和 下降趋势(DownTrend) 。 工作原理 指标比较 EMA 和 SMA 的当前值: EMA > SMA → UpTrend(上升趋势) EMA ≤ SMA → DownTrend(下降趋势) 当 EMA 位于 SMA 上方时,相应区域显示为 UpTrend 。 当 EMA 下穿 SMA 时,显示状态切换为 DownTrend 。 这样,无需手动比较 EMA 和 SMA,即可快速、清晰地判断当前市场方向。 主要功能 自动识别 EMA/SMA 交叉 分别显示 **UpTrend(上升趋势)**和 DownTrend(下降趋势) EMA 周期可自由设置 SMA 周期可自由设置 可选择独立的 EMA/SMA 计算
VWAP 偏差指标(VWAP Deviation Indicator) VWAP 偏差指标 是一款基于成交量加权的价格分析工具,用于识别当前价格与动态计算的 VWAP 基准线及其偏差水平之间的关系。 与简单移动平均线不同,该指标采用 Tick Volume(Tick 成交量)加权 方式进行计算,使交易活动较高的价格水平在 VWAP 计算中获得更大的权重。 指标显示中央 VWAP Basis ,同时提供 2 倍和 3 倍偏差带 ,为分析当前价格位置、潜在的价格过度延伸以及均值回归区域提供动态参考框架。 主要功能 成交量加权 VWAP 指标使用所选计算周期内的 Tick Volume 计算自定义 VWAP。 动态偏差带 VWAP 周围显示四个偏差水平: Upper Dev 2 — VWAP + 2× 偏差 Upper Dev 3 — VWAP + 3× 偏差 Lower Dev 2 — VWAP − 2× 偏差 Lower Dev 3 — VWAP − 3× 偏差 这些水平会根据当前市场条件动态调整。 两种偏差计算方法 您可以在以下两种方法之间进行选择: 平均偏差(Average Devi

VWAP Analytics Advanced Suite for MetaTrader 5
Gain institutional-grade market insight with the VWAP Analytics Advanced Suite , a professional Volume Weighted Average Price indicator built exclusively for MetaTrader 5. This tool goes beyond a simple VWAP line; it is a complete analytical ecosystem designed to identify trend bias, measure market deviation, and provide high-probability entry and exit signals with precision timing. Whether you are a day trader, scalper, or swing trader, this su

Spread & Broker Server Analytics Advanced Suite Glass 3D effect for MetaTrader 5 ( Dashboard & compact dashboard)
Master the fundamental mechanism of market liquidity with the Spread Analytics Advanced Suite, a professional-grade monitoring and alert tool built exclusively for MetaTrader 5. In modern trading, the Bid-Ask spread is your primary transaction cost. This suite provides the transparency and precision required to manage these costs effectively, ensuring you trade only when conditio

Moment Analytics: Confluence Dashboard Advanced Suite for MetaTrader 5
Gain an unparalleled edge in market timing and trend confirmation with the Moment Analytics Confluence Dashboard , a professional-grade analytical suite built exclusively for MetaTrader 5. This tool consolidates nine of the most powerful momentum and volatility indicators into a single, cohesive on-chart HUD (Heads-Up Display), eliminating chart clutter and providing instant, at-a-glance confluence signals. Whether you ar

Price Alerts Advanced Suite for MetaTrader 5
Take control of your trading execution with the Price Alerts Advanced Suite , a professional-grade technical analysis tool built exclusively for MetaTrader 5. This suite goes far beyond simple horizontal lines; it is a complete analytical ecosystem designed to identify key market levels, monitor price action in real-time, and deliver instant notifications across multiple channels. Whether you are a day trader, swing trader, or algorithmic develope

Bollinger Trend Signals MT5 - 基于布林带的趋势指标。所有信号均即时生成,无重绘或滞后。它能识别方向性趋势通道,并
提供潜在的入场点和出场点。
指标工作原理
该指标的功能基于趋势通道和高低点确定系统的结合使用。
蓝线是主要的平滑趋势线;当蓝线位于价格上方时,趋势通道为下跌;当蓝线位于价格下方时,趋势通道为上涨。
橙色箭头表示下跌趋势信号,浅蓝色箭头表示上涨趋势信号。
在上涨趋势中,橙色点代表止损点,用于在价格峰值处设置止损。浅蓝色点表示价格上涨趋势的恢复,可用于重新入场或加仓。
在下跌趋势中,浅蓝色点代表止损点,用于在价格谷底处设置止损。橙色点用于重新入场或加仓。
该指标推荐用于 M1 至 H4 时间周期。 适用于货币、金属和指数。 所有信号均提供提醒。 该指标完全不重绘。 所有信号均在 K 线收盘时生成。
输入参数
Period Bollinger Bands – 趋势通道的主要周期。 Show Bollinger Bands – 在图表上显示布林带。 Re-entry Stop Dot Period – 最高价和最低价止损点的周期。

该指标由标准指标组成复杂系统,并立即在图表历史数据上进行回测。它包含一个由 16 个指标组成的矩阵,涵盖 9 个时间周期:点击单元格即可将所需周期的指标添加到组合中,组合进行投票,投票阈值生成信号。每次组合更改后,统计数据都会重新计算:结果、交易次数、盈利交易占比、盈利因子、预期值和回撤。遗传算法优化器会自动选择组合,最终的系统会保存为密钥,并可导入到任何图表。
( 用户手册 )
指标的选择、投票阈值和退出规则均由交易者自行决定,而指标则负责单元格计算、回测和组合搜索。
功能介绍
该指标提供三种运行模式。“矩阵实验室”是一个完整的实验室:包含矩阵、统计数据和优化器。“策略”模块是一个简洁的窗口,用于显示单个预设策略:共识策略、入场计划或当前持仓,以及六位数的历史数据。 EA 数据源不会在图表上绘制任何内容,仅为运行中的 EA 提供缓冲区。其他任务可使用单独的模块:
- 16x9 矩阵:包含 M1 至 MN1 时间周期上的 MA、MACD、RSI、随机指标、CCI、ADX、一目均衡表、布林带、抛物线转向指标、威廉指标 %R、动量指标、OsMA、RVI、DeMarker、MFI

MTF LRMA Plus: Multi-Timeframe Trading Decision System Linear Regression Moving Average with ADX Trend Strength Analysis Across 6 Timeframes Product Overview MTF LRMA Plus is a professional-grade trading indicator that combines Linear Regression Moving Average (LRMA) trend analysis with ADX (Average Directional Index) trend strength measurement across 6 key timeframes (D1, H4, H1, M30, M15, M5). It delivers actionable insights through an intuitive visual dashboard, helping traders identify h

GOLDEN CROSS V1.0 - Moving Average Crossover Indicator with Quality Score General Description The GOLDEN CROSS is an advanced technical indicator developed for MetaTrader 5 that combines moving average crossovers with a quality scoring system based on multiple technical filters. It is designed to identify high-probability entry points, offering traders interactive visual tools and comprehensive risk management features. Indicator Structure and Logic 1. Crossover System Fas

KITO Opportunity ATLAS
MARKET OPPORTUNITY INTELLIGENCE FOR MT5 The market rarely suffers from a shortage of signals. The real challenge is knowing which opportunities deserve your attention—and which ones deserve to be ignored. Kito Atlas transforms your MetaTrader 5 terminal into a multi-market opportunity command centre. From one compact dashboard, it scans multiple symbols and timeframes, compares several forms of market evidence, ranks the strongest opportunities and opens a structured price

This custom algorithmic indicator is a zero-lag, non-repainting trading tool engineered for precision entries. By fusing a proprietary combination of momentum and structural metrics behind the scenes, it identifies immediate market exhaustion points without relying on delayed data. Because it calculates and locks its logic the exact millisecond a bar closes, signals will never shift, lag, or repaint after the fact.
Execution & Trade Management:
The One-Candle Rule: The primary execution strate

QQE Signal – 定性定量估计(QQE)指标
QQE Signal 是一款适用于 MetaTrader 5 的专业振荡器技术指标,旨在通过平滑 RSI 与动态计算的 QQE 信号线,帮助交易者识别潜在的趋势变化和市场动量变化。 该指标清晰显示 蓝色 RSI 信号线 与 黑色虚线平滑 QQE 线 之间的关系,并结合重要的 50 水平线 ,为市场方向和动量分析提供直观参考。 主要功能 QQE 信号线 蓝色线代表经过平滑处理的 RSI 信号值。 通过观察蓝色线的变化,交易者可以分析市场动量的变化以及潜在的价格方向转换。 平滑 QQE 线 黑色虚线是蓝色 QQE 信号线的动态参考线。 两条线之间的交叉可以用于识别潜在的市场动量变化。 〰️ 50 水平线 50 水平线是振荡器的重要参考位置: 高于 50 → 偏多动量 低于 50 → 偏空动量 买入信号 潜在的 BUY 买入信号 形成条件: 蓝色 QQE 线从下方向上穿过黑色虚线。 随后蓝色 QQE 线从下方向上突破 50 水平线 。 这种组合可能表示市场动量正在由偏空转向偏多。 卖出信号 潜在的 SELL 卖出信

【均线流二号】 一眼看透多空力量,把行情节奏握在手里
还在几百根均线里看得眼花缭乱?还在犹豫"该不该进场、该在哪止损"? 均线流二号把传统均线"升级"成一套完整的趋势作战系统——图表上不再是零散的价格线, 而是一条可视化的"多空河流"。多达100条均线同时滚动,每一根K线上, 哪一方正在掌控、力量有多强、即将发生什么,全都清清楚楚地摆在你眼前。
为什么值得你拥有?
一眼看趋势,告别主观猜测 全屏均线流实时着色:多头红、空头绿,方向一目了然。无论你是新手还是老手, 都不用再靠"感觉"判断行情,K线处于多头区还是空头区,扫一眼就知道。
三级信号,捕捉行情起爆点 系统自动给出三类买卖提示: · 顺势信号——趋势刚确立,跟对方向入场; · 反转信号——趋势即将掉头,提前布局; · 极开信号——多空力量极致收敛后的爆发行情,机会价值最高。 做多信号在K线下方标注,做空信号在上方标注,绝不混淆。
不止告诉你方向,还画好止损与止盈 每一笔潜在交易都自带"作战地图":止盈线、止损线、极价线自动绘制, 什么时候离场、什么时候设保护,不再靠拍脑袋。配合"前小线宽突破"检测, 专

Volume Footprint 是一款适用于 MetaTrader 5 的逐价位订单流指标。它不再只显示单一的K线,而是将每根K线拆分为若干价格行,展示该价位上成交的买价(bid)和卖价(ask)成交量——让您清楚看到买卖双方究竟在K线内的哪个价位完成交易,而不仅仅是收盘价。 该指标在较低时间周期上聚合图表的逐笔成交数据(相对于图表周期自动选择,或手动固定),并利用 MetaTrader 自身的价格与成交量数据,将每笔成交归类为买方或卖方。 订单流工具集 Point of Control (POC) — 该K线内成交量最大的价位,以专门的行突出显示。 Value Area — 可配置的价格区间,包含K线总成交量的设定比例,默认70%。 Stacked Imbalance — 标记连续价格行中一方以设定比例占据主导的情况。 Absorption — 检测在K线高点或低点被吸收的大量反向成交,而价格并未随之延续。 Unfinished Auction — 标记K线收盘时主导方在极值处未见衰竭的情况。 Naked Point of Control — 在可见历史范围内追踪尚未被重新测试的P

Sultan of Swing Sultan of Swing is a clean and reliable swing-based signal indicator designed for traders who want clear entries without confusion or lag. The indicator detects price swings and delivers signals only at the open of a new bar. sometimes mid-bar signals but no repainting, and no unnecessary noise. Key Features Non-repainting – Signals stay fixed always. New bar signals only – Alerts appear at the start of the candle, sometimes in the Middle. Price swing logic – Built purely on mar

DaySwingPro Institutional — Multi-Factor Day & Swing Trading Engine Confluence-based BUY/SELL signals with institutional risk management, Smart Money Concepts and a live HUD — engineered with a strict zero-repaint architecture. What is it for? DaySwingPro Institutional is built for day and swing traders who hold positions from one day to several weeks (recommended timeframes: H1, H4, D1 ). Instead of firing arrows on every minor fluctuation, it waits for the trend, momentum and mark

箭头只告诉您买入。Obsidian Scalper Pro 告诉您在哪里买、止损放在哪里、三个目标在哪里、按照您的风险仓位该有多大,以及这个形态在 100 分里值多少分。每个信号都以一份画在图表上的完整交易计划的形式到来,内置的统计窗口展示最近一百个信号的诚实结果,连带置信区间的胜率一并给出。每个决定都在收盘K线上做出,所以您看到的历史,就是您本可以交易的那段历史。 该指标在黄金(XAUUSD)M30 上表现最佳,也可用于任何其他品种和周期。 需要与之配套的策略吗? 购买后请在 MQL5 上给我发消息,我会发送给您。 它做什么 Obsidian Scalper Pro 在既有趋势中寻找回调入场,并为每一个入场交出一份现成的计划。Entry、SL、TP1 和 TP2,以及可选的 TP3,作为水平线和阴影区域直接画在图表上,带着价格标签和 R:R 比例。手数由您的风险百分比和这个信号实际的止损距离算出,使用亏损方向的跳动点价值,因此在 CFD 和交叉货币账户上都保持正确。每个信号还有一个 0 到 100 的 Score,面板上另有一个实时的就绪度数值,说明此刻的形态会有多好。 三层结构,一

流动性池是尚未被触及的已确认的摆动高点或摆动低点。流动性扫荡是价格交易至该水平之外随后收盘回到区间内的那一根K线 - 交易者也将同一事件称为止损猎杀、止损扫荡、流动性抓取或假突破。Liquidity Sweep Pools MTF 在当前图表以及你选择的更高时间周期上标记流动性池以及在其上发生的流动性扫荡,并添加一个活跃流动性池的实时面板、流动性池形成时的成交量过滤器,以及检测到的扫荡的 CSV 导出。 此处多时间周期确认意味着每个流动性扫荡都可以对照更高时间周期的流动性池来解读,而无需离开你面前的图表,两组水平以各自的颜色并排绘制。 它标记什么 一件事,精确地说:流动性池的几何形态。它绘制的每个流动性池都带有价格水平、方向、距离和存在时长,同样的四个值会进入面板和 CSV 文件。这就是全部词汇,因此输出易于逐根K线验证,也易于输入到你自己的规则中,无论你是手动交易它们还是从智能交易系统读取缓冲区。 多时间周期流动性池确认 该指标可以将更高时间周期上按相同规则形成的流动性池直接绘制在当前图表上,使用单独的颜色和线宽,因此两个时间周期都可见而无需切换图表。更高时间周期的流动性池绝不会在确

Supply and Demand + Market Structure Smart Money order block detection, volume-weighted confirmation, and full BOS/CHoCH market structure Check out Rudy Bank for more features: https: // www.mql5.com/en/market/product/193059 Check out Iron Entry for zone entry confirmations: https: // www.mql5.com/en/market/product/193937
Overview
SupplyDemand Edge finds and draws institutional supply and demand order blocks directly on your chart, then backs every one of them up with real market data — volume

See the Market From the Higher-Timeframe Perspective. Ashinton MTF-Trend Pro is a professional multi-timeframe trend analysis indicator for MetaTrader 5, designed to help traders quickly identify directional alignment across Monthly (MN1), Weekly (W1), Daily (D1), and H4 timeframes.
Instead of analyzing each timeframe manually, MTF-Trend Pro brings the bigger market picture into one clean, intuitive dashboard, helping you determine whether the higher timeframes are aligned, conflicted, or deve

ElliottWave Pro — Automatic Wave 2 Detection and Wave 3 Targets An indicator for MetaTrader 5 that automates Elliott Wave and Fibonacci analysis. ElliottWave Pro detects the end of the first impulse (Wave 1), calculates the corrective zone (Wave 2) and draws a ready-to-use trading setup with Stop Loss and Take Profit levels. Key Features Automatic Wave 1 detection: connects points P0 and P1 to show the trend structure. Wave 2 entry zone: a rectangular retracement zone with Fibonacci levels 38.2%

SMC Sentinel — Smart Money Concepts 指标 顺应市场结构交易,以不同视角洞察市场。 SMC Sentinel 是一款面向 MetaTrader 5 的高级 Smart Money Concepts(SMC)分析指标 ,将多种价格行为分析概念整合到一个简洁、可自定义的图表分析系统中。 SMC Sentinel 不依赖单一信号,而是综合分析市场结构、流动性、价格失衡、机构区域、回撤区域以及趋势背景,帮助交易者理解 价格从哪里来、正在对什么产生反应,以及潜在交易机会正在什么位置形成。 核心功能 市场结构 直接在 MT5 图表上识别重要的市场结构变化: Swing Highs & Swing Lows BOS — Break of Structure CHoCH — Change of Character 主要结构过滤 可配置的摆动与结构强度 高周期市场偏向 结构分析引擎可以帮助你专注于重要的市场运动,同时减少图表中的无关噪音。 流动性分析 SMC Sentinel 映射重要的流动性区域以及价格互动: Buy-Side Liquidity (

Trend Market — Smart Money Concepts (SMC) Indicator with Order Blocks, FVG & Auto TP System Trend Market is a complete Smart Money Concepts toolkit built to help you read institutional price behavior with clarity — market structure, liquidity zones, and precise risk-based profit targets, all in one indicator. The Strategy This indicator is built around real Smart Money Concepts (SMC) trading logic: Market Structure Detection (BOS / CHoCH) — Using fractal-based swing analysis, the indicator auto
您知道为什么MetaTrader市场是出售交易策略和技术指标的最佳场所吗?不需要广告或软件保护,没有支付的麻烦。一切都在MetaTrader市场提供。
