Three Bar Structure Map
- Indicadores
- Versão: 1.0
- Ativações: 5

# Three Bar Structure Map - Geometry without thresholds
*Category: Pattern Recognition | Difficulty: beginner | Window: separate window below the chart | Markets: Universal (Forex, indices, commodities, crypto, stocks) | Suggested timeframes: M15, M30, H1, H4, D1*
## Short description
> Classifies every three bar group into four geometric configurations, using no arbitrary threshold: two bars either exceed each other or they do not.
## Full description
### Overview
Every group of three consecutive bars can be classified into a finite number of configurations, comparing each bar highs and lows with the previous one. There are eight possible combinations in all, but only some carry information. This indicator recognises the four that matter in practice: bullish expansion, bearish expansion, progressive compression and outside structure, the bar engulfing the previous one. The distinguishing feature is that the classification is purely geometric and depends on no arbitrary threshold: two bars either exceed each other or they do not, and there is nothing to calibrate. The result is therefore completely objective and repeatable, and never changes with parameter changes, simply because no classification parameters exist.
### How the calculation works
1. The current bar high and low are compared with the previous one, and the previous with the one before that.
2. The outside structure, higher high and lower low, is evaluated first because it is the most significant.
3. The inside bar requires both extremes contained; with the non-strict check it suffices that the range does not expand.
4. Directional expansion requires only one of the extremes to be exceeded, and the code doubles if the previous bar also expanded the same way.
5. The resulting code is a number between minus two and plus two, summarising the direction and confirmation of the configuration.
6. The average of codes over the chosen window produces the structural bias, a continuous value summarising which configurations prevail.
### How to use it
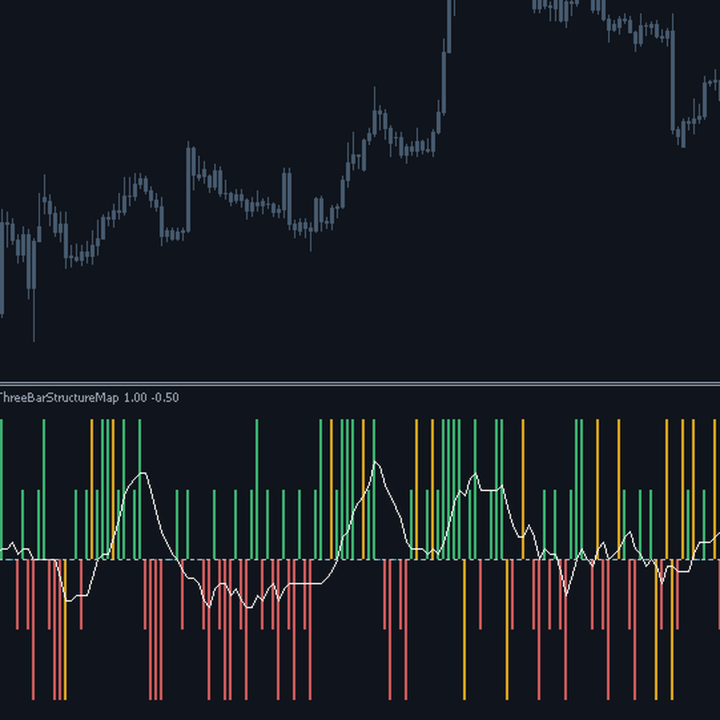
- Read the colour for the configuration of the single triple and the white line for the prevailing tendency over recent bars.
- A sequence of expansions in the same direction describes a supported move with no need for any trend indicator.
- Repeated compressions indicate a pause phase that often precedes a significant expansion.
- Outside structures are the most significant configurations: the market explored both sides within a single bar.
- The structural bias crossing zero signals a change in which geometric configurations prevail.
### Who it is for and on which timeframes
It suits traders wanting to read bar structure objectively, and those wary of indicators full of parameters to optimise. It works on all timeframes from M15 up. The complete absence of thresholds is its most interesting feature: the result cannot be bent to one wishes and this makes it a reliable reference. It produces no entry signals and no direct operational indication should be sought in it.
### Practical example of reading a signal
On DAX40 H1 the structural bias sits steadily around plus one and a half for two sessions: the triples are predominantly confirmed bullish expansions, so the market is rising by expanding its range upwards bar after bar. Then four consecutive compressions appear and the structural bias falls towards zero: the move stopped without reversing. The fifth bar is an outside structure with a bearish close, the most significant configuration: the market explored both sides and chose the downside. Over the following bars the structural bias falls into negative territory.
## Input parameters
| Parameter | Default | Description |
|---|---|---|
| `InpBiasPeriod` | 12 | Period of the average producing the structural bias. Short windows react quickly, long ones describe the underlying tendency. |
| `InpStrictInside` | true | With true the inside bar requires both extremes strictly contained; with false it suffices that the range does not expand. |
## Advantages / strengths
- No arbitrary threshold: the classification depends only on comparisons between numbers and cannot be bent.
- Only two parameters, one of them purely definitional: there is practically nothing to optimise.
- The structural bias turns a discrete classification into a continuous, readable value.
- Extremely light computation and no repaint.
## Limitations and warnings
- It completely ignores bar size: a one pip expansion counts the same as a hundred pip one.
- Ambiguous configurations, with identical extremes, are classified as irrelevant even though they may matter.
- It produces no operational signal: it describes geometry, it does not suggest what to do.
- On low timeframes the configurations follow one another too quickly for the reading to be useful.
**No repaint:** values printed on a closed bar are never modified afterwards.
**Disclaimer.** This product is a technical analysis tool, not an automated trading system, and it offers no profit guarantee whatsoever. Financial markets carry the risk of total loss of the invested capital. Past performance is not indicative of future results. Every signal must be confirmed with your own analysis, a money management plan and prior testing on a demo account. The author is not responsible for trading decisions taken on the basis of this indicator.
## Suggested tags / keywords for MQL5
`price action`, `structure`, `pattern`, `geometry`, `inside bar`, `outside bar`, `no repaint`, `objective`