 MetaTrader 5
 Experts
 지표
 라이브러리
 유틸리티
 위젯
 규칙
MetaTrader 5용 기술 지표 - 214
 기술 지표의 시그널은 주식 및 외환 시장에서 거래를 개시 및 종료하는 데 중요한 역할을 합니다. 지표의 본질은 미래의 가격 변화를 예측하기 위한 금융 시그널 값의 수학적 변형입니다.
기술 지표를 테스트하여 시장 행동과 그로 인한 이익을 더 잘 예측할 수 있습니다.

is a versatile analytical tool designed for both advanced traders and beginners. It combines classic trend line analysis with automatic Fibonacci level plotting to deliver precise market entries and structural clarity. Built as an intuitive and clean on-screen dashboard, this indicator simplifies multi-timeframe analysis without cluttering your main workspace. Technical Analysis and Entry Points The indicator automates the most critical aspects of price action and structural trading: Trend L
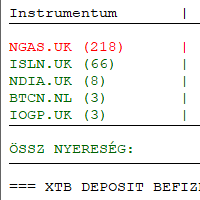
Introducing my indicator in Meta Trader 5. XTB export analysis and charting and export of currency conversion to csv for tax return. This indicator is an independent development and has no official connection with XTB S.A. https://youtu.be/z9JVhqKdKns
Hungary: Meta Trader 5 ben indikátorom bemutatása. XTB export elemzése és chartra kiíratása és adóbevalláshoz deviza konverzió csv.-be exportálása. Ez az indikátor egy független fejlesztés, és semmilyen hivatalos kapcsolatban nem áll az XTB S.A. v

QUANTUM OCEAN SIGNALS MT5
Quantum Ocean Signals MT5 is a multi-filter decision-support indicator for MetaTrader 5. It evaluates trend direction, momentum, directional strength, volatility and candle confirmation to display structured BUY and SELL setups after a candle has closed.
The indicator does not open or manage trades. It gives manual traders a clear trade plan consisting of a signal, an adaptive Stop Loss and three optional Take Profit reference levels.
MAIN FEATURES
• Closed-candle

Level Alert Utility is an essential workflow tool for MetaTrader 5 designed to eliminate constant screen fatigue. Effortlessly drag the interactive level line directly on your chart—the indicator instantly configures trigger rules and delivers real-time notifications via customizable sound repeats, popup alerts, mobile Push notifications, and email. Equipped with high-speed millisecond monitoring, gap and impulse protection, quick-action chart buttons, hotkey support, and state persistence acros

SMC SYNTHRIDERS — Smart Money, Liquidity and Market Phase Trading Indicator SMC SYNTHRIDERS is a MetaTrader 5 market-analysis and signal indicator developed by MohSOLUTIONS . It is designed for traders who analyse price through market structure, liquidity behaviour, Smart Money Concepts, multi-timeframe context and market phases . Rather than generating signals from a single condition, SMC SYNTHRIDERS combines multiple layers of market information to identify conditions where a structured tradin

MACandleApproxPro — Advanced MA Candle Reconstruction & Multi-Dimensional Market Structure Indicator Overview MACandleApproxPro is a comprehensive technical analysis tool designed for professional traders. It breaks through the limitations of traditional moving averages by reconstructing MA data into "MA Candles" through complex algorithms. This unique visualization filters out market noise, allowing you to examine price trends, momentum shifts, and critical market structures from a more

# Level Strength Ranker - Only the two levels that matter
*Category: Support and Resistance | Difficulty: intermediate | Window: chart window (overlaid on price) | Markets: Universal (Forex, indices, commodities, crypto, stocks) | Suggested timeframes: M30, H1, H4, D1*
## Short description
> Scores every level by number of touches, size of reactions and recency, drawing only the strongest one above and below price.
## Full description
### Overview
Not all levels are equal. A level touched

# Round Number Magnet - Do round numbers really matter?
*Category: Support and Resistance | Difficulty: beginner | Window: chart window (overlaid on price) | Markets: Universal (Forex, indices, commodities, crypto, stocks) | Suggested timeframes: M15, M30, H1, H4, D1*
## Short description
> Draws round levels with an automatically computed step and measures how much price actually reacts to them on this specific instrument.
## Full description
### Overview
Round numbers attract orders: st

# Break Retest Detector - The full sequence, not just the break
*Category: Support and Resistance | Difficulty: intermediate | Window: chart window (overlaid on price) | Markets: Universal (Forex, indices, commodities, crypto, stocks) | Suggested timeframes: M15, M30, H1, H4, D1*
## Short description
> Recognises the full sequence of break, return to the level and reaction. It signals only when all three conditions occur in the correct order.
## Full description
### Overview
Breaking a le

Multi-Symbol MTF Scanner
패턴이 완성되는 바로 그 순간에 셋업을 포착하십시오 Multi-Symbol MTF Scanner는 여러 타임프레임에 걸쳐 귀하의 관심종목 전체를 한 번에 감시하며, 특정 시장이 다단계 스윙 셋업을 완성하는 정확한 순간을 표시해 드립니다. 이 도구는 멀티 타임프레임, 멀티 심볼 방식으로 매매하시는 트레이더, 그리고 준비된 하나의 셋업을 찾으려고 수십 개의 차트를 일일이 클릭하고 싶지 않으신 트레이더를 위해 제작되었습니다. 셋업 전체는 도구 내부에서 단계별로 자체 연산되므로, 추가로 설치하실 것이 전혀 없습니다. 각 셀은 셋업이 얼마나 형성되었는지를 'Y단계 중 X단계' 형식으로 보여 드리며, 마지막 단계가 발동되는 즉시 초록색 BUY 또는 빨간색 SELL로 바뀌면서 팝업, 소리, 그리고 휴대폰 푸시 알림을 함께 전달합니다. 이 도구는 진입 지점만 표시하며, 청산은 전적으로 귀하의 통제에 맡깁니다.
MetaTrader 4 및 MetaTrad

# Dynamic Pivot Zones - Pivots as zones, not lines
*Category: Support and Resistance | Difficulty: beginner | Window: chart window (overlaid on price) | Markets: Universal (Forex, indices, commodities, crypto, stocks) | Suggested timeframes: M5, M15, M30, H1*
## Short description
> Turns pivots into zones whose width depends on the previous period volatility. The levels stay fixed for the whole session, with no recalculation.
## Full description
### Overview
Classic pivots are infinitely

# Supply Demand Zone Mapper - Compressed base and decisive departure
*Category: Support and Resistance | Difficulty: intermediate | Window: chart window (overlaid on price) | Markets: Universal (Forex, indices, commodities, crypto, stocks) | Suggested timeframes: M15, M30, H1, H4, D1*
## Short description
> Recognises consolidation bases followed by a decisive move and draws them as zones, which remain until price crosses them fully.
## Full description
### Overview
A demand zone forms wh

# Untested Level Finder - The levels still intact
*Category: Support and Resistance | Difficulty: beginner | Window: chart window (overlaid on price) | Markets: Universal (Forex, indices, commodities, crypto, stocks) | Suggested timeframes: M15, M30, H1, H4, D1*
## Short description
> Draws only the swing levels price has never retested since they formed. A level stops being drawn the moment it is tested.
## Full description
### Overview
A level that has already rejected price three times

# Confluence Score Map - Where several references converge
*Category: Support and Resistance | Difficulty: advanced | Window: chart window (overlaid on price) | Markets: Universal (Forex, indices, commodities, crypto, stocks) | Suggested timeframes: M30, H1, H4, D1*
## Short description
> Computes four independent families of levels and draws only the price bands where at least the required minimum number of references converges.
## Full description
### Overview
A level where several inde

# False Breakout Filter - The failed break as a signal
*Category: Support and Resistance | Difficulty: intermediate | Window: chart window (overlaid on price) | Markets: Universal (Forex, indices, commodities, crypto, stocks) | Suggested timeframes: M15, M30, H1, H4, D1*
## Short description
> Watches every break for a fixed number of bars and classifies it only afterwards. A failed break produces an arrow the opposite way, because it is itself a signal.
## Full description
### Overview
E

# Range Boundary Tracker - Edges that do not follow price
*Category: Support and Resistance | Difficulty: intermediate | Window: chart window (overlaid on price) | Markets: Universal (Forex, indices, commodities, crypto, stocks) | Suggested timeframes: M15, M30, H1, H4, D1*
## Short description
> Recognises when the market enters a range, fixes its two extremes and holds them still while the range lasts, as a trader would draw them.
## Full description
### Overview
A channel that follows

# Level Decay Model - A level that wears out
*Category: Support and Resistance | Difficulty: advanced | Window: chart window (overlaid on price) | Markets: Universal (Forex, indices, commodities, crypto, stocks) | Suggested timeframes: M30, H1, H4, D1*
## Short description
> Assigns each level a strength that decays over time and with every test it undergoes. The level is abandoned once residual strength falls below the threshold.
## Full description
### Overview
A level does not have unl

MT5용 암호화폐 외환 지표 "행잉맨 및 역망치 패턴", 리페인트 없음, 지연 없음. - "행잉맨 및 역망치 패턴" 지표는 가격 움직임 거래에 매우 효과적인 지표입니다. - 차트에서 상승 역망치 패턴과 하락 행잉맨 패턴을 감지합니다. - 상승 역망치 패턴: 차트에 파란색 화살표 신호 표시 (사진 참조) - 하락 행잉맨 패턴: 차트에 빨간색 화살표 신호 표시 (사진 참조) - PC 및 모바일 알림 기능 제공 - 4가지 스타일의 신호 화살표 제공 - "행잉맨 및 역망치 패턴" 지표는 지지/저항 수준 및 대기 주문과 함께 사용하기에 매우 적합합니다. 고품질 트레이딩 로봇 및 지표를 보려면 여기를 클릭하세요! 본 제품은 MQL5 웹사이트에서만 제공되는 오리지널 제품입니다. .............................................................................

Makito AD is a volume-based market analysis indicator designed to identify market trends and changes in market direction by analyzing the relationship between price action and volume . The indicator uses a dynamic line that changes color based on the current market condition , making it easier to visually identify whether market pressure is becoming bullish, bearish, or showing potential divergence. Key Features Volume-Based Analysis — Uses volume and price action to assess market direction. Dyn

Probability Cone MT5 — Statistical Price Projection Indicator Probability Cone MT5 is a technical analysis tool that projects statistically grounded price ranges forward on the chart. Using a log-normal volatility model — the same mathematical approach behind option pricing and quantitative risk tools — the indicator calculates where price is statistically likely to travel over a chosen time horizon. Statistical Price Projection Instead of eyeballing support, resistance, or a breakout target, Pr

Footprint Visual Order flow footprint chart, drawn directly in the main window, sharing the real price scale of your candles. Short description (for the Market listing) Footprint Visual draws a real bid/ask footprint — buy and sell volume per price level, POC, Value Area and net delta — for each of the most recent bars, right next to your candles. Built on genuine volume_real tick data (not tick-count approximations), it works on any symbol whose broker feed reports real trade volume, and is tun

사용자가 지정한 세션의 고가/저가 레인지를 표시하고, 내장된 적응형 Supertrend로 필터링된 꼬리 돌파 매수/매도 시그널을 생성합니다. 상위 타임프레임 방향 확인과 ADX 필터는 선택 사항이며, TP/SL 가이드라인을 자동으로 그려줍니다. 주요 기능 세션 레인지 박스 — 사용자가 지정한 모든 세션(예: 본인의 SAST 거래 시간, 아시아 세션, 런던 오픈 등)의 고가/저가를 자동으로 추적하고 그리며, 실시간으로 업데이트되고 세션 종료 시 고정됩니다. 내장 Supertrend 추세 필터 — 다음 기능을 갖춘 독립적인 Supertrend 엔진: 룩백 기간 동안 ATR의 백분위 순위에 따라 승수를 조정하는 적응형 팩터 옵션으로, 변동성에 따라 조여지거나 넓어집니다. 선택적 상위 타임프레임(HTF) 방향 확인 — 상위 타임프레임의 Supertrend가 작업 타임프레임과 방향이 일치할 때만 시그널로 카운트됩니다. 추세 강도가 약한 횡보장에서 시그널을 피하기 위한 선택적 ADX 필터. 돌

Stop Watching Key Price Levels. Get Alerted. Horizontal Line Alert automatically monitors a price level and alerts you when price closes above, closes below, or touches the line . Go beyond a basic horizontal-line alert with candle confirmation, candle-size filtering, and price-action conditions . KEY FEATURES Close Above
Detect qualifying bullish candles closing above your horizontal level. Close Below
Detect qualifying bearish candles closing below your level. Close Above / Bel

How it works The indicator calculates VWAP (Volume Weighted Average Price) — the average price weighted by traded volume, widely used by institutional traders as the intraday "fair price" benchmark. Unlike a regular moving average, VWAP gives more weight to periods with higher volume, showing where most of the money was actually traded. The product combines three ways of calculating this average in a single indicator, so there is no need to install separate tools: Daily: the sum resets every da

Stop guessing where a pullback ends. Most traders can spot a trend. The hard part is the entry — buying too early into a falling knife, or chasing after the move has already gone. Fibonacci Trend Compass solves exactly that one problem, and it does it on autopilot. Three steps, fully automatic: It reads the trend. An adaptive ATR trend engine paints the chart green or red and tells you which side of the market you are allowed to trade. It maps the impulse leg. Confirmed swing highs and lows

Kiwi Smart Trend System MT5 is a multi-feature trend and signal indicator for MetaTrader 5. The indicator combines trend direction, momentum, volatility, volume and multi-timeframe analysis in one clear chart system. It is designed to help traders identify market direction, evaluate signal conditions and plan potential entries with configurable risk-to-reward zones. Kiwi Smart Trend System is an analytical indicator. It does not open, modify or close trades. MAIN FEATURES Bullish and bearish tre

Iron Entry — Real-Time Signal Engine with Trend Filter & Momentum Candles Why You Should Choose This Indicator
Most signal tools redraw their arrows after the fact, by the time you notice a "signal," it's already changed or vanished. Iron Entry doesn't do that.
This indicator locks in its pivots and signals the moment they close, and once printed, they never move, disappear, or repaint. What you see live is exactly what stays on your chart tomorrow, next week, and next year. That means you c

# Candle Body Anatomy - Candle proportions in numbers
*Category: Pattern Recognition | Difficulty: beginner | Window: separate window below the chart | Markets: Universal (Forex, indices, commodities, crypto, stocks) | Suggested timeframes: M15, M30, H1, H4, D1*
## Short description
> Splits every candle into body and wicks as a percentage of the range and classifies it on explicit numeric thresholds instead of qualitative judgement.
## Full description
### Overview
Traditional candle nam

# Engulfing Quality Score - Not all engulfings are equal
*Category: Pattern Recognition | Difficulty: intermediate | Window: chart window (overlaid on price) | Markets: Universal (Forex, indices, commodities, crypto, stocks) | Suggested timeframes: M15, M30, H1, H4, D1*
## Short description
> Checks the engulfing pattern and scores it on four additional criteria, flagging only those exceeding the quality threshold.
## Full description
### Overview
The engulfing pattern is among the best k

# Inside Bar Breakout Map - Compression with ready levels
*Category: Pattern Recognition | Difficulty: beginner | Window: chart window (overlaid on price) | Markets: Universal (Forex, indices, commodities, crypto, stocks) | Suggested timeframes: M15, M30, H1, H4, D1*
## Short description
> Counts consecutive inside bars and draws the two breakout levels of the mother bar, holding them fixed while the pattern is active.
## Full description
### Overview
An inside bar, entirely contained wit

# Pin Bar Rejection Scanner - Rejection where it matters
*Category: Pattern Recognition | Difficulty: intermediate | Window: chart window (overlaid on price) | Markets: Universal (Forex, indices, commodities, crypto, stocks) | Suggested timeframes: M15, M30, H1, H4, D1*
## Short description
> Recognises bars with a dominant wick but flags them only when they are significant in absolute terms and occur at a recent extreme.
## Full description
### Overview
A bar with a very long wick tells

# Three Bar Structure Map - Geometry without thresholds
*Category: Pattern Recognition | Difficulty: beginner | Window: separate window below the chart | Markets: Universal (Forex, indices, commodities, crypto, stocks) | Suggested timeframes: M15, M30, H1, H4, D1*
## Short description
> Classifies every three bar group into four geometric configurations, using no arbitrary threshold: two bars either exceed each other or they do not.
## Full description
### Overview
Every group of three co
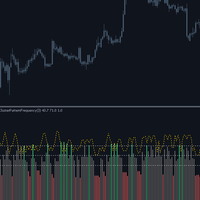
# Cluster Pattern Frequency - Eight sequences and their statistics
*Category: Pattern Recognition | Difficulty: advanced | Window: separate window below the chart | Markets: Universal (Forex, indices, commodities, crypto, stocks) | Suggested timeframes: M30, H1, H4, D1*
## Short description
> Encodes every three bar sequence into one of eight possible configurations and measures the historical frequency of it being followed by an upward move.
## Full description
### Overview
Every three b

Level Reaction은 상위 시간대의 지지 및 저항 수준을 표시하고, 이에 대한 두 가지 가격 반응(돌파 지속 및 수준에서의 반전)을 표시합니다. 터미널에서 사용 가능한 모든 기호와 시간대에서 작동합니다. 수준이 구축되는 방식 각 상위 시간대 막대의 시작 부분에서 인디케이터는 이전 막대의 고가, 저가 및 종가를 가져와 해당 종가 주변에 5개의 저항 및 지지 수준을 도출합니다. 수준 간의 간격은 이전 막대 범위의 넓이에 맞게 조정됩니다. 상위 시간대는 차트 주기에 따라 자동으로 선택됩니다. 선은 해당 기간에만 그려집니다. 두 가지 신호 유형 돌파 신호는 가격이 추세 필터(EMA) 방향으로 수준을 통과하여 마감할 때 발생합니다. 신호는 가격이 수준을 넘나들 때 차트에 화살표가 반복되는 것을 방지하기 위해 교차하는 막대 자체에서만 생성됩니다. 반전 신호는 가격이 수준에 닿을 때 가중 스토캐스틱 수치가 극단적인 수치(저항에서 과매수, 지지에서 과매도)를 나타낼 때 발생합니다. 각 수준

# Momentum Thrust Pattern - Thrust, pause, resumption
*Category: Pattern Recognition | Difficulty: intermediate | Window: chart window (overlaid on price) | Markets: Universal (Forex, indices, commodities, crypto, stocks) | Suggested timeframes: M15, M30, H1, H4, D1*
## Short description
> Recognises the thrust, contained pause and resumption beyond the extreme sequence, signalling only once all three phases have completed.
## Full description
### Overview
Directional moves almost always

# Higher Timeframe Bias - The higher timeframe without deception
*Category: Multi Timeframe Hybrids | Difficulty: intermediate | Window: separate window below the chart | Markets: Universal (Forex, indices, commodities, crypto, stocks) | Suggested timeframes: M5, M15, M30, H1, H4*
## Short description
> Brings a higher timeframe direction onto the current chart using only already closed bars, avoiding the most insidious form of repaint.
## Full description
### Overview
Multi timeframe ind

This draws fewer zones than the free order block indicators do. That's the whole point, and it's worth saying before you look at a screenshot and decide something is broken. On the gold chart I grabbed while writing this, the engine found 54 points of interest and marked 2 as tradeable. The other 52 sit on the chart only if you ask for them, greyed out and labelled what the material calls them: traps. Why it draws less than everything else Every order block tool I've used marks every block. Scro

An indicator that marks support and resistance areas by counting how many separate times price has returned to them. Every counted return is marked on the chart, so the count can be checked against the chart history.
What it draws Elektra Look Left draws two zones. One below price, for buys. One above price, for sells. Nothing else is added to the chart. Each zone is drawn as a rectangle rather than a single line. The height of the rectangle is the measured spread of the swings that formed

Introducing my indicator in Meta Trader 5. Trading212 export analysis and charting and exporting to csv. This indicator is an independent development and has no official connection with Trading212 (Trading 212 Markets Ltd.). https://www.youtube.com/watch?v=_hzdqUJgwo4
Hungary: Meta Trader 5 ben indikátorom bemutatása. Trading212 export elemzése és chartra kiíratása és csv.-be exportálása. Ez az indikátor egy független fejlesztés, és semmilyen hivatalos kapcsolatban nem áll a Trading212 vállalat

Trendline MachineGun MT5 자동 추세선. 스마트 강도 평가. 명확한 시장 구조. Trendline MachineGun MT5는 지지선과 저항선 추세선을 자동으로 탐지하고 평가하는 전문 트레이딩 보조지표입니다. 확정된 스윙 고점과 스윙 저점을 분석하여 여러 개의 유효한 추세선을 생성하고, 각 추세선에 0부터 100까지의 강도 점수를 부여합니다. 이를 통해 트레이더는 추세선을 계속 수동으로 그리거나 수정하지 않고도 중요한 시장 구조를 빠르게 확인할 수 있습니다. 모든 계산은 새로운 캔들이 생성될 때마다 업데이트됩니다. 시장 구조가 변하면 표시되는 추세선, 강도 순위 및 주요 레벨도 자동으로 조정됩니다. 주요 기능 지지 및 저항 추세선 자동 탐지 확정된 스윙 고점과 스윙 저점 분석 여러 추세선 후보 동시 표시 0–100 범위의 강도 점수 과거 터치 횟수와 최근성을 반영한 평가 새로운 캔들마다 자동 업데이트 거의 동일한 추세선 자동 필터링 가장 강한 주요 추세선 자동 선택
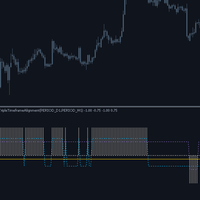
# Triple Timeframe Alignment - Three horizons, one score
*Category: Multi Timeframe Hybrids | Difficulty: intermediate | Window: separate window below the chart | Markets: Universal (Forex, indices, commodities, crypto, stocks) | Suggested timeframes: M5, M15, M30, H1, H4*
## Short description
> Checks whether current, middle and higher timeframes point the same way, showing both the overall score and each horizon direction.
## Full description
### Overview
Full alignment of the three tim

# HTF Level Projector - The levels everyone watches
*Category: Multi Timeframe Hybrids | Difficulty: beginner | Window: chart window (overlaid on price) | Markets: Universal (Forex, indices, commodities, crypto, stocks) | Suggested timeframes: M5, M15, M30, H1, H4*
## Short description
> Projects onto the current chart the high, low and close of the last complete higher period, updating only on period close.
## Full description
### Overview
Yesterday high and low are shared references, no

# Timeframe Divergence Monitor - When horizons disagree
*Category: Multi Timeframe Hybrids | Difficulty: intermediate | Window: separate window below the chart | Markets: Universal (Forex, indices, commodities, crypto, stocks) | Suggested timeframes: M5, M15, M30, H1, H4*
## Short description
> Measures the momentum disagreement between current and higher timeframes, highlighting phases where the two horizons move in opposite directions.
## Full description
### Overview
When the current t

# Volume Support Resistance Map - Supports and resistances drawn by volume
*Category: Experimental | Difficulty: intermediate | Window: chart window (overlaid on price) | Markets: Universal (Forex, indices, commodities, crypto, stocks) | Suggested timeframes: M15, M30, H1, H4, D1*
## Short description
> Horizontal bars drawn on the chart, long in proportion to the volume traded at each level: above price the selling volume marking resistances, below it the buying volume marking supports.
##

Here is the description translated and optimized for the MQL5 Market : Candle Timer Jason – Candle Countdown Indicator (MT5) Candle Timer Jason is a lightweight, high-performance utility developed for MetaTrader 5. It is designed for Forex, Stock, and Crypto traders who need to monitor the exact remaining time before the current candle closes. Knowing precisely how many minutes and seconds are left in a bar is essential for execution timing, helping you avoid premature entries or getting caught

️ Candle Timer Advanced Suite Glass 3D effect for MetaTrader 5
Gain the ultimate edge in precision timing with the Candle Timer Advanced Suite. This is not just a simple countdown; it is a professional-grade analytical tool designed to keep you perfectly synchronized with the market, ensuring you never miss a critical entry or exit due to server lag or misinterpretation. Built specifically for MetaTrader 5, this suite offers unparalleled flexibility, allowing you to visualize time exactly how

Cross Over Trend – EMA/SMA 크로스오버 지표 Cross Over Trend 는 MetaTrader 5를 위한 간단하고 효율적인 기술적 지표로, 지수이동평균선(EMA) 과 단순이동평균선(SMA) 의 관계를 시각적으로 표시합니다. 이 지표는 EMA와 SMA의 위치 관계를 기반으로 시장 상황을 자동으로 상승 추세(UpTrend) 와 하락 추세(DownTrend) 로 구분하여 현재 시장의 추세 방향을 쉽고 빠르게 파악할 수 있도록 합니다. 작동 원리 지표는 EMA와 SMA의 현재 값을 비교합니다. EMA > SMA → UpTrend EMA ≤ SMA → DownTrend EMA가 SMA보다 위에 있을 경우 해당 영역은 UpTrend 로 표시됩니다. EMA가 SMA 아래로 내려가면 표시가 DownTrend 로 전환됩니다. 이를 통해 EMA와 SMA를 직접 비교하지 않아도 현재 시장의 방향을 빠르고 명확하게 확인할 수 있습니다. 주요 기능 EMA/SMA 크로스오버 감지 Up
VWAP 편차 지표 (VWAP Deviation Indicator) VWAP 편차 지표 는 거래량을 기반으로 가격을 분석하는 도구로, 현재 가격과 동적으로 계산되는 VWAP 기준선 및 편차 수준 사이의 관계를 분석하도록 설계되었습니다. 단순 이동평균과 달리 이 지표는 틱 거래량(Tick Volume) 가중 방식 을 사용합니다. 이를 통해 거래 활동이 높은 가격 수준이 VWAP 계산에서 더 큰 가중치를 갖게 됩니다. 이 지표는 중앙의 VWAP Basis 와 함께 2배 및 3배 편차 밴드 를 표시하여 현재 가격의 위치, 잠재적인 과도한 가격 확장 및 평균 회귀 가능 영역을 동적으로 분석할 수 있도록 합니다. 주요 기능 거래량 가중 VWAP 선택한 계산 기간의 틱 거래량을 사용하여 사용자 지정 VWAP를 계산합니다. 동적 편차 밴드 VWAP를 중심으로 다음 4개의 편차 수준을 표시합니다. Upper Dev 2 — VWAP + 2× 편차 Upper Dev 3 — VWAP + 3× 편차 Lo

VWAP Analytics Advanced Suite for MetaTrader 5
Gain institutional-grade market insight with the VWAP Analytics Advanced Suite , a professional Volume Weighted Average Price indicator built exclusively for MetaTrader 5. This tool goes beyond a simple VWAP line; it is a complete analytical ecosystem designed to identify trend bias, measure market deviation, and provide high-probability entry and exit signals with precision timing. Whether you are a day trader, scalper, or swing trader, this su

Spread & Broker Server Analytics Advanced Suite Glass 3D effect for MetaTrader 5 ( Dashboard & compact dashboard)
Master the fundamental mechanism of market liquidity with the Spread Analytics Advanced Suite, a professional-grade monitoring and alert tool built exclusively for MetaTrader 5. In modern trading, the Bid-Ask spread is your primary transaction cost. This suite provides the transparency and precision required to manage these costs effectively, ensuring you trade only when conditio

Moment Analytics: Confluence Dashboard Advanced Suite for MetaTrader 5
Gain an unparalleled edge in market timing and trend confirmation with the Moment Analytics Confluence Dashboard , a professional-grade analytical suite built exclusively for MetaTrader 5. This tool consolidates nine of the most powerful momentum and volatility indicators into a single, cohesive on-chart HUD (Heads-Up Display), eliminating chart clutter and providing instant, at-a-glance confluence signals. Whether you ar

Price Alerts Advanced Suite for MetaTrader 5
Take control of your trading execution with the Price Alerts Advanced Suite , a professional-grade technical analysis tool built exclusively for MetaTrader 5. This suite goes far beyond simple horizontal lines; it is a complete analytical ecosystem designed to identify key market levels, monitor price action in real-time, and deliver instant notifications across multiple channels. Whether you are a day trader, swing trader, or algorithmic develope

Bollinger Trend Signals MT5 - 볼린저 밴드를 기반으로 하는 추세 지표입니다. 모든 신호는 재표시나 지연 없이 생성됩니다. 방향성 추세 채널과 잠재적인 진입 및 청산 지점을 식별합니다.
지표 작동 방식
이 지표는 추세 채널과 고가 및 저가 결정 시스템을 결합하여 작동합니다.
파란색 선은 주요 평활 추세선입니다. 이 선이 가격 위에 있으면 추세 채널은 하락 추세이고, 가격 아래에 있으면 상승 추세입니다.
주황색 화살표는 하락 추세 신호를 나타내고, 연한 파란색 화살표는 상승 추세 신호를 나타냅니다.
상승 추세에서 주황색 점은 고점에서의 손절매를 나타내는 청산 옵션입니다. 연한 파란색 점은 상승 추세의 재개를 나타내며, 재진입 또는 포지션 추가에 사용됩니다.
하락 추세에서 연한 파란색 점은 저점에서의 손절매를 나타내는 청산 옵션입니다. 주황색 점은 재진입 또는 포지션 추가에 사용됩니다.
이 지표는 M1부터 H4까지의 시간 프레임에서 사용을 권장합니다.

표준 지표들을 조합하여 복잡한 시스템을 구축하고 차트 이력에 적용하여 즉시 백테스팅하는 지표입니다. 9개의 시간 프레임에 걸쳐 16개의 지표로 구성된 매트릭스를 제공하며, 각 셀을 클릭하면 원하는 기간에 대한 조합에 지표가 추가됩니다. 조합 구성원들은 투표를 통해 최적의 조합을 결정하고, 설정된 투표 임계값에 따라 신호를 생성합니다. 조합 구성이 변경될 때마다 결과, 거래 횟수, 수익률, 수익률, 기대값, 최대 손실률 등의 통계가 자동으로 계산됩니다. 유전 알고리즘 최적화 도구가 최적의 조합을 자동으로 선택하며, 완성된 시스템은 키로 저장되어 원하는 차트에 적용할 수 있습니다.
( 사용자 설명서 )
지표 선택, 투표 임계값, 청산 규칙은 트레이더가 직접 설정할 수 있으며, 셀 계산, 백테스팅, 조합 검색은 지표가 자동으로 처리합니다.
주요 기능
이 지표는 세 가지 모드로 작동합니다. Matrix Lab은 매트릭스, 통계, 최적화 기능을 모두 제공하는 종합적인 분석 도구입니다

MTF LRMA Plus: Multi-Timeframe Trading Decision System Linear Regression Moving Average with ADX Trend Strength Analysis Across 6 Timeframes Product Overview MTF LRMA Plus is a professional-grade trading indicator that combines Linear Regression Moving Average (LRMA) trend analysis with ADX (Average Directional Index) trend strength measurement across 6 key timeframes (D1, H4, H1, M30, M15, M5). It delivers actionable insights through an intuitive visual dashboard, helping traders identify h

GOLDEN CROSS V1.0 - Moving Average Crossover Indicator with Quality Score General Description The GOLDEN CROSS is an advanced technical indicator developed for MetaTrader 5 that combines moving average crossovers with a quality scoring system based on multiple technical filters. It is designed to identify high-probability entry points, offering traders interactive visual tools and comprehensive risk management features. Indicator Structure and Logic 1. Crossover System Fas

KITO Opportunity ATLAS
MARKET OPPORTUNITY INTELLIGENCE FOR MT5 The market rarely suffers from a shortage of signals. The real challenge is knowing which opportunities deserve your attention—and which ones deserve to be ignored. Kito Atlas transforms your MetaTrader 5 terminal into a multi-market opportunity command centre. From one compact dashboard, it scans multiple symbols and timeframes, compares several forms of market evidence, ranks the strongest opportunities and opens a structured price

This custom algorithmic indicator is a zero-lag, non-repainting trading tool engineered for precision entries. By fusing a proprietary combination of momentum and structural metrics behind the scenes, it identifies immediate market exhaustion points without relying on delayed data. Because it calculates and locks its logic the exact millisecond a bar closes, signals will never shift, lag, or repaint after the fact.
Execution & Trade Management:
The One-Candle Rule: The primary execution strate

QQE Signal – 정성적·정량적 추정(QQE) 지표
QQE Signal 은 MetaTrader 5용 오실레이터 기반 기술 지표로, 평활화된 RSI와 동적으로 계산되는 QQE 라인을 사용하여 잠재적인 추세 변화와 시장 모멘텀 변화를 분석할 수 있도록 설계되었습니다. 파란색 RSI 기반 신호선 과 검은색 점선 QQE 라인 의 관계를 명확하게 보여주며, 중요한 50 레벨 을 핵심 기준으로 사용합니다. 주요 기능 QQE 신호선 파란색 라인은 평활화된 RSI 값을 나타냅니다. 라인의 움직임을 통해 시장 모멘텀의 변화와 가격 방향 전환 가능성을 분석할 수 있습니다. 평활화 QQE 라인 검은색 점선은 파란색 신호선에 대한 동적 기준선 역할을 합니다. 두 라인의 교차는 시장 모멘텀 변화를 파악하는 데 사용할 수 있습니다. 〰️ 50 레벨 50 레벨은 오실레이터의 핵심 기준점입니다. 50 이상 → 상승 모멘텀 50 이하 → 하락 모멘텀 매수 신호 잠재적인 BUY(매수) 신호 는

MA Flow No.2 See the Flow of Bulls & Bears at a Glance, and Keep the Rhythm of the Market in Your Hands
Tired of staring at dozens of moving averages until your eyes blur? Unsure when to enter, or where to place your stop? MA Flow No.2 upgrades the humble moving average into a complete trend-trading system. No more scattered lines on your chart — instead, a living "river of bulls and bears". Up to 100 moving averages roll together in real time. On every single bar, you can see at a glance w

Volume Footprint는 MetaTrader 5용 가격대별 오더플로우 지표입니다. 하나의 캔들만 표시하는 대신 각 바를 개별 가격 행으로 분해하여 해당 가격대에서 체결된 매수(bid)·매도(ask) 거래량을 보여줍니다. 즉 가격이 어디서 마감했는지뿐 아니라, 바 내부에서 매수자와 매도자가 정확히 어디에서 거래했는지 볼 수 있습니다. 이 지표는 차트의 틱 데이터를 더 낮은 타임프레임(차트 기간에 따라 자동 선택되거나 수동 고정)에서 집계하고, MetaTrader 자체의 가격·거래량 데이터를 이용해 각 틱을 bid 측 또는 ask 측으로 분류합니다. 오더플로우 툴킷 Point of Control (POC) — 바 내에서 가장 많은 거래량이 발생한 가격으로, 전용 행으로 표시됩니다. Value Area — 바의 전체 거래량 중 지정 비율(기본값 70%)을 포함하는 설정 가능한 가격대입니다. Stacked Imbalance — 한쪽이 지정 비율로 연속해서 우세한 가격 행을 표시합니다

Sultan of Swing Sultan of Swing is a clean and reliable swing-based signal indicator designed for traders who want clear entries without confusion or lag. The indicator detects price swings and delivers signals only at the open of a new bar. sometimes mid-bar signals but no repainting, and no unnecessary noise. Key Features Non-repainting – Signals stay fixed always. New bar signals only – Alerts appear at the start of the candle, sometimes in the Middle. Price swing logic – Built purely on mar

DaySwingPro Institutional — Multi-Factor Day & Swing Trading Engine Confluence-based BUY/SELL signals with institutional risk management, Smart Money Concepts and a live HUD — engineered with a strict zero-repaint architecture. What is it for? DaySwingPro Institutional is built for day and swing traders who hold positions from one day to several weeks (recommended timeframes: H1, H4, D1 ). Instead of firing arrows on every minor fluctuation, it waits for the trend, momentum and mark

화살표는 사라고만 말합니다. Obsidian Scalper Pro는 어디서 사는지, 손절이 어디로 가는지, 세 개의 목표가 어디인지, 당신의 리스크에 맞는 포지션 크기가 얼마인지, 그리고 그 셋업이 100점 만점에 몇 점인지까지 말합니다. 모든 시그널은 차트에 그려진 완성된 매매 플랜으로 도착하고, 내장된 통계 창이 최근 백 개의 정직한 결과를 신뢰구간이 붙은 승률까지 포함해 보여줍니다. 모든 결정은 마감된 봉에서 내려지므로, 지금 보고 있는 히스토리가 곧 당신이 실제로 거래했을 히스토리입니다. 이 지표는 금(XAUUSD) M30에서 가장 좋은 성능을 보이며, 다른 어떤 심볼과 타임프레임에서도 사용할 수 있습니다. 이 지표에 맞는 전략이 필요하신가요? 구매 후 MQL5에서 메시지를 보내주시면 보내드리겠습니다. 무엇을 하는가 Obsidian Scalper Pro는 확립된 추세 안의 되돌림 진입을 찾아 각각에 대해 완성된 플랜을 건네줍니다. Entry, SL, TP1, TP2와 선택형

유동성 풀은 아직 회수되지 않은 확정된 스윙 고점 또는 스윙 저점입니다. 유동성 스윕은 가격이 그 레벨을 넘어 거래된 후 다시 범위 안으로 종가를 형성하는 바로 그 봉입니다 - 트레이더들이 스톱 헌트, 스톱 런, 유동성 그랩 또는 거짓 돌파라고도 부르는 동일한 이벤트입니다. Liquidity Sweep Pools MTF는 현재 차트와 선택한 상위 타임프레임에서 풀과 그 풀에서 발생한 유동성 스윕을 모두 표시하며, 활성 풀의 실시간 패널, 풀 형성 시의 거래량 필터, 감지된 스윕의 CSV 내보내기를 추가합니다. 여기서 다중 타임프레임 확인이란 각 유동성 스윕을 눈앞의 차트를 떠나지 않고 상위 타임프레임의 풀과 대조하여 읽을 수 있다는 뜻이며, 두 레벨 세트가 각자의 색으로 나란히 그려집니다. 표시하는 것 한 가지, 정확히: 풀의 기하학입니다. 그리는 모든 풀은 가격 레벨, 방향, 거리, 나이를 가지며, 동일한 네 가지 값이 패널과 CSV 파일에 들어갑니다. 그것이 전체 어휘입니다. 그

Supply and Demand + Market Structure Smart Money order block detection, volume-weighted confirmation, and full BOS/CHoCH market structure Check out Rudy Bank for more features: https: // www.mql5.com/en/market/product/193059 Check out Iron Entry for zone entry confirmations: https: // www.mql5.com/en/market/product/193937
Overview
SupplyDemand Edge finds and draws institutional supply and demand order blocks directly on your chart, then backs every one of them up with real market data — volume

See the Market From the Higher-Timeframe Perspective. Ashinton MTF-Trend Pro is a professional multi-timeframe trend analysis indicator for MetaTrader 5, designed to help traders quickly identify directional alignment across Monthly (MN1), Weekly (W1), Daily (D1), and H4 timeframes.
Instead of analyzing each timeframe manually, MTF-Trend Pro brings the bigger market picture into one clean, intuitive dashboard, helping you determine whether the higher timeframes are aligned, conflicted, or deve

ElliottWave Pro — Automatic Wave 2 Detection and Wave 3 Targets An indicator for MetaTrader 5 that automates Elliott Wave and Fibonacci analysis. ElliottWave Pro detects the end of the first impulse (Wave 1), calculates the corrective zone (Wave 2) and draws a ready-to-use trading setup with Stop Loss and Take Profit levels. Key Features Automatic Wave 1 detection: connects points P0 and P1 to show the trend structure. Wave 2 entry zone: a rectangular retracement zone with Fibonacci levels 38.2%

SMC Sentinel — Smart Money Concepts 지표 시장 구조와 함께 트레이딩하고, 시장을 다르게 바라보세요. SMC Sentinel은 MetaTrader 5를 위한 고급 Smart Money Concepts(SMC) 분석 지표 로, 여러 가격 행동 분석 개념을 하나의 깔끔하고 사용자 설정이 가능한 차트 분석 시스템으로 통합합니다. 단일 신호에만 의존하는 대신 SMC Sentinel은 시장 구조, 유동성, 가격 불균형, 기관 영역, 되돌림 구간 및 추세 컨텍스트를 분석하여 트레이더가 가격이 어디에서 왔는지, 무엇에 반응하고 있는지, 그리고 어디에서 잠재적인 셋업이 형성되고 있는지 이해할 수 있도록 도와줍니다. 주요 기능 시장 구조 MT5 차트에서 중요한 구조적 움직임을 직접 확인할 수 있습니다. Swing Highs & Swing Lows BOS — Break of Structure CHoCH — Change of Character 주요 구조 필터링 설정

Trend Market — Smart Money Concepts (SMC) Indicator with Order Blocks, FVG & Auto TP System Trend Market is a complete Smart Money Concepts toolkit built to help you read institutional price behavior with clarity — market structure, liquidity zones, and precise risk-based profit targets, all in one indicator. The Strategy This indicator is built around real Smart Money Concepts (SMC) trading logic: Market Structure Detection (BOS / CHoCH) — Using fractal-based swing analysis, the indicator auto
트레이딩 전략과 기술 지표를 판매하기에 가장 좋은 장소가 왜 MetaTrader 마켓인지 알고 계십니까? 광고나 소프트웨어 보호가 필요 없고, 지불 문제도 없습니다. 모든 것이 MetaTrader 마켓에서 제공됩니다.
