 MetaTrader 5
 Experts
 Indicatori
 librerie
 Utilità
 Widget
 Regole
Guarda i video tutorial del Market su YouTube
Come acquistare un Robot di Trading o un indicatore
Esegui il tuo EA
hosting virtuale
hosting virtuale
Prova un indicatore/robot di trading prima di acquistarlo
Vuoi guadagnare nel Market?
Come presentare un prodotto per venderlo con successo
Indicatori tecnici per MetaTrader 5 - 214
 I segnali degli indicatori tecnici giocano un ruolo cruciale nell'apertura e nella chiusura delle transazioni sui mercati azionari e Forex. L'essenza degli indicatori è una trasformazione matematica del prezzo di un simbolo finanziario, finalizzata alla previsione dei cambiamenti futuri dei prezzi. Prova gli indicatori tecnici, per prevedere al meglio il comportamento del mercato e ricavarne dei guadagni.

# Reversal Probability Gauge - Frequenza storica per analogia
*Categoria: Oscillatori | Difficolta: avanzato | Finestra: finestra separata sotto il grafico | Mercati: Universale (Forex, indici, materie prime, crypto, azioni) | Timeframe consigliati: M30, H1, H4, D1*
## Descrizione breve
> Cerca nello storico le barre con uno stato simile a quello corrente e conta in quale percentuale di quei casi il prezzo si e poi mosso in direzione opposta. E una frequenza osservata, non una previsione.
#

is a versatile analytical tool designed for both advanced traders and beginners. It combines classic trend line analysis with automatic Fibonacci level plotting to deliver precise market entries and structural clarity. Built as an intuitive and clean on-screen dashboard, this indicator simplifies multi-timeframe analysis without cluttering your main workspace. Technical Analysis and Entry Points The indicator automates the most critical aspects of price action and structural trading: Trend L
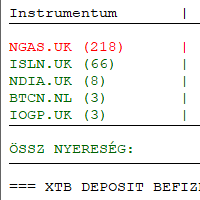
Introducing my indicator in Meta Trader 5. XTB export analysis and charting and export of currency conversion to csv for tax return. This indicator is an independent development and has no official connection with XTB S.A. https://youtu.be/z9JVhqKdKns
Hungary: Meta Trader 5 ben indikátorom bemutatása. XTB export elemzése és chartra kiíratása és adóbevalláshoz deviza konverzió csv.-be exportálása. Ez az indikátor egy független fejlesztés, és semmilyen hivatalos kapcsolatban nem áll az XTB S.A. v

QUANTUM OCEAN SIGNALS MT5
Quantum Ocean Signals MT5 is a multi-filter decision-support indicator for MetaTrader 5. It evaluates trend direction, momentum, directional strength, volatility and candle confirmation to display structured BUY and SELL setups after a candle has closed.
The indicator does not open or manage trades. It gives manual traders a clear trade plan consisting of a signal, an adaptive Stop Loss and three optional Take Profit reference levels.
MAIN FEATURES
• Closed-candle

Level Alert Utility is an essential workflow tool for MetaTrader 5 designed to eliminate constant screen fatigue. Effortlessly drag the interactive level line directly on your chart—the indicator instantly configures trigger rules and delivers real-time notifications via customizable sound repeats, popup alerts, mobile Push notifications, and email. Equipped with high-speed millisecond monitoring, gap and impulse protection, quick-action chart buttons, hotkey support, and state persistence acros

SMC SYNTHRIDERS — Smart Money, Liquidity and Market Phase Trading Indicator SMC SYNTHRIDERS is a MetaTrader 5 market-analysis and signal indicator developed by MohSOLUTIONS . It is designed for traders who analyse price through market structure, liquidity behaviour, Smart Money Concepts, multi-timeframe context and market phases . Rather than generating signals from a single condition, SMC SYNTHRIDERS combines multiple layers of market information to identify conditions where a structured tradin

MACandleApproxPro — Advanced MA Candle Reconstruction & Multi-Dimensional Market Structure Indicator Overview MACandleApproxPro is a comprehensive technical analysis tool designed for professional traders. It breaks through the limitations of traditional moving averages by reconstructing MA data into "MA Candles" through complex algorithms. This unique visualization filters out market noise, allowing you to examine price trends, momentum shifts, and critical market structures from a more

# Level Strength Ranker - Solo i due livelli che contano
*Categoria: Supporti e Resistenze | Difficolta: intermedio | Finestra: finestra del grafico (sovrapposto ai prezzi) | Mercati: Universale (Forex, indici, materie prime, crypto, azioni) | Timeframe consigliati: M30, H1, H4, D1*
## Descrizione breve
> Assegna a ogni livello un punteggio basato su numero di tocchi, ampiezza delle reazioni e attualita, e disegna solo il piu forte sopra e sotto il prezzo.
## Descrizione lunga
### Panorami

# Round Number Magnet - I numeri tondi contano davvero?
*Categoria: Supporti e Resistenze | Difficolta: base | Finestra: finestra del grafico (sovrapposto ai prezzi) | Mercati: Universale (Forex, indici, materie prime, crypto, azioni) | Timeframe consigliati: M15, M30, H1, H4, D1*
## Descrizione breve
> Disegna i livelli tondi calcolandone automaticamente il passo e misura quanto il prezzo reagisca davvero a quei livelli su questo specifico strumento.
## Descrizione lunga
### Panoramica
I

# Break Retest Detector - La sequenza completa, non solo la rottura
*Categoria: Supporti e Resistenze | Difficolta: intermedio | Finestra: finestra del grafico (sovrapposto ai prezzi) | Mercati: Universale (Forex, indici, materie prime, crypto, azioni) | Timeframe consigliati: M15, M30, H1, H4, D1*
## Descrizione breve
> Riconosce la sequenza completa di rottura, ritorno sul livello e reazione. Segnala solo quando tutte e tre le condizioni si verificano nell'ordine corretto.
## Descrizione

Multi-Symbol MTF Scanner
Individui il setup nell'istante esatto in cui il pattern si completa Multi-Symbol MTF Scanner osserva tutta la Sua watchlist su molti timeframe contemporaneamente e segnala l'esatto momento in cui un mercato completa un setup di swing multi-stadio. È pensato per i trader che seguono una routine multi-timeframe e multi-simbolo e non vogliono scorrere decine di grafici per trovare l'unico setup pronto. L'intero setup viene calcolato nativamente all'interno dello strumento,

# Dynamic Pivot Zones - Pivot come zone, non come linee
*Categoria: Supporti e Resistenze | Difficolta: base | Finestra: finestra del grafico (sovrapposto ai prezzi) | Mercati: Universale (Forex, indici, materie prime, crypto, azioni) | Timeframe consigliati: M5, M15, M30, H1*
## Descrizione breve
> Trasforma i pivot in zone la cui ampiezza dipende dalla volatilita del periodo precedente. I livelli restano fissi per tutta la sessione, senza ricalcoli.
## Descrizione lunga
### Panoramica
I

# Supply Demand Zone Mapper - Base compressa e partenza decisa
*Categoria: Supporti e Resistenze | Difficolta: intermedio | Finestra: finestra del grafico (sovrapposto ai prezzi) | Mercati: Universale (Forex, indici, materie prime, crypto, azioni) | Timeframe consigliati: M15, M30, H1, H4, D1*
## Descrizione breve
> Riconosce le basi di consolidamento seguite da un movimento deciso e le disegna come zone, che restano finche il prezzo non le attraversa completamente.
## Descrizione lunga
##

# Untested Level Finder - I livelli ancora intatti
*Categoria: Supporti e Resistenze | Difficolta: base | Finestra: finestra del grafico (sovrapposto ai prezzi) | Mercati: Universale (Forex, indici, materie prime, crypto, azioni) | Timeframe consigliati: M15, M30, H1, H4, D1*
## Descrizione breve
> Traccia solo i livelli di swing che il prezzo non ha mai ritestato dalla loro formazione. Un livello smette di essere disegnato nel momento in cui viene testato.
## Descrizione lunga
### Panoram

# Confluence Score Map - Dove convergono piu riferimenti
*Categoria: Supporti e Resistenze | Difficolta: avanzato | Finestra: finestra del grafico (sovrapposto ai prezzi) | Mercati: Universale (Forex, indici, materie prime, crypto, azioni) | Timeframe consigliati: M30, H1, H4, D1*
## Descrizione breve
> Calcola quattro famiglie di livelli indipendenti e disegna solo le fasce di prezzo dove almeno il numero minimo richiesto di riferimenti converge.
## Descrizione lunga
### Panoramica
Un li

# False Breakout Filter - La rottura fallita come segnale
*Categoria: Supporti e Resistenze | Difficolta: intermedio | Finestra: finestra del grafico (sovrapposto ai prezzi) | Mercati: Universale (Forex, indici, materie prime, crypto, azioni) | Timeframe consigliati: M15, M30, H1, H4, D1*
## Descrizione breve
> Osserva ogni rottura per un numero fisso di barre e la classifica solo dopo. Una rottura fallita produce una freccia nella direzione opposta, perche e essa stessa un segnale.
## Desc

# Range Boundary Tracker - Bordi che non seguono il prezzo
*Categoria: Supporti e Resistenze | Difficolta: intermedio | Finestra: finestra del grafico (sovrapposto ai prezzi) | Mercati: Universale (Forex, indici, materie prime, crypto, azioni) | Timeframe consigliati: M15, M30, H1, H4, D1*
## Descrizione breve
> Riconosce quando il mercato entra in un range, ne fissa i due estremi e li mantiene immobili finche il range regge, come li disegnerebbe un trader.
## Descrizione lunga
### Panoram

# Level Decay Model - Un livello che si consuma
*Categoria: Supporti e Resistenze | Difficolta: avanzato | Finestra: finestra del grafico (sovrapposto ai prezzi) | Mercati: Universale (Forex, indici, materie prime, crypto, azioni) | Timeframe consigliati: M30, H1, H4, D1*
## Descrizione breve
> Assegna a ogni livello una forza che decade nel tempo e a ogni test subito. Il livello viene abbandonato quando la forza residua scende sotto la soglia.
## Descrizione lunga
### Panoramica
Un livel

Indicatore Crypto_Forex "Hanging Man e Inverted Hammer" per MT5, senza ricalcolo e senza ritardo. - L'indicatore "Hanging Man e Inverted Hammer" è un indicatore molto potente per il trading basato sulla Price Action. - L'indicatore rileva i pattern Inverted Hammer rialzisti e Hanging Man ribassisti sul grafico: - Inverted Hammer rialzista: segnale con freccia blu sul grafico (vedi immagini). - Hanging Man ribassista: segnale con freccia rossa sul grafico (vedi immagini). - Con avvisi per PC e n

Makito AD is a volume-based market analysis indicator designed to identify market trends and changes in market direction by analyzing the relationship between price action and volume . The indicator uses a dynamic line that changes color based on the current market condition , making it easier to visually identify whether market pressure is becoming bullish, bearish, or showing potential divergence. Key Features Volume-Based Analysis — Uses volume and price action to assess market direction. Dyn

Probability Cone MT5 — Statistical Price Projection Indicator Probability Cone MT5 is a technical analysis tool that projects statistically grounded price ranges forward on the chart. Using a log-normal volatility model — the same mathematical approach behind option pricing and quantitative risk tools — the indicator calculates where price is statistically likely to travel over a chosen time horizon. Statistical Price Projection Instead of eyeballing support, resistance, or a breakout target, Pr

Footprint Visual Order flow footprint chart, drawn directly in the main window, sharing the real price scale of your candles. Short description (for the Market listing) Footprint Visual draws a real bid/ask footprint — buy and sell volume per price level, POC, Value Area and net delta — for each of the most recent bars, right next to your candles. Built on genuine volume_real tick data (not tick-count approximations), it works on any symbol whose broker feed reports real trade volume, and is tun

Segna il range massimo/minimo di una sessione personalizzabile e genera segnali di acquisto/vendita alla rottura con ombra, filtrati da un Supertrend adattivo integrato, con conferma opzionale su timeframe superiore e ADX, oltre a linee guida TP/SL automatiche. Caratteristiche principali Box del range di sessione — traccia e disegna automaticamente il massimo/minimo di qualsiasi sessione personalizzata (i vostri orari SAST, la sessione asiatica o l'apertura di Londra), aggiornato in tempo reale

Stop Watching Key Price Levels. Get Alerted. Horizontal Line Alert automatically monitors a price level and alerts you when price closes above, closes below, or touches the line . Go beyond a basic horizontal-line alert with candle confirmation, candle-size filtering, and price-action conditions . KEY FEATURES Close Above
Detect qualifying bullish candles closing above your horizontal level. Close Below
Detect qualifying bearish candles closing below your level. Close Above / Bel

How it works The indicator calculates VWAP (Volume Weighted Average Price) — the average price weighted by traded volume, widely used by institutional traders as the intraday "fair price" benchmark. Unlike a regular moving average, VWAP gives more weight to periods with higher volume, showing where most of the money was actually traded. The product combines three ways of calculating this average in a single indicator, so there is no need to install separate tools: Daily: the sum resets every da

Stop guessing where a pullback ends. Most traders can spot a trend. The hard part is the entry — buying too early into a falling knife, or chasing after the move has already gone. Fibonacci Trend Compass solves exactly that one problem, and it does it on autopilot. Three steps, fully automatic: It reads the trend. An adaptive ATR trend engine paints the chart green or red and tells you which side of the market you are allowed to trade. It maps the impulse leg. Confirmed swing highs and lows

Kiwi Smart Trend System MT5 is a multi-feature trend and signal indicator for MetaTrader 5. The indicator combines trend direction, momentum, volatility, volume and multi-timeframe analysis in one clear chart system. It is designed to help traders identify market direction, evaluate signal conditions and plan potential entries with configurable risk-to-reward zones. Kiwi Smart Trend System is an analytical indicator. It does not open, modify or close trades. MAIN FEATURES Bullish and bearish tre

Iron Entry — Real-Time Signal Engine with Trend Filter & Momentum Candles Why You Should Choose This Indicator
Most signal tools redraw their arrows after the fact, by the time you notice a "signal," it's already changed or vanished. Iron Entry doesn't do that.
This indicator locks in its pivots and signals the moment they close, and once printed, they never move, disappear, or repaint. What you see live is exactly what stays on your chart tomorrow, next week, and next year. That means you c

# Candle Body Anatomy - Le proporzioni della candela in numeri
*Categoria: Riconoscimento Pattern | Difficolta: base | Finestra: finestra separata sotto il grafico | Mercati: Universale (Forex, indici, materie prime, crypto, azioni) | Timeframe consigliati: M15, M30, H1, H4, D1*
## Descrizione breve
> Scompone ogni candela in corpo e ombre espressi in percentuale del range e la classifica su soglie numeriche esplicite, invece che su giudizio qualitativo.
## Descrizione lunga
### Panoramica

# Engulfing Quality Score - Non tutti gli inglobamenti valgono uguale
*Categoria: Riconoscimento Pattern | Difficolta: intermedio | Finestra: finestra del grafico (sovrapposto ai prezzi) | Mercati: Universale (Forex, indici, materie prime, crypto, azioni) | Timeframe consigliati: M15, M30, H1, H4, D1*
## Descrizione breve
> Verifica il pattern di inglobamento e gli assegna un punteggio su quattro criteri aggiuntivi, segnalando solo quelli che superano la soglia di qualita.
## Descrizione lu

# Inside Bar Breakout Map - Compressione e livelli pronti
*Categoria: Riconoscimento Pattern | Difficolta: base | Finestra: finestra del grafico (sovrapposto ai prezzi) | Mercati: Universale (Forex, indici, materie prime, crypto, azioni) | Timeframe consigliati: M15, M30, H1, H4, D1*
## Descrizione breve
> Conta le barre interne consecutive e disegna i due livelli di rottura della barra madre, mantenendoli fissi finche il pattern e attivo.
## Descrizione lunga
### Panoramica
Una barra int

# Pin Bar Rejection Scanner - Il rifiuto che avviene dove conta
*Categoria: Riconoscimento Pattern | Difficolta: intermedio | Finestra: finestra del grafico (sovrapposto ai prezzi) | Mercati: Universale (Forex, indici, materie prime, crypto, azioni) | Timeframe consigliati: M15, M30, H1, H4, D1*
## Descrizione breve
> Riconosce le barre con ombra dominante ma le segnala solo quando sono significative in termini assoluti e avvengono su un estremo recente.
## Descrizione lunga
### Panoramica

# Three Bar Structure Map - Geometria senza soglie
*Categoria: Riconoscimento Pattern | Difficolta: base | Finestra: finestra separata sotto il grafico | Mercati: Universale (Forex, indici, materie prime, crypto, azioni) | Timeframe consigliati: M15, M30, H1, H4, D1*
## Descrizione breve
> Classifica ogni terna di barre in quattro configurazioni geometriche, senza usare alcuna soglia arbitraria: due barre o si superano o non si superano.
## Descrizione lunga
### Panoramica
Ogni terna di b
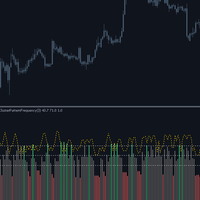
# Cluster Pattern Frequency - Otto sequenze e le loro statistiche
*Categoria: Riconoscimento Pattern | Difficolta: avanzato | Finestra: finestra separata sotto il grafico | Mercati: Universale (Forex, indici, materie prime, crypto, azioni) | Timeframe consigliati: M30, H1, H4, D1*
## Descrizione breve
> Codifica ogni sequenza di tre barre in una delle otto configurazioni possibili e misura la frequenza storica con cui e stata seguita da un movimento al rialzo.
## Descrizione lunga
### Pano

Level Reaction traccia i livelli di supporto e resistenza dal timeframe superiore e segna due tipi di reazione del prezzo ad essi: una continuazione di breakout e un'inversione al livello. Funziona su qualsiasi simbolo e timeframe disponibile nel tuo terminale. Come vengono costruiti i livelli All'inizio di ogni barra del timeframe superiore, l'indicatore prende il massimo, il minimo e la chiusura della barra precedente e ricava cinque livelli di resistenza e cinque livelli di supporto attorno a

# Momentum Thrust Pattern - Spinta, pausa, ripartenza
*Categoria: Riconoscimento Pattern | Difficolta: intermedio | Finestra: finestra del grafico (sovrapposto ai prezzi) | Mercati: Universale (Forex, indici, materie prime, crypto, azioni) | Timeframe consigliati: M15, M30, H1, H4, D1*
## Descrizione breve
> Riconosce la sequenza spinta, pausa contenuta e ripartenza oltre l'estremo, segnalando solo quando tutte e tre le fasi si sono completate.
## Descrizione lunga
### Panoramica
I movime

# Higher Timeframe Bias - Il timeframe superiore senza inganni
*Categoria: Ibridi Multi Timeframe | Difficolta: intermedio | Finestra: finestra separata sotto il grafico | Mercati: Universale (Forex, indici, materie prime, crypto, azioni) | Timeframe consigliati: M5, M15, M30, H1, H4*
## Descrizione breve
> Porta sul grafico corrente la direzione di un timeframe superiore usando esclusivamente barre gia chiuse, evitando la forma piu subdola di repaint.
## Descrizione lunga
### Panoramica

This draws fewer zones than the free order block indicators do. That's the whole point, and it's worth saying before you look at a screenshot and decide something is broken. On the gold chart I grabbed while writing this, the engine found 54 points of interest and marked 2 as tradeable. The other 52 sit on the chart only if you ask for them, greyed out and labelled what the material calls them: traps. Why it draws less than everything else Every order block tool I've used marks every block. Scro

An indicator that marks support and resistance areas by counting how many separate times price has returned to them. Every counted return is marked on the chart, so the count can be checked against the chart history.
What it draws Elektra Look Left draws two zones. One below price, for buys. One above price, for sells. Nothing else is added to the chart. Each zone is drawn as a rectangle rather than a single line. The height of the rectangle is the measured spread of the swings that formed

Introducing my indicator in Meta Trader 5. Trading212 export analysis and charting and exporting to csv. This indicator is an independent development and has no official connection with Trading212 (Trading 212 Markets Ltd.). https://www.youtube.com/watch?v=_hzdqUJgwo4
Hungary: Meta Trader 5 ben indikátorom bemutatása. Trading212 export elemzése és chartra kiíratása és csv.-be exportálása. Ez az indikátor egy független fejlesztés, és semmilyen hivatalos kapcsolatban nem áll a Trading212 vállalat

Trendline MachineGun MT5 Trendline automatiche. Classificazione intelligente della forza. Struttura di mercato chiara. Trendline MachineGun MT5 è un indicatore professionale progettato per rilevare, analizzare e classificare automaticamente le trendline di supporto e resistenza. L’indicatore analizza gli swing high e gli swing low confermati, genera più trendline rilevanti e assegna a ciascuna un punteggio di forza compreso tra 0 e 100. In questo modo è possibile individuare rapidamente le strut
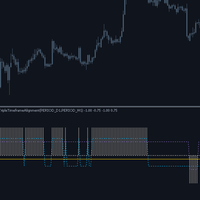
# Triple Timeframe Alignment - Tre orizzonti, un punteggio
*Categoria: Ibridi Multi Timeframe | Difficolta: intermedio | Finestra: finestra separata sotto il grafico | Mercati: Universale (Forex, indici, materie prime, crypto, azioni) | Timeframe consigliati: M5, M15, M30, H1, H4*
## Descrizione breve
> Verifica se corrente, intermedio e superiore siano orientati nella stessa direzione, mostrando sia il punteggio complessivo sia la direzione di ciascun orizzonte.
## Descrizione lunga
### P

# HTF Level Projector - I livelli che tutti guardano
*Categoria: Ibridi Multi Timeframe | Difficolta: base | Finestra: finestra del grafico (sovrapposto ai prezzi) | Mercati: Universale (Forex, indici, materie prime, crypto, azioni) | Timeframe consigliati: M5, M15, M30, H1, H4*
## Descrizione breve
> Proietta sul grafico corrente massimo, minimo e chiusura dell'ultimo periodo superiore completo, aggiornandoli solo a periodo chiuso.
## Descrizione lunga
### Panoramica
Il massimo e il mini

# Timeframe Divergence Monitor - Quando gli orizzonti litigano
*Categoria: Ibridi Multi Timeframe | Difficolta: intermedio | Finestra: finestra separata sotto il grafico | Mercati: Universale (Forex, indici, materie prime, crypto, azioni) | Timeframe consigliati: M5, M15, M30, H1, H4*
## Descrizione breve
> Misura il disaccordo di momentum fra timeframe corrente e superiore, evidenziando le fasi in cui i due orizzonti si muovono in direzioni opposte.
## Descrizione lunga
### Panoramica
Qu

# Volume Support Resistance Map - Supporti e resistenze disegnati dal volume
*Categoria: Sperimentali | Difficolta: intermedio | Finestra: finestra del grafico (sovrapposto ai prezzi) | Mercati: Universale (Forex, indici, materie prime, crypto, azioni) | Timeframe consigliati: M15, M30, H1, H4, D1*
## Descrizione breve
> Barre orizzontali disegnate sul grafico, lunghe in proporzione al volume scambiato a ogni livello: sopra il prezzo il volume in vendita che segna le resistenze, sotto quello

Here is the description translated and optimized for the MQL5 Market : Candle Timer Jason – Candle Countdown Indicator (MT5) Candle Timer Jason is a lightweight, high-performance utility developed for MetaTrader 5. It is designed for Forex, Stock, and Crypto traders who need to monitor the exact remaining time before the current candle closes. Knowing precisely how many minutes and seconds are left in a bar is essential for execution timing, helping you avoid premature entries or getting caught

️ Candle Timer Advanced Suite Glass 3D effect for MetaTrader 5
Gain the ultimate edge in precision timing with the Candle Timer Advanced Suite. This is not just a simple countdown; it is a professional-grade analytical tool designed to keep you perfectly synchronized with the market, ensuring you never miss a critical entry or exit due to server lag or misinterpretation. Built specifically for MetaTrader 5, this suite offers unparalleled flexibility, allowing you to visualize time exactly how

Cross Over Trend – Indicatore di Incrocio EMA/SMA Cross Over Trend è un indicatore tecnico semplice ed efficace per MetaTrader 5 che visualizza il rapporto tra una Media Mobile Esponenziale (EMA) e una Media Mobile Semplice (SMA) . L'indicatore facilita l'identificazione della direzione attuale del trend, suddividendo automaticamente le fasi di mercato in trend rialzista (UpTrend) e trend ribassista (DownTrend) sulla base del rapporto tra EMA e SMA. Funzionamento L'indicatore confronta i valori
Indicatore di Deviazione VWAP (VWAP Deviation Indicator) L’ Indicatore di Deviazione VWAP è uno strumento di analisi dei prezzi basato sul volume, progettato per identificare la relazione tra il prezzo attuale, una base VWAP calcolata dinamicamente e i relativi livelli di deviazione. A differenza di una semplice media mobile, questo indicatore utilizza una ponderazione basata sul volume dei tick , dando maggiore importanza, nel calcolo del VWAP, ai livelli di prezzo associati a una maggiore atti

VWAP Analytics Advanced Suite for MetaTrader 5
Gain institutional-grade market insight with the VWAP Analytics Advanced Suite , a professional Volume Weighted Average Price indicator built exclusively for MetaTrader 5. This tool goes beyond a simple VWAP line; it is a complete analytical ecosystem designed to identify trend bias, measure market deviation, and provide high-probability entry and exit signals with precision timing. Whether you are a day trader, scalper, or swing trader, this su

Spread & Broker Server Analytics Advanced Suite Glass 3D effect for MetaTrader 5 ( Dashboard & compact dashboard)
Master the fundamental mechanism of market liquidity with the Spread Analytics Advanced Suite, a professional-grade monitoring and alert tool built exclusively for MetaTrader 5. In modern trading, the Bid-Ask spread is your primary transaction cost. This suite provides the transparency and precision required to manage these costs effectively, ensuring you trade only when conditio

Moment Analytics: Confluence Dashboard Advanced Suite for MetaTrader 5
Gain an unparalleled edge in market timing and trend confirmation with the Moment Analytics Confluence Dashboard , a professional-grade analytical suite built exclusively for MetaTrader 5. This tool consolidates nine of the most powerful momentum and volatility indicators into a single, cohesive on-chart HUD (Heads-Up Display), eliminating chart clutter and providing instant, at-a-glance confluence signals. Whether you ar

Price Alerts Advanced Suite for MetaTrader 5
Take control of your trading execution with the Price Alerts Advanced Suite , a professional-grade technical analysis tool built exclusively for MetaTrader 5. This suite goes far beyond simple horizontal lines; it is a complete analytical ecosystem designed to identify key market levels, monitor price action in real-time, and deliver instant notifications across multiple channels. Whether you are a day trader, swing trader, or algorithmic develope

Bollinger Trend Signals MT5 - Un indicatore di tendenza basato sulle Bande di Bollinger. Tutti i segnali vengono generati senza ridisegno o ritardo. Identifica un canale di tendenza direzionale,
potenziali punti di ingresso e di uscita.
Come funziona l'indicatore
La funzionalità dell'indicatore si basa sull'utilizzo combinato di un canale di tendenza e di un sistema per determinare i punti di prezzo massimi e minimi.
La linea blu è la linea di tendenza principale smussata; quando è al di sopr

Un indicatore che assembla un sistema complesso a partire da indicatori standard e lo testa immediatamente sulla cronologia di un grafico. Una matrice di 16 indicatori su 9 timeframe: cliccando su una cella si aggiunge un indicatore alla combinazione per il periodo desiderato, la combinazione vota e la soglia di voto genera un segnale. Le statistiche vengono ricalcolate ad ogni modifica della composizione: risultato, numero di operazioni, percentuale di operazioni redditizie, fattore di profitt

MTF LRMA Plus: Multi-Timeframe Trading Decision System Linear Regression Moving Average with ADX Trend Strength Analysis Across 6 Timeframes Product Overview MTF LRMA Plus is a professional-grade trading indicator that combines Linear Regression Moving Average (LRMA) trend analysis with ADX (Average Directional Index) trend strength measurement across 6 key timeframes (D1, H4, H1, M30, M15, M5). It delivers actionable insights through an intuitive visual dashboard, helping traders identify h

GOLDEN CROSS V1.0 - Moving Average Crossover Indicator with Quality Score General Description The GOLDEN CROSS is an advanced technical indicator developed for MetaTrader 5 that combines moving average crossovers with a quality scoring system based on multiple technical filters. It is designed to identify high-probability entry points, offering traders interactive visual tools and comprehensive risk management features. Indicator Structure and Logic 1. Crossover System Fas

KITO Opportunity ATLAS
MARKET OPPORTUNITY INTELLIGENCE FOR MT5 The market rarely suffers from a shortage of signals. The real challenge is knowing which opportunities deserve your attention—and which ones deserve to be ignored. Kito Atlas transforms your MetaTrader 5 terminal into a multi-market opportunity command centre. From one compact dashboard, it scans multiple symbols and timeframes, compares several forms of market evidence, ranks the strongest opportunities and opens a structured price

This custom algorithmic indicator is a zero-lag, non-repainting trading tool engineered for precision entries. By fusing a proprietary combination of momentum and structural metrics behind the scenes, it identifies immediate market exhaustion points without relying on delayed data. Because it calculates and locks its logic the exact millisecond a bar closes, signals will never shift, lag, or repaint after the fact.
Execution & Trade Management:
The One-Candle Rule: The primary execution strate

QQE Signal – Indicatore di Stima Quantitativa Qualitativa (QQE)
QQE Signal è un indicatore tecnico basato su oscillatore per MetaTrader 5, progettato per aiutare a identificare potenziali cambiamenti di trend e variazioni del momentum del mercato attraverso un RSI smussato e una linea QQE calcolata dinamicamente. L'indicatore mostra chiaramente la relazione tra la linea di segnale blu basata sull'RSI e la linea QQE smussata nera tratteggiata , utilizzando inoltre l'importante livello 50 come ri

MA Flow No.2 See the Flow of Bulls & Bears at a Glance, and Keep the Rhythm of the Market in Your Hands
Tired of staring at dozens of moving averages until your eyes blur? Unsure when to enter, or where to place your stop? MA Flow No.2 upgrades the humble moving average into a complete trend-trading system. No more scattered lines on your chart — instead, a living "river of bulls and bears". Up to 100 moving averages roll together in real time. On every single bar, you can see at a glance w

Volume Footprint è un indicatore di order flow per livello di prezzo per MetaTrader 5. Invece di una singola candela, ogni barra viene scomposta in righe di prezzo individuali che mostrano il volume bid e ask negoziato a quel livello — così vedi esattamente dove acquirenti e venditori hanno operato all'interno della barra, non solo dove ha chiuso il prezzo. L'indicatore aggrega il flusso di tick del grafico su un timeframe inferiore (selezionato automaticamente in base al periodo del grafico, op

Sultan of Swing Sultan of Swing is a clean and reliable swing-based signal indicator designed for traders who want clear entries without confusion or lag. The indicator detects price swings and delivers signals only at the open of a new bar. sometimes mid-bar signals but no repainting, and no unnecessary noise. Key Features Non-repainting – Signals stay fixed always. New bar signals only – Alerts appear at the start of the candle, sometimes in the Middle. Price swing logic – Built purely on mar

DaySwingPro Institutional — Multi-Factor Day & Swing Trading Engine Confluence-based BUY/SELL signals with institutional risk management, Smart Money Concepts and a live HUD — engineered with a strict zero-repaint architecture. What is it for? DaySwingPro Institutional is built for day and swing traders who hold positions from one day to several weeks (recommended timeframes: H1, H4, D1 ). Instead of firing arrows on every minor fluctuation, it waits for the trend, momentum and mark

Una freccia vi dice di comprare. Obsidian Scalper Pro vi dice dove comprare, dove va lo stop, dove sono i tre obiettivi, quanto deve essere grande la posizione per il vostro rischio e quanto vale il setup su 100. Ogni segnale arriva come un piano operativo finito e disegnato sul grafico, e una finestra di statistiche integrata mostra il risultato onesto degli ultimi cento, percentuale di successo con intervallo di confidenza compresa. Ogni decisione è presa su una barra chiusa, quindi lo storico

Un pool di liquidità è un massimo o un minimo di swing confermato che non è ancora stato preso. Un liquidity sweep è la barra sulla quale il prezzo viene scambiato oltre quel livello e poi chiude di nuovo all'interno del range - lo stesso evento che i trader chiamano anche stop hunt, stop run, liquidity grab o falso breakout. Liquidity Sweep Pools MTF contrassegna sia i pool sia i liquidity sweep effettuati su di essi, sul grafico corrente e su un timeframe superiore che scegli, e aggiunge un pa

Supply and Demand + Market Structure Smart Money order block detection, volume-weighted confirmation, and full BOS/CHoCH market structure Check out Rudy Bank for more features: https: // www.mql5.com/en/market/product/193059 Check out Iron Entry for zone entry confirmations: https: // www.mql5.com/en/market/product/193937
Overview
SupplyDemand Edge finds and draws institutional supply and demand order blocks directly on your chart, then backs every one of them up with real market data — volume

See the Market From the Higher-Timeframe Perspective. Ashinton MTF-Trend Pro is a professional multi-timeframe trend analysis indicator for MetaTrader 5, designed to help traders quickly identify directional alignment across Monthly (MN1), Weekly (W1), Daily (D1), and H4 timeframes.
Instead of analyzing each timeframe manually, MTF-Trend Pro brings the bigger market picture into one clean, intuitive dashboard, helping you determine whether the higher timeframes are aligned, conflicted, or deve

ElliottWave Pro — Automatic Wave 2 Detection and Wave 3 Targets An indicator for MetaTrader 5 that automates Elliott Wave and Fibonacci analysis. ElliottWave Pro detects the end of the first impulse (Wave 1), calculates the corrective zone (Wave 2) and draws a ready-to-use trading setup with Stop Loss and Take Profit levels. Key Features Automatic Wave 1 detection: connects points P0 and P1 to show the trend structure. Wave 2 entry zone: a rectangular retracement zone with Fibonacci levels 38.2%

SMC Sentinel — Indicatore Smart Money Concepts Fai trading con la struttura. Guarda il mercato in modo diverso. SMC Sentinel è un avanzato indicatore di analisi Smart Money Concepts (SMC) per MetaTrader 5 , progettato per riunire diversi concetti di price action in un unico sistema grafico pulito e personalizzabile. Invece di affidarsi a un singolo segnale, SMC Sentinel analizza la struttura del mercato, la liquidità, gli squilibri di prezzo, le zone istituzionali, le aree di ritracciamento e il
Il MetaTrader Market è un negozio online unico di robot di trading e indicatori tecnici.
Leggi il promemoria utente di MQL5.community per saperne di più sui servizi unici che offriamo ai trader: copia dei segnali di trading, applicazioni personalizzate sviluppate da freelance, pagamenti automatici tramite il Sistema di Pagamento e il MQL5 Cloud Network.

Ti stai perdendo delle opportunità di trading:
- App di trading gratuite
- Oltre 8.000 segnali per il copy trading
- Notizie economiche per esplorare i mercati finanziari
Registrazione
Accedi
Accetti la politica del sito e le condizioni d’uso
Se non hai un account, registrati