Conheça o Mercado MQL5 no YouTube, assista aos vídeos tutoriais
Como comprar um robô de negociação ou indicador?
Execute seu EA na
hospedagem virtual
hospedagem virtual
Teste indicadores/robôs de negociação antes de comprá-los
Quer ganhar dinheiro no Mercado?
Como apresentar um produto para o consumidor final?
Indicadores Técnicos para MetaTrader 4 - 143
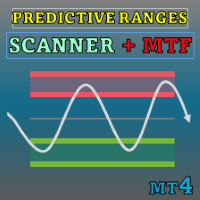
Special offer : ALL TOOLS , just $35 each! New tools will be $30 for the first week or the first 3 purchases ! Trading Tools Channel on MQL5 : Join my MQL5 channel to update the latest news from me No atual cenário volátil de negociação financeira, identificar com precisão níveis de suporte e resistência é fundamental para que os traders tomem decisões informadas. O Predictive Ranges Scanner Multi-TF é uma ferramenta avançada projetada para ajudar os traders a escanear e prever fut
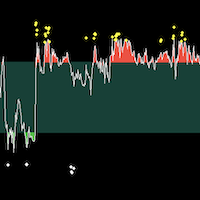
BS Trend Line For MT4是一款很好的买卖指示器,不含有未来函数,不会重绘,新版本已经加入了更好的过滤算法,开单成功率有了很大的提高,是一个很好的波段交易提示器,尤其是配合 SourcePoint For MT4 会有更明显的效果,它能帮你过滤掉接近70%以上的无效交易信号。 ===================参数列表===================== timeframe:M5
gip:30 sip:6 up line:80 down line:20 ===================使用方法===================== 配合 SourcePoint For MT4 使用时, SourcePoint For MT4 的参数 fastP: 96
slowP:208 avgP:72
Binary Power Pinbar 2 para MT4 O Binary Power Pinbar 2 é um indicador para opções binárias que funciona com qualquer par de moedas e é adequado para todos os períodos de tempo. Princípio de funcionamento O indicador identifica o padrão "pin-bar" no gráfico. Após a sua formação: Para compras: se o preço ultrapassar o máximo do pin-bar, será gerado um sinal de compra. Para vendas: se o preço romper o mínimo do pin-bar, será gerado um sinal de venda. Características principais Tempo de expiração: C
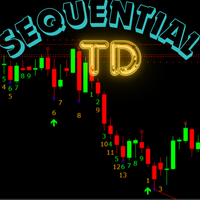
If you are unsure how to use this indicator, please feel free to reach out to me. I will explain it to you and provide reading materials to help you make the most of it. Here’s a brief description of how to use the indicator effectively. How to Use TD Sequential by Tom DeMark The TD Sequential is a technical analysis indicator developed by Tom DeMark, designed to identify potential turning points in market trends. It is widely used by traders to anticipate market reversals and manage trading ris
If you are unsure how to use this indicator, please feel free to reach out to me. I will explain it to you and provide reading materials to help you make the most of it. Most effective with TD sequential : MT4: https://www.mql5.com/en/market/product/129509?source=Site +Profile+Seller MT5: https://www.mql5.com/en/market/product/129507?source=Site +Profile+Seller My Other products: https://www.mql5.com/en/users/1700046313/seller
Here’s a brief description of how to use the

Trend Guardian Pro - Advanced Trend Prediction Indicator Trend Guardian Pro is the result of collaborative work by a team of professional mathematicians, analysts, and traders. The indicator is based on years of market data analysis and employs cutting-edge mathematical modeling techniques for early detection of potential trend changes. Key Features: Early prediction - the indicator analyzes multiple market factors to identify signs of trend changes before they become apparent Comprehensive an

Great For Binary options. Works on all timeframes. Recommended for M5 timeframe. one candle expiry. Experienced traders can explore. Strategy is based on price action and multi timeframe analysis. Recommended During high volatility sessions, like the London and new York sessions. For the M1(One minute) timeframe, Traders can use four or five candle expiry, this means it can be applied for 4, 5 or more minutes expiry.
For forex traders, I tested the indicator with the JesVersal universal EA:

Introducing the Phoenix Turn Indicator
The Phoenix Turn indicator is designed for traders who seek to harness the power of precise market-turn detection. This tool provides clear visual cues to identify potential buy and sell opportunities based on dynamic price-action and indicator-based logic. Why Choose Phoenix Turn? Unoptimized for Flexibility: This indicator is provided as a raw tool for you to optimize and customize, fitting perfectly with your unique trading strategy. Clear Visual Signal

Crystal Cross RSI Introducing the Crystal Cross RSI indicator—crafted for traders who seek control over their strategy! This tool is not pre-optimized, leaving room for you to fine-tune and adapt it to your trading style. Key Features: Clear Buy and Sell Signals: Lime arrows highlight buy opportunities, while red arrows signal sell entries—keeping your decisions sharp and informed. Dynamic RSI Analysis: The blue RSI line tracks market momentum, complemented by a signal line for precise crossing

Desert Mirage Indicator Take your trading to the next level with the Desert Mirage Indicator! Designed with flexibility in mind, this tool is your ultimate companion for identifying lucrative opportunities in the forex market. Please note: this indicator is not optimized—it’s built for you to customize and tailor to your unique trading style! Key Features: RSI-Based Signals: Harness the power of the Relative Strength Index (RSI) to spot overbought and oversold market conditions with ease. Gener

Introducing "Dragons Pulse" Are you ready to take your trading strategies to the next level? The Dragons Pulse Indicator is a powerful tool designed with flexibility in mind, empowering you to optimize it according to your unique trading style. While not pre-optimized, this indicator provides you with a foundation to unleash your creativity and craft strategies that truly work for you! Key Features: RSI-Based Insights: Uses the trusted Relative Strength Index (RSI) to analyze market momentum. P
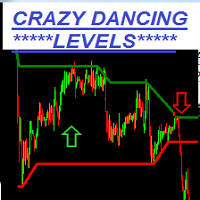
Crazy Dancing moving RES/SUP Levels Automatic redrawing of moving Supports and resistances levels to indicate price breaking supports (signal SELL) or breaking resistance levels (signal BUY) Very simple appearing indicator but very clever and smart too !!!! Main Inputs: # of bars for the support and resistances levels + the initial shift from start + moving average for filter signaling Smaller values for bars /shift inputs when using Higher Time frames (D1-H4) and the reverse higher values for

Introducing the Phoenix RSI Indicator – your gateway to mastering market momentum and identifying profitable trading opportunities! Designed for traders who value control, this indicator comes pre-equipped with powerful features but is intentionally left unoptimized to empower YOU to tailor it to your unique trading strategy. What Makes the Phoenix RSI Indicator Special? Customizable RSI Analysis :
Visualize market momentum with a sleek RSI line directly on your chart.
Adjust the RSI period to

Introducing the Thunder Wave Indicator The Thunder Wave Indicator is a powerful tool designed for traders who love to optimize and tailor their strategies. This indicator is not pre-optimized, giving you full control to adjust it according to your trading style and market conditions. Why Choose Thunder Wave? The Thunder Wave Indicator leverages the Relative Strength Index (RSI) to deliver actionable insights, while incorporating delay and visualization features to ensure precision and clarity.

LevelGuard SmartSMA Indicator Master Support & Resistance Analysis with Precision LevelGuard SmartSMA is a powerful tool designed to simplify your trading decisions by identifying dynamic support and resistance levels. This indicator leverages moving averages to provide precise insights into market movements, helping traders master their strategy with confidence. How It Works Core Strategy: Uses a central SMA (e.g., 50 or 200-period) as a dynamic support or resistance line. Additional SMAs (opt
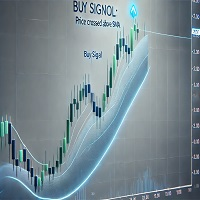
The PriceBreak SmartSMA Indicator is designed for traders who want a powerful price action tool with full customization options. It offers valuable insights into market trends and potential trading opportunities, allowing you to refine your strategy to fit any market condition. How It Works SMA Crossover Logic Uses a 20-period SMA (customizable) to identify market trends. Buy Signals: Triggered when price crosses above the SMA. Sell Signals: Triggered when price crosses below the SMA. You can a

The "Pure Directional SMA Indicator" is a powerful tool designed for traders seeking precise trend direction and actionable signals. This indicator is not pre-optimized, offering flexibility to tailor it to your unique trading style and market preferences. The Logic Behind the Indicator:
At its core, this indicator uses Simple Moving Averages (SMAs) to determine trend direction and generate buy/sell signals. Here's how it works: Three SMA Lines: Short SMA : Reacts quickly to price changes, ide

Indicador de Força do Touro e do Urso Atualização 1.3
O indicador de Touro e Urso agora inclui um perfil de volume integrado para detectar as áreas de maior volume dentro de um determinado intervalo de barras. Isso pode ser ainda mais modificado de acordo com suas próprias configurações e preferências para a detecção especializada da força do touro e do urso com o maior volume.
Isso ajuda para: Detecção precoce e oportunidades de entrada precisa Detecção de reversões Detecção de retrocessos Vi
The Level DELTA indicator for MetaTrader 4 (MT4) – a powerful volume analysis tool that stands out with its capabilities and accuracy. Indicator Description The Level DELTA indicator is designed for volume analysis in a separate MT4 window. Its main task is to identify and display divergences, allowing traders to make more informed and timely decisions. Indicator Features Volume Analysis : The indicator analyzes volumes in financial markets, allowing you to see how volumes are distributed over d
Engulfing Pattern Indicator Introducing the Engulfing Pattern Indicator. Are you ready to take your trading strategy to the next level? The Engulfing Pattern Indicator is your ultimate tool to spot powerful market reversals and trends based on the time-tested Engulfing Candlestick Pattern. This indicator is crafted to provide you with actionable insights, but remember: it’s not optimized—you have the freedom to optimize it to suit your trading needs. Why the Engulfing Pattern? The Engulfing Pat

Unleash the power of precision trading with the RangeRider SmartSMA Indicator!
This tool is not optimized, providing you with the ultimate freedom to customize it according to your trading strategy. Perfect for traders seeking control and adaptability, this indicator is designed to help you refine your approach and optimize for success. How it Works:
The RangeRider SmartSMA Indicator combines Simple Moving Average (SMA) calculations with Range and Relative Strength Index (RSI) thresholds to pro

The Visual SmartSMA Indicator MT4 is a versatile tool designed to assist traders in identifying potential buy and sell signals based on Simple Moving Average (SMA) crossovers. With advanced customization options and additional divergence analysis, this indicator provides a clear visual representation of potential market entries while allowing traders to tailor the strategy to their preferences. Features and Highlights: SMA Crossover Detection : Tracks Fast and Slow SMA interactions to generate

Visual Simple Cross Indicator Unlock the power of moving average crossovers with this sleek, fully visual indicator designed to help you identify buy and sell opportunities directly on your chart. The Visual Simple Cross Indicator is simple yet versatile, catering to traders who prefer a no-frills approach to trend-following strategies. Features & Benefits: Customizable Moving Averages: Configure the fast and slow MA periods, methods, and applied prices to suit your trading style. Clear Buy & S

Unlock the Power of Precision with the Storm Peak Indicator! The Visual Storm Peak Indicator is a sophisticated, signal-driven tool designed for traders who seek clear and actionable market insights. It's built on a robust logic foundation, leveraging the Commodity Channel Index (CCI) to identify market peaks and reversals effectively. While the indicator comes with a pre-set structure, it has been specifically created for you to optimize and adapt to your unique trading style. Why Choose the S

Wind Shift Indicator Are you ready to harness market shifts with precision? The Wind Shift Indicator is your tool for identifying potential reversals and trend continuations. Designed for traders who prefer to fine-tune their tools, this indicator is not optimized, giving you the freedom to tailor it to your unique trading style. Logic Behind the Strategy: The Wind Shift Indicator employs a combination of Commodity Channel Index (CCI) logic and visual signal plotting to detect shifts in market
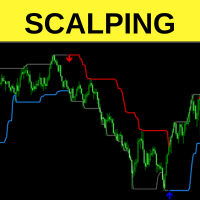
Nome do Indicador: Scalping Channel System Descrição: O indicador Scalping Channel System é uma ferramenta poderosa para analisar tendências de mercado e identificar possíveis pontos de entrada. Ele foi projetado para a conveniência do trader, minimizando a necessidade de monitoramento constante do mercado. O indicador envia notificações PUSH e EMAIL quando um sinal de operação aparece, permitindo que os traders evitem ficar o tempo todo em frente à tela. Vantagens do Indicador: Sinais visuais c

The Market Strength Indicator (MSI) is yet another in our stable of volume-based indicators, and as such, is a must-have tool for trading virtually any type of market and across a myriad of applications from trend trading to swing trading, scalping, and much more. While its sister indicator, the Currency Strength Indicator (CSI), helps you analyze which currencies are oversold, overbought, correlating, and trending, the MSI or Market Strength Indicator does this also, but in this case, for all m

The VRSI indicator is another in the suite of volume indicators we have developed and one that complements our volume price analysis methodology perfectly. and was developed out of a desire to build further on our cornerstone of VPA by peeling back the layers of volume and considering the relative aspect of volume. Hence, the acronym of Volume Relative Strength Index indicator encapsulates what the indicator is all about. By analyzing relative volume, we are able to see a visual representation o

The VWAP indicator is another of our suite of volume indicators and one which was first referred to in 1988 when it appeared in an article entitled “The Total Cost Of Transactions On The NYSE” in the March edition of the Journal Of Finance from that year, which went on to explain its importance, particularly from an institutional perspective, which underpins its significance in appreciating the power and importance of this indicator. In many ways, it is akin to the volume price analysis methodol

The Fibonacci Confluence Toolkit is a technical analysis tool designed to help traders identify potential price reversal zones by combining key market signals and patterns. It highlights areas of interest where significant price action or reactions are anticipated, automatically applies Fibonacci retracement levels to outline potential pullback zones, and detects engulfing candle patterns. Its unique strength lies in its reliance solely on price patterns, eliminating the need for user-define
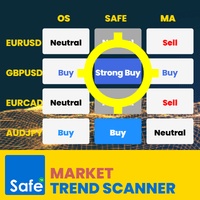
Market Trend Scanner is a trend analyzer or trend screener indicator that helps you know the trend in selected timeframe of all symbols you're watching .
This indicator provides clear & detailed analysis results on a beautiful dashboard, let you able to use this result right away without need to do any additional analysis. How it works
Step 1: Calculate values of 23 selected & trusted technical indicators (Oscillator & Moving Average indicators)
Step 2: Analyze all indicators using best pr

Fibonacci Trend Marker — is a trend indicator that analyzes the behavior of the current candle relative to the High-Low (HL) range of previous candles using Fibonacci retracement levels. It visually tracks trend strength, signaling potential weakening or reversal through a change in candle color.
Features: Designed for trend-focused traders, it helps quickly identify trend changes based on Fibonacci levels. Effective on any timeframe with sufficient market volatility, when a sequence of 3–5 c

The Visual ATR Bands Bounce Indicator is a robust tool designed to empower traders with advanced insights into price action using Average True Range (ATR) bands. Please note, this indicator is not optimized, giving you the freedom and flexibility to tailor it to your trading style and strategy. The Visual ATR Bands Bounce Indicator leverages the power of ATR to dynamically plot bands around price action. These bands serve as a flexible envelope, adapting to market volatility. The key idea is to

Unlock Precision with ATR Bands Expansion Indicator The ATR Bands Expansion Indicator is your gateway to identifying dynamic price movements and breakout opportunities in the financial markets. Designed to enhance your trading strategy, this tool uses Average True Range (ATR) principles to create adaptive bands that expand and contract based on market volatility. Key Highlights: Not Optimized: This indicator is designed for you to optimize according to your trading preferences and market condit

Unlock the Power of Trend Dynamics with ATR Bands Midline Trend Indicator! The ATR Bands Midline Trend Indicator is a meticulously crafted tool designed to help traders identify trends with precision using the Average True Range (ATR) as a foundation. This indicator focuses on calculating a midline derived from ATR bands, providing a unique perspective for traders to detect trend direction and strength effectively. Important: This indicator is not optimized, leaving the door open for you to tai

Unlock Your Trading Potential with the ATR Bands Touch Indicator! The ATR Bands Touch Indicator is a dynamic tool designed to identify key price interactions with the Average True Range (ATR) Bands. Built to assist traders in spotting significant touchpoints where price momentum aligns with volatility boundaries, this indicator provides a strategic edge in identifying potential trend shifts or breakout zones. Key Features and Logic Behind the Indicator: Core Strategy: The ATR Bands are calculat

Unoptimized and Designed for You to Customize The Mercury Track Indicator is a powerful trading tool created with flexibility in mind, allowing you to tailor it to your trading strategies and market conditions. Out of the box, it provides insightful signals, but it’s meant for traders to optimize and enhance according to their unique preferences and trading styles. Logic Behind the Strategy
At its core, the Mercury Track Indicator employs a combination of signal generation and dynamic band plot

Take control of your trading decisions with the 'Visual Venus Guard Indicator'! This advanced indicator offers a versatile framework designed to assist you in identifying potential market turning points. Created with a focus on customization, it empowers YOU to optimize it according to your unique trading strategy. The Strategy Behind the 'Visual Venus Guard Indicator'
The 'Visual Venus Guard Indicator' uses a comprehensive algorithm to identify critical price zones and reversal patterns, provi

Visual Envelope Indicator is designed for traders who want a clear visual representation of market trends, potential reversals, and price dynamics within defined envelope boundaries. This indicator simplifies market analysis, offering a unique perspective for crafting your trading strategy. Please note that this indicator is not optimized—it's intentionally built for you to optimize it according to your trading style and goals. Strategy and logic behind the indicator
The Visual Envelope Indicat

Visual Envelope Price Cross Indicator Unlock the power of price envelope dynamics with the Envelope Price Cross Indicator. This tool is designed to identify potential trade opportunities by analyzing price movements relative to the envelope bands. It is a valuable addition to your trading arsenal, providing insights into trend continuations, reversals, and market momentum. Important: This indicator is not optimized. It is created for you to optimize and fine-tune to match your trading strategy.

Optimize Your Strategy with the Envelope Support Bounce Indicator! The Visual Envelope Support Bounce Indicator is designed as a tool for traders who want to unlock the potential of envelope-based strategies in their trading. This indicator is not pre-optimized, allowing you to fully customize and optimize it to suit your trading style and preferences. Whether you're a scalper, day trader, or swing trader, the flexibility of this tool makes it an invaluable addition to your arsenal. What does i

Welcome to the Visual Envelope Trend Flow Indicator! This tool is not optimized and has been crafted specifically for you to explore, test, and fine-tune according to your unique trading strategy. It offers flexibility and a powerful starting point for traders aiming to master trend identification and price flow dynamics. The Visual Envelope Trend Flow Indicator leverages the concept of envelope channels, which are dynamic boundaries drawn around price action. These boundaries are calculated ba

The Range Directional Force Indicator is designed to help traders analyze market trends, reversals, and directional strength. It focuses on price movements within defined ranges, identifying key moments when the market is gaining momentum or preparing for a shift. By dividing the chart into dynamic price ranges, the indicator detects critical support and resistance levels. It calculates the directional force of price movements, highlighting potential entry and exit points based on market sentim

The Visual Dragon Cloud Indicator is designed to help traders analyze market behavior through trend identification, support and resistance levels, and potential reversals. It adapts to changing market conditions by using cloud formations to highlight momentum shifts and price direction. This tool provides traders with key price zones for entries and exits based on how price interacts with the cloud. When price moves into or out of specific cloud layers, it signals possible bullish or bearish tr

This indicator is designed to help you forecast the potential high and low prices for the current trading day, based on the high and low of the previous day. It does this by applying a customizable percentage increase or decrease to those levels. How It Works: The idea is simple: It looks at the previous day's high and low prices and then adjusts them by a percentage you choose. Here's what that means: Predicted High: This is calculated by taking the high price of the previous day and adding a p
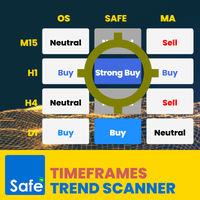
Timeframes Trend Scanner is a trend analyzer or trend screener indicator that helps you know the trend in all timeframes of selected symbol you are watching .
This indicator provides clear & detailed analysis results on a beautiful dashboard, let you able to use this result right away without need to do any additional analysis. How it works
Step 1: Calculate values of 23 selected & trusted technical indicators (Oscillator & Moving Average indicators)
Step 2: Analyze all indicators using best pra

Visual Eagle Dive Indicator The Eagle Dive Indicator is your ultimate tool for analyzing and interpreting market movements with precision. This powerful indicator is designed to help you visualize key market trends and patterns, but it is not optimized. It has been intentionally created for you to customize and optimize according to your trading style and preferences. Key Features and Entry Logic Market Diving Signals: The Eagle Dive Indicator identifies critical market movements, resembling th

Unleash the Power of Market Dynamics with the Vortex Indicator! The Visual Vortex Indicator is your advanced tool for decoding market trends, reversals, and momentum shifts. Priced at $65, this indicator provides a comprehensive view of market behavior, but it’s designed for you to fine-tune and optimize it according to your unique trading strategy. What Makes It Unique?
The Vortex Indicator is based on a strategy that identifies directional movements and trend strength by analyzing key price d

Visual Vortex Momentum Shift Indicator Unlock the potential of momentum shifts in the market with the Visual Vortex Momentum Shift Indicator! This advanced tool is designed to help traders identify crucial turning points and momentum reversals with clarity and precision. However, this indicator is not optimized and is created for you to optimize based on your trading preferences and strategies. What is the Visual Vortex Momentum Shift Indicator? The indicator focuses on detecting momentum shift
Explore the Power of Precision with the Range Indicator! This cutting-edge indicator is designed to provide traders with a detailed analysis of market range movements. However, it is essential to note that the Visual Range Indicator is not optimized—it has been crafted for you to tailor it to your trading needs and optimize it for your unique strategy. Your mastery and customization will unlock its true potential! The Strategy Behind the Range Indicator
The Visual Range Indicator focuses on id

In the rapidly changing financial markets, finding reliable trading signals is the key to success!
In trading, the timing of entry is everything!!
Whether you are a short-term trader or a long-term investor, this indicator can provide you with the most accurate entry signals, helping you to seize market opportunities and become your most powerful trading assistant!
MT5: https://www.mql5.com/en/market/product/129934 Features: Accurate Entry Signals: Based on advanced algorithms and real-tim
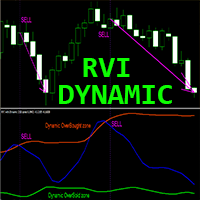
Indicador Crypto_Forex "RVI com zonas dinâmicas de sobrevenda/sobrecompra" para MT4, sem repintura.
- O Relative_Vigor_Index (RVI) é um indicador técnico de momentum muito útil em mercados de tendência. - É ótimo para entradas de venda de zonas dinâmicas de sobrecompra e entradas de compra de zonas dinâmicas de sobrevenda. - O indicador pode ser utilizado em qualquer período de tempo, mas é especialmente bom em períodos de tempo grandes: D1, H4, H1, M30. - Zona de sobrecompra dinâmica - acima
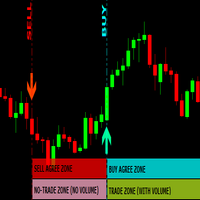
non-repaint free MT4 technical indicator works on all timeframes 1 minute to the monthly timeframe the trade vision buy and sell arrow is a multi currency and synthetic indicator Trade vision buy and sell arrow comes with Push Alerts purple arrow look for selling opportunities white arrow look for buying opportunities. wait for candle to close and arrow to appear before taking any trades

The Gann Scalping Gold Indicator is a robust technical analysis tool designed for precision trading in gold markets. It leverages Gann-based methodologies to identify key price levels, enabling traders to anticipate potential market reversals, breakouts, and areas of consolidation. Daily Reset Logic: Automatically resets touch statuses at the start of a new trading day, ensuring that the indicator aligns with fresh daily trends. How It Works: The indicator draws horizontal lines at predefined le
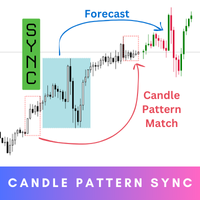
Candle Pattern Sync is your ultimate tool for precision and insight in trading. Step into the future of trading with this innovative indicator that’s designed to help you understand market behavior by analyzing historical patterns and giving you an idea of what might come next. While the forecasts provide valuable probabilities based on history, they’re not guarantees – think of them as a powerful guide to inform your decisions, not a definitive answer. MT5 Version - https://www.mql5.com/en/mar
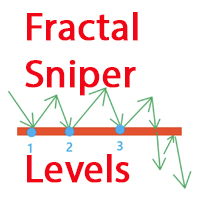
Fractal Sniper Levels is a powerful technical indicator that finds a rebound of fractal formations from one price zone. The main feature of the indicator is that it analyzes fractals not just as extremes, but as full-fledged reversal formations, which significantly increases the reliability of the determined levels.
Key advantages Working with fractals as reversal formations, and not just as local extremes Intelligent analysis of each fractal's rebound from the levels of the same price zone A
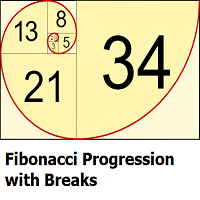
This indicator highlights points where price significantly deviates from a central level. This deviation distance is determined by a user-set value or using a multiple of a period 200 Atr and is multiplied by successive values of the Fibonacci sequence. Settings
Method: Distance method, options include "Manual" or "Atr"
Size: Distance in points if the selected method is "Manual" or Atr multiplier if the selected method is "Atr"
Sequence Length: Determines the maximum number of significant devia
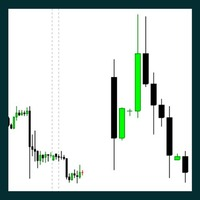
The Indicator is useful for professional trader, such as ICT , Smart Money Concept trader; who do the top-down analysis and want to display the candles of the Higher Timeframe on the Lower Timeframe. It allows you to stay in your entry timeframe while following the narrative of the Higher timeframe. Here are some easy input: Number Of Bars: The total of HTF's candle you want to display. Auto Timeframe: If true, the indicator will recommend the Higher timeframe that suit the current timeframe you
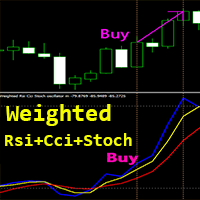
Indicador Crypto_Forex "Oscilador Rsi Cci Stoch ponderado" para MT4, sem repintura.
- Este indicador único combina 3 em 1: RSI, CCI e Estocástico para cálculo! - Oportunidades de negociação dinâmicas precisas com este software - ver exemplos nas fotos. - O indicador é constituído por 3 linhas: - Oscilador ponderado Rsi Cci Stoch propriamente dito (cor azul); - MA rápida do oscilador (cor Amarela); - MA lenta do oscilador (cor vermelha); - Zona acima de 50 - zona de sobrecompra (Não COMPRE lá).

O indicador DYJ BoS MT4 identifica e marca automaticamente os elementos essenciais das alterações na estrutura do mercado, incluindo:
Ruptura de Estrutura (BoS): Detetado quando o preço faz um movimento significativo, rompendo um ponto de estrutura anterior.
Marca possíveis linhas de tendência de alta e linhas de tendência de baixa (UP & DN, ou seja, novos máximos e novos mínimos contínuos) e, uma vez que o preço rompe estas linhas, marca setas vermelhas (BEAR) e verdes ( BULL).
O BoS ocorre
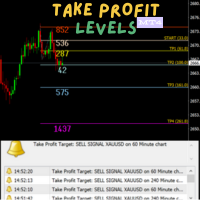
This indicator outlines take profit (TP) stations derived from the Dinapoli ABC price projections. The key levels identified include COP (the critical operation point) designated as TP1, OP (the optimal point) marked as TP3, and SXOP (the secondary operation point) noted as TP4.
This indicator proves to be especially beneficial for traders entering positions without clearly defined exit points. The Dinapoli levels provide precise price projections that highlight where the market is most likely

This is the Parabolic Dashboard MT4. This dashboard will scan multiple timeframes and symbols in MT5 platform, from M1 chart to D1 chart. It will send the buy/sell signals by alert on the platform or sending notification to your phone or message you via a email.
The buy signal is generated when the SAR changes its position from above to below of the candle. The sell signal is is generated when the SAR changes its position from below to above of the candle. The up/down trend color will be di
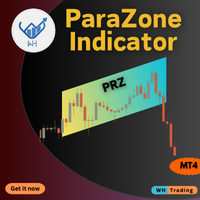
The ParaZone Indicator MT4 helps you spot areas where price trends are likely to reverse. It marks these zones on your chart using a unique parallelogram shape, making it easier to find the best points to enter or exit trades. Whether you’re a beginner or experienced trader, this tool can help improve your trading decisions. Key Features: Accurate Reversal Detection: Identifies key zones where price may change direction. Dynamic Zone Adaptation: Zones adjust in real-time to follow market

One of the key elements in trading is identifying zones or levels that allow traders to make buy or sell decisions during trading. أحد العناصر الأساسية في التداول هو تحديد المناطق أو المستويات التي تسمح للمتداولين باتخاذ قرارات الشراء أو البيع أثناء التداول. The indicator displays Fibonacci levels يعرض المؤشر مستويات فيبوناتشي drawing levels based on historical daily or weekly data. مستويات الرسم بناءً على البيانات التاريخية اليومية أو الأسبوعية. Daily levels update with each new day’s opening

Are you a newbie who feels like trading is rocket science? Fear not! With our new Indicator, you’ll trade like a pro—without the awkward space suit!Say goodbye to the confusion and hello to profits! Now you can impress your friends with your "expert" trading skills—even if you just learned what a stock is! :money_mouth:Trade smart, not hard! Grab the Trade Wiz-A-Matic today and let’s launch your trading journey! Key Features: Dynamic Levels : The indicator calculates and plots key levels based o

Enter/Exit indicator Try trading on signal change BUY/SELL to Sell SELL/BUY to buy or exit by signal change. Very good for trading news. - - - - - - - - - - Please leave positive comments. - - - - - - - - - - - - - - - - - - - - - - - - - - - - - - - - - - - - - - - - - - - - - - - - - - - - - - - - - Info: CalculatedBars = Indicator Calculated Bars; AlertConfirmation = true On false Off LongBarPoints = maximum point value for signal long bar size. Buffer0[] = Arrow Up; Buffer1[] = Arrow Down;
The product has been removed from sale。 Sales suspended, do not download. 2025/1/28 The product has been removed from sale。 Sales suspended, do not download. 2025/1/28 产品已下架 产品已下架 The product has been removed from sale。Sales suspended, do not download. 2025/1/28 The product has been removed from sale。Sales suspended, do not download. 2025/1/28 产品已下架 产品已下架 The product has been removed from sale 产品已下架 The product has been removed from sale 产品已下架 The product has been removed from sale The product

O Indicador Volume Bar POC é uma ferramenta inovadora que oferece uma visualização precisa dos níveis de preços-chave (Point of Control, POC) com base no volume de ticks. Este indicador analisa cada ponto de preço dentro de velas individuais e exibe os níveis mais significativos, que podem ser utilizados como zonas fortes de suporte e resistência. Ideal para estratégias de trading intradiário e de longo prazo. Como funciona o Indicador Volume Bar POC? O indicador utiliza um processo avançado par

Adjustable Volume Profile Indicator The Adjustable Volume Profile is a custom MetaTrader 4 (MT4) indicator designed to visually display the volume distribution of a financial instrument across a specific price range and time period. This indicator allows traders to analyze the volume profile based on either real volume or tick volume, helping to identify key levels of support, resistance, and market activity.
Key Features: Customizable Timeframe: The indicator can be set to any available timefr
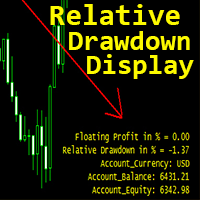
Indicador Crypto_Forex "Exibição de Rebaixamento Relativo" para MT4, ferramenta de negociação útil.
Este é um indicador OBRIGATÓRIO para os traders que utilizam sistemas de grid trading!!!
- O indicador de visualização de drawdown relativo mostra o DD relativo atual ou o lucro flutuante em % na sua conta. - Os alertas para PC e dispositivos móveis estão integrados com nível de disparo ajustável. - O indicador indica também o saldo e o capital próprio da conta. - É possível localizar os valore
O Mercado MetaTrader é a única loja onde você pode baixar um robô demonstração de negociação gratuitamente para testes e otimização usando dados históricos.
Leia a visão geral e opiniões de outros clientes sobre os aplicativos, faça o download para o seu terminal e teste um robô de negociação antes de comprá-lo. Apenas no Mercado MetaTrader você pode testar um aplicativo de forma absolutamente gratuita.
Você está perdendo oportunidades de negociação:
- Aplicativos de negociação gratuitos
- 8 000+ sinais para cópia
- Notícias econômicas para análise dos mercados financeiros
Registro
Login
Se você não tem uma conta, por favor registre-se
Para login e uso do site MQL5.com, você deve ativar o uso de cookies.
Ative esta opção no seu navegador, caso contrário você não poderá fazer login.