Assista a como baixar robôs de negociação gratuitos
Encontre-nos em Twitter!
Participe de nossa página de fãs
Participe de nossa página de fãs
Script interessante?
Coloque um link para ele, e permita que outras pessoas também o avaliem
Coloque um link para ele, e permita que outras pessoas também o avaliem
Você gostou do script?
Avalie seu funcionamento no terminal MetaTrader 5
Avalie seu funcionamento no terminal MetaTrader 5

Spazm - expert para MetaTrader 4
- Visualizações:
- 15628
- Avaliação:
- Publicado:
-
 Você está perdendo oportunidades de negociação:
- Aplicativos de negociação gratuitos
- 8 000+ sinais para cópia
- Notícias econômicas para análise dos mercados financeiros
Registro LoginVocê concorda com a política do site e com os termos de uso
Se você não tem uma conta, por favor registre-se -
 Precisa de um robô ou indicador baseado nesse código? Solicite-o no Freelance
Ir para Freelance
Precisa de um robô ou indicador baseado nesse código? Solicite-o no Freelance
Ir para Freelance
extern double k=5.0;// multiplier for opening a trade relative to the current volatility, i.e. movement_for_opening=volatility_over_period*k
extern int period=24;// period to calculate the volatility in bars
extern int exp=0;// volatility smoothing mode, 0-simple moving average, 1-linearly weighted
extern int open.close=0;// mode of volatility calculation by 1-open/close, 0-High/Low
extern double SL_pp=0;// set stop loss as a percentage of the movement that took place (from 0 to 1, 0-stop loss is not set at all)
extern bool visualize=true; // plot movements
Large drawdowns, suggestions on improvements are welcome
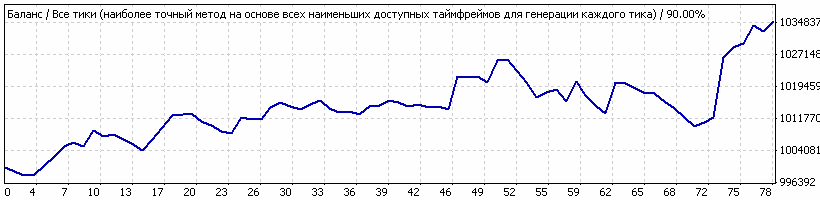
Strategy Tester Report
Spazm
TeleTrade-Server (Build 220)
| Symbol | EURUSD (Euro vs US Dollar) | ||||
| Period | 1 Hour (H1) 2008.01.02 10:00 - 2009.01.16 17:00 (2008.01.01 - 2010.01.01) | ||||
| Model | Every tick (the most accurate mode based on the shortest available time frames) | ||||
| Parameters | k=6; period=24; exp=0; open.close=0; SL_pp=0; visualize=false; | ||||
| Bars in test | 7413 | Ticks modelled | 3693207 | Modelling quality | 90.00% |
| Mismatched chart errors | 15 | ||||
| Initial deposit | 1000000.00 | ||||
| Net profit | 35223.60 | Gross profit | 89637.40 | Gross loss | -54413.80 |
| Profit factor | 1.65 | Expected payoff | 451.58 | ||
| Absolute drawdown | 2399.60 | Maximum drawdown | 19886.20 (1.93%) | Relative drawdown | 1.93% (19886.20) |
| Total trades | 78 | Short positions (won %) | 39 (53.85%) | Long positions (won %) | 39 (43.59%) |
| Profit trades (% of total) | 38 (48.72%) | Loss Trades (% of total) | 40 (51.28%) | ||
| Largest | profit trade | 14433.60 | loss trade | -3496.80 | |
| Average | profit trade | 2358.88 | loss trade | -1360.34 | |
| Maximum | consecutive wins (profit in money) | 6 (24475.80) | consecutive losses (loss in money) | 8 (-10623.20) | |
| Maximal | consecutive profit (count of wins) | 24475.80 (6) | consecutive loss (count) | -10623.20 (8) | |
| Average | consecutive wins | 2 | consecutive losses | 2 | |
Traduzido do russo pela MetaQuotes Ltd.
Publicação original: https://www.mql5.com/ru/code/8683
 The Cronex T Demarker GFC (Color) indicator
Modification of the DeMarker indicator with additional color indication based on the histogram
2pbIdealMA
Moving average
Grid
Alternative grid
Ma_Parabolic_st2
Parabolic plotted based on Lows and Highs of a moving average. Efficiently displays the trends on smaller timeframes, and allows to mostly eliminate frequent switches, inherent to the "Parabolic SAR" indicator.