 MetaTrader 5
 Experts
 Indicadores
 Scripts
 Bibliotecas
 Repositório
Assista a como baixar robôs de negociação gratuitos
Encontre-nos em Twitter!
Participe de nossa página de fãs
Participe de nossa página de fãs
Script interessante?
Coloque um link para ele, e permita que outras pessoas também o avaliem
Coloque um link para ele, e permita que outras pessoas também o avaliem
Você gostou do script?
Avalie seu funcionamento no terminal MetaTrader 5
Avalie seu funcionamento no terminal MetaTrader 5

BBSqueeze Dark Indicator - indicador para MetaTrader 4

- Visualizações:
- 68189
- Avaliação:
- Publicado:
- Atualizado:
-
 Você está perdendo oportunidades de negociação:
- Aplicativos de negociação gratuitos
- 8 000+ sinais para cópia
- Notícias econômicas para análise dos mercados financeiros
Registro LoginVocê concorda com a política do site e com os termos de uso
Se você não tem uma conta, por favor registre-se -
 Precisa de um robô ou indicador baseado nesse código? Solicite-o no Freelance
Ir para Freelance
Description:
The indicator starts below the main chart window and is very simple to use.
There are 2 steps to take signals via this indicator.
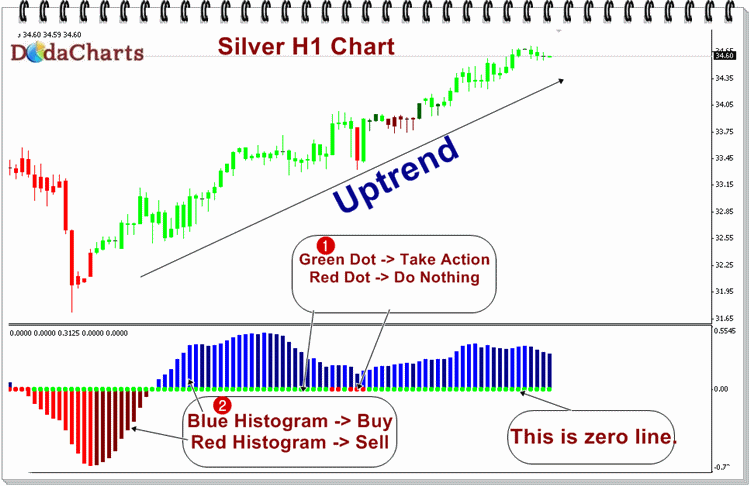
- Step 1: See the zero line. It consists of either Red dot or Green dot. If it is Green dot, it’s time to take action. Now, action (buy or sell) has been defined in step 2 below. If it’s Red dot, do nothing and stay away. Just hold your position.
- Step 2: If you see Green dot in zero line, it’s time to either Buy or Sell. For that, see the histogram lines, which are either on above zero line (blue lines) or below zero lines (red lines). Just buy on blue histogram and sell on red histogram.
In a summary, take long position when you see green dot on zero line AND blue histogram lines.
And sell your position, when you see green dot on zero line AND red histogram lines.
Recommendations:
Please note that I’m not the developer of this indicator. Just sharing with you from my indicators library. So, all the copyrights and credits goes to the original developer.
I’ve tested it on different currency pairs and time frame. It works on everywhere but gives best results on high time frame like H4. It’s always better to trade on H4 time frame to avoid volatility of the market and false signals.
You can check more examples of this indicator on my website.
 Daily Breakdown
The Expert Advisor places stop orders and waits for breakdown of the last day or time period.
VisualTrader-SimulatorEdtion
Use the tester as Simulator
Power Wave Oscillator
Power Wave Oscillator.
GoodG@bi Review
Join me to develop this project. It has been my project for 2 years now and running.