• 미리보기
  • 리뷰 (68)
  • 코멘트 (71)
  • 새 소식

Fair Value Gaps

4.86

Fair Value Gap (FVG) Indicator

Overview

The Fair Value Gap (FVG) Indicator identifies inefficiencies in price action where an imbalance occurs due to aggressive buying or selling. These gaps are often created by institutional traders and smart money, leaving areas where price may later return to "fill" the imbalance before continuing its trend.
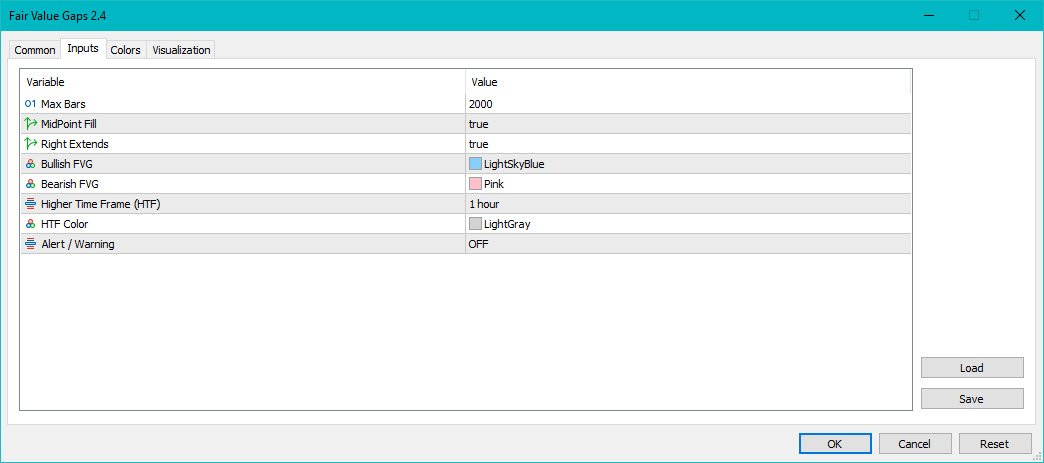
Key Features:

  • Automatic Detection of FVGs – The indicator highlights fair value gaps across different timeframes.
  • Multi-Timeframe Support – View FVGs from higher timeframes on lower timeframe charts.

How It Works:

  1. The indicator scans price movements and detects gaps where a candle’s high does not overlap with the low of two candles ahead (bullish FVG) or vice versa (bearish FVG).

  2. These areas are marked as potential liquidity zones where price may revisit before continuing in the dominant trend.

  3. The indicator assists traders in recognizing smart money footprints, combining FVG with BOS, CHoCH, and Order Blocks.

How to Trade Using FVGs:

  • Entry Strategy: Wait for price to return and react to the FVG zone (rejection, support, or resistance).
  • Confluence Trading: Combine with BOS, Order Blocks, and Liquidity Sweeps for higher accuracy.
  • Take Profit Targets: Consider the next liquidity pool or major structure level.

Who Should Use This Indicator?

  •  Smart Money & ICT Traders
  •  Price Action & Institutional Traders
  •  Scalpers & Swing Traders

리뷰 68
kareem13
109
kareem13 2025.05.26 14:38 
 

I like it it’s so helpful thank you

Gustavo Montello
18
Gustavo Montello 2025.05.24 20:20 
 

Muy bueno !!!

fxready
24
fxready 2025.05.03 09:19 
 

I like this version of FVG. It simple but meet my expectation.

추천 제품
The TrendOscillator Indicator is an upgraded version of the traditional Stochastic Oscillator.   It comprises two lines: %K and %D.   The %K line represents the current market position.   In contrast, the %D line is a moving average of the %K line used to generate signals and identify potential entry or exit points. The good thing is the indicator works on all timeframes like the traditional Stochastic.   However, to avoid any false signals, applying the indicator on longer timeframes is better
FREE
FVG Instantaneous Mitigation Signals ICT MT5 The " FVG Instantaneous Mitigation Signals " indicator for MetaTrader 5 is specifically designed to detect and highlight fair value gaps (FVGs) that are quickly mitigated. Once an FVG is identified using arrow markers, the indicator automatically plots a red Trailing Stop line on the price chart. «Indicator Installation & User Guide» MT5 Indicator Installation  |  FVG Instantaneous Mitigation Signals Indicator MT4  | ALL Products By   TradingFinderLab
FREE
Gino Renko
Stephane, Andr Valette
1 (1)
Another renko-based indicator. It returns different usable values ​​for an EA, and is directly displayed on the main chart. Its setting is very simple: The size of the renko The number of bars taken into account The falling color The color on the rise Returned values: Buffer 0 : Value of the middle Buffer 1 : Value of the Top Buffer 2 : Value of the Bottom Buffer 3 : Direction of renko (0.0 for top ; 1.0 for bottom) Buffer 4 : Ratio of the renko, for example, if it is twice, 3 times, ro more of
The indicator is an analytical tool incorporating 37 different variations of moving averages developed by authors such as Patrick Mulloy, Mark Jurik, Chris Satchwell, Alan Hull, and others. It provides the capability for historical virtual testing. The indicator can be used on various instruments, including gold, cryptocurrencies, stock indices, currency pairs, and other assets. An integrated visual backtester allows users to simulate virtual trading positions, track results, and visually assess
FREE
This Indicator is based on the Indice gaps between todays open price and yesturdays closing price. On Metatrader these are not shown as we only see a 24hr chart. If we want to know the gap between the open at 16:30 and yesturdays close at 23:30 on the SP500 this EA will reveal the gap. On Indices these types of Gap close approximately 60% of the time within the same day and is demonstrated on the panel which records previous gap closures and provides to the user a statistical proof of gaps clos
FREE
Renko Chart
Marcin Konieczny
3.56 (9)
This indicator allows to display Renko charts in the indicator window. Renko charts show only price movements that are bigger than the specified box size. It helps to eliminate noise and allows to focus on main trends. Time is not a factor here. Only price movements are taken into account. That's why Renko chart is not synchronized with the main chart it is attached to. Indicator works in two modes: CLOSE - only close prices are taken into account while building the chart HIGH_LOW - only high/l
FREE
This utility EA will display simple renko, hence the name essential renko. The renko will be shown in a new tab and using custom symbol. Please do note (especially for those who new to Renko), that Renko does not follow timeline as it will follow price movement. That's why it has a lot of potential where you can attach any EA that you want and use any custom indicator in this new custom symbol for renko. Always use M1 timeframe. Most of the time you don't need to change anything. But if you d
FREE
The DD_Profit_Monitor MT5  indicator is a trading tool developed by the Dagangduit Core Team . This indicator is designed to monitor profits in real-time with the following key features: All Time Profit : Displays the total profit earned since the beginning of the trading account's usage. This feature helps traders see the overall performance of their trading activities. Daily Profit : Displays daily profits, allowing traders to monitor their daily performance more specifically. Key Features: Al
FREE
RSI Divergence F
Andrey Dik
5 (3)
A professional tool for trading - the divergence indicator between the RSI and the price, which allows you to receive a signal about a trend reversal in a timely manner or catch price pullback movements (depending on the settings). The indicator settings allow you to adjust the strength of the divergence due to the angle of the RSI peaks and the percentage change in price, which makes it possible to fine-tune the signal strength. The indicator code is optimized and is tested very quickly as par
FREE
Zigzag Pro MT5
Kaijun Wang
5 (5)
本指标 基于 Zigzag 基础上... 增加了: 1.增加了箭头指示,使图表更鲜明 2.增加了价格显示,使大家更清楚的看清价格. 3.增加了报警等设置,可以支持邮件发送 原指标特性: 1.基本的波段指标构型. 2.最近的2个ZIGZAG点不具有稳定性,随着行情而改变,(就是网友所说的未来函数) 3.原指标适合分析历史拐点,波段特性,对于价格波动有一定的指导性. Zigzag的使用方法一 丈量一段行情的起点和终点 (1)用ZigZag标注的折点作为起点和终点之后,行情的走势方向就被确立了(空头趋势); (2)根据道氏理论的逻辑,行情会按照波峰浪谷的锯齿形运行,行情确立之后会走回撤行情,回撤的过程中ZigZag会再次形成折点,就是回撤点; (3)在回撤点选择机会进场,等待行情再次启动,止损可以放到回撤的高点。 一套交易系统基本的框架就建立起来了。 Zigzag的使用方法二 作为画趋势线的连接点 趋势线是很常见的技术指标,在技术分析中被广泛地使用。 但一直以来趋势线在实战中都存在一个BUG,那就是难以保证划线的一致性。 在图表上有很多的高低点,到底该连接哪一个呢?不同的书上画趋势线的方法
FREE
Five Minute Drive
Kenan Ozkarakas
5 (2)
"Five Minute Drive" indicator that is designed to be used in the 5 minute timeframe only. One of its most important advantages is that it shows the general trend in the upper time frames when looking at the 5-minute timeframe. Therefore, when opening positions in the 5 minute timeframe, when it is in line with the trends in the upper timeframes, you are less likely to be upside down. If you can interpret the curvilinear and linear lines drawn by this indicator on the graphic screen with your geo
FREE
IQuantum
Evgeniy Scherbina
The indicator IQuantum shows trading signals for 10 symbols in the daily chart: AUDCAD, AUDUSD, EURUSD, GBPCAD, GBPCHF, GBPUSD, NZDUSD, USDCAD, USDCHF, and USDJPY. Signals of the indicator are produced by 2 neural models which were trained independently from one another. The inputs for the neural models are normalised prices of the symbols, as well as prices of Gold, Silver and markers of the current day. Each neural model was trained in 2 ways. The Ultimate mode is an overfitted neural model
FREE
The indicator detects and displays М. Gartley's Butterfly pattern. The pattern is plotted by the extreme values of the ZigZag indicator (included in the resources, no need to install). After detecting the pattern, the indicator notifies of that by the pop-up window, a mobile notification and an email. The pattern and wave parameters are displayed on the screenshots. The default parameters are used for demonstration purposes only in order to increase the amount of detected patterns. Parameters z
Basic information. To perform its work, the indicator takes data on volumes from a lower timeframe, builds Market Profiles for a higher timeframe and a histogram for the current timeframe. The indicator starts in several stages. In this case, messages like: "Build Source & Target TF. Step: …" are output to the log. The process can be accelerated by changing the input parameter Milliseconds between steps - the initialization speed. The final value of this parameter is always individual and is set
Stat Monitor 5
Sergei Linskii
5 (1)
Stat Monitor is a good information indicator. Benefits of the indicator: The indicator provides useful information - the current spread, the cost of one lot of the symbol, trading leverage and the recommended lot size for trading. You can use the indicator on the MetaTrader 5 trading platform of any broker. The indicator provides useful information. Version of the Stat Monitor indicator for MetaTrader 4 I wish you all good luck in trading and stable profit!
FREE
ZigZag Profile
Nguyen Thanh Cong
Introducing the ZigZag Profile — a powerful tool designed to identify high-probability pivot zones where price action frequently reverses. This indicator analyzes historical price data to pinpoint key areas where price has pivoted multiple times, providing traders with actionable insights into potential support and resistance levels. The ZigZal Profile  indicator continuously scans for zones where price has reversed direction the most, highlighting these critical areas on your chart. By focusing
FREE
Commodity Channel Index Oscillator (CCI) Download MT5 The Commodity Channel Index (CCI) Oscillator is a widely used tool in technical analysis, particularly favored in the Forex and equities markets. Available for MetaTrader 5, this indicator, developed by Donald Lambert, measures the variance between the asset’s price and its moving average. Traders rely on it to determine ideal moments for entering and exiting positions and to assess potential overbought or oversold scenarios. «Indicator Insta
FREE
Follow The Line MT5
Oliver Gideon Amofa Appiah
4.52 (29)
This indicator obeys the popular maxim that: "THE TREND IS YOUR FRIEND" It paints a GREEN line for BUY and also paints a RED line for SELL. (you can change the colors). It gives alarms and alerts of all kinds. IT DOES NOT REPAINT and can be used for all currency pairs and timeframes. Yes, as easy and simple as that. Even a newbie can use it to make great and reliable trades. NB: For best results, get my other premium indicators for more powerful and reliable signals. Get them here: https://www.m
FREE
BOS and CHOCH with Label Indicator MT5  The BOS-CHOCH market structure shift detector is an advanced tool designed for traders who analyze internal price movements on the MetaTrader 5 (MT5) platform . This indicator leverages sophisticated algorithms to cater specifically to traders following ICT (Inner Circle Trader) and Smart Money trading methods . It automatically detects Break of Structure (BOS) and Change of Character (CHOCH) and marks them on the chart with clearly labeled annotations. A
FREE
Spire
Sergey Ponomarev
Spire - показывает трендовый, сигнальный, свечной прорыв в сторону верхней или нижней границы канала, а так же временную или долгую консолидацию в виде прямоугольного канала. Сигналы тренда не перерисовываются. В основу идеи индикатора входит  Bollinger  Bands.  Изменяемые параметры Signal trend -изменение цветовой гаммы сигнального символа тренда Lower limit - изменение цветовой гаммы нижней границы канала Upper limit - изменение цветовой гаммы верхней границы канала Internal field -изменение ц
FREE
Indicator details The Moving Average Retracement Boundaries(M.A.R.B) shows the average retracement level above or below the given moving average.It shows the first upper boundary (which is the average retracement above the moving average ),the second upper boundary (which is double the first upper boundary),the first lower boundary (which is the average retracement below the moving average) and the second lower boundary (which is double the first lower boundary). How to use it 1.It can be used
FREE
HMA Color with Alerts MT5
Pavel Zamoshnikov
4.73 (52)
Hull Moving Average (HMA) is well-deservedly popular among traders because of the effective averaging of market noise and a relatively small delay. The current MetaTrader 5 version changes its color when the movement direction changes. Sound and text signals are available. It also supports sending email and push messages. It is possible to trigger a signal on the current incomplete bar, although such a signal may be canceled before completion if conditions are no longer appropriate. One of the p
FREE
MAs crossing
Roman Ogorodnikov
The indicator draws three Moving Averages. Two short ones cross a long one. At the same time, the long MA changes color: If both short MAs are above the long one - first color; If both short MAs are below the long one - second color; If the two short MAs are on opposite sides of the long one - third color. All three MAs are based on closing prices with a smoothing method of "simple." cross MA cross 3 MA cross three Moving Average across Moving cross Moving crossing  MA crossing MA across MA
FREE
This indicator is a zero-lag indicator and displays  strength of trend change . True Trend  Oscillator Pro works best in combination with True Trend Moving Average Pro that displays exact trend as is. Oscillator value is exact price change in given direction of the trend. True Trend Moving Average Pro: https://www.mql5.com/en/market/product/103586 If you set PERIOD input parameter to 1 this indicator becomes a sharpshooter for binary options. Developers can use True Trend Oscillator in Exper
FREE
Important Lines
Terence Gronowski
4.86 (21)
This indicator displays Pivot-Lines, preday high and low, preday close and the minimum and maximum of the previous hour. You just have to put this single indicator to the chart to have all these important lines, no need to setup many single indicators. Why certain lines are important Preday high and low : These are watched by traders who trade in a daily chart. Very often, if price climbs over or falls under a preday low/high there is an acceleration in buying/selling. It is a breakout out of a
FREE
PZ Inside Bars MT5
PZ TRADING SLU
4.5 (12)
Enhance your price action strategy: inside bar breakouts at your fingertips This indicator detects inside bars of several ranges, making it very easy for price action traders to spot and act on inside bar breakouts. [ Installation Guide | Update Guide | Troubleshooting | FAQ | All Products ] Easy to use and understand Customizable color selections The indicator implements visual/mail/push/sound alerts The indicator does not repaint or backpaint An inside bar is a bar or series of bars which is/a
FREE
Statistical Arbitrage Spread Generator for Cointegration [MT5] What is Pair Trading? Pair trading is a market-neutral strategy that looks to exploit the relative price movement between two correlated assets — instead of betting on the direction of the market. The idea? When two assets that usually move together diverge beyond a statistically significant threshold, one is likely mispriced. You sell the expensive one, buy the cheap one , and profit when they converge again. It’s a statistica
FREE
Heiken Ashi fxam
Ely Alsedy
5 (1)
헤이킨 아시 MT5 인디케이터 헤이킨 아시 MT5 인디케이터는 표준 가격 데이터를 더 부드럽고 추세 중심의 캔들스틱으로 변환하여 시장 트렌드와 잠재적인 역전 지점을 더 쉽게 식별할 수 있도록 하는 강력한 도구입니다. 주요 특징: 명확한 트렌드 식별: 다른 캔들 색상으로 상승 추세와 하락 추세를 시각적으로 구분합니다. 노이즈 감소: 가격 변동을 필터링하여 시장의 주요 움직임을 더 명확하게 표시합니다. 조기 트렌드 감지: 표준 차트에서 트렌드 변화가 명확해지기 전에 잠재적인 트렌드 변화를 예측합니다. 다용도성: 독립적으로 사용하거나 다른 기술적 지표와 함께 종합적인 분석에 사용할 수 있습니다. 사용자 정의 설정: 인디케이터를 특정 거래 선호도와 전략에 맞게 조정할 수 있습니다. 장점: 트렌드를 식별하고 잠재적인 진입 및 청산 지점을 파악하는 능력을 향상시킵니다. 시장 노이즈의 영향을 줄이고 중요한 가격 변동에 집중합니다. 시장 역학에 대한 더 명확한 이해를 바탕으로 더 나은 거래 결정
FREE
The indicator identifies when a divergence occurs between price and an indicator or oscillator. It identifies both regular and hidden divergences. Combined with your own rules and techniques, this indicator will allow you to create (or enhance) your own powerful system. For higher probability setups I can recommend you to use my Supply Demand indicator and trade only if the divergence occurs inside a zone. Supply zone for bearish div and demand zone for bullish div. The optimal scenario is if it
FREE
Order Book, known also as Market Book, market depth, Level 2, - is a dynamically updated table with current volumes of orders to buy and to sell specific financial instument at price levels near Bid and Ask. MetaTrader 5 provides the means for receiving market book from your broker, but in real time only, without access to its history. The indicator OrderBook Cumulative Indicator accumulates market book data online and visualizes them on the chart. In addition, the indicator can show the market
이 제품의 구매자들이 또한 구매함
Divergence Bomber
Ihor Otkydach
5 (37)
이 지표를 구매하신 분께는 다음과 같은 혜택이 무료로 제공됩니다: 각 거래를 자동으로 관리하고, 손절/익절 수준을 설정하며, 전략 규칙에 따라 거래를 종료하는 전용 도우미 툴 "Bomber Utility" 다양한 자산에 맞게 지표를 설정할 수 있는 셋업 파일(Set Files) "최소 위험", "균형 잡힌 위험", "관망 전략" 모드로 설정 가능한 Bomber Utility의 셋업 파일 이 전략을 빠르게 설치, 설정, 시작할 수 있도록 돕는 단계별 영상 매뉴얼 주의: 위의 모든 보너스를 받기 위해서는 MQL5 개인 메시지 시스템을 통해 판매자에게 연락해 주세요. 독창적인 커스텀 지표인 “Divergence Bomber(다이버전스 봄버)”를 소개합니다. 이 지표는 MACD 다이버전스(괴리) 전략을 기반으로 한 올인원(All-in-One) 거래 시스템입니다. 이 기술 지표의 주요 목적은 가격과 MACD 지표 간의 다이버전스를 감지하고, **향후 가격이 어느 방향으로 움직일지를 알려주는
Algo Pumping
Ihor Otkydach
5 (17)
PUMPING STATION – 당신만을 위한 올인원(All-in-One) 전략 PUMPING STATION은 당신의 외환 거래를 더욱 흥미롭고 효과적으로 바꿔줄 혁신적인 인디케이터입니다. 단순한 보조 도구가 아니라, 강력한 알고리즘을 갖춘 완전한 거래 시스템으로서 보다 안정적인 트레이딩을 시작할 수 있도록 도와줍니다. 이 제품을 구매하시면 다음의 혜택을 무료로 받으실 수 있습니다: 전용 설정 파일: 자동 설정으로 최대의 퍼포먼스를 제공합니다. 단계별 동영상 가이드: PUMPING STATION 전략으로 거래하는 법을 배워보세요. Pumping Utility: PUMPING STATION과 함께 사용하도록 설계된 반자동 거래 봇으로, 거래를 더욱 쉽고 편리하게 만들어줍니다. ※ 구매 후 바로 저에게 메시지를 보내주세요. 추가 자료에 대한 접근 권한을 제공해드립니다. PUMPING STATION은 어떻게 작동하나요? 트렌드 컨트롤: 시장의 추세 방향을 즉시 파악합니다. 추세는 최고의
Trend Screener Pro MT5
STE S.S.COMPANY
4.85 (85)
트렌드 표시기, 트렌드 트레이딩 및 필터링을 위한 획기적인 고유 솔루션, 하나의 도구 안에 내장된 모든 중요한 트렌드 기능! Forex, 상품, 암호 화폐, 지수 및 주식과 같은 모든 기호/도구에 사용할 수 있는 100% 다시 칠하지 않는 다중 시간 프레임 및 다중 통화 표시기입니다. Trend Screener는 차트에 점이 있는 화살표 추세 신호를 제공하는 효율적인 지표 추세 추종 지표입니다. 추세 분석기 표시기에서 사용할 수 있는 기능: 1. 트렌드 스캐너. 2. 최대 이익 분석이 있는 추세선. 3. 추세 통화 강도 측정기. 4. 경고가 있는 추세 반전 점. 5. 경고가 있는 강력한 추세 점. 6. 추세 화살표 Trend Screener Indicator가 있는 일일 분석 예, 일일 신호 성능...등은 여기에서 찾을 수 있습니다. 여기를 클릭하십시오. LIMITED TIME OFFER : Trend Screener Indicator는 50$ 및 평생 동안만 사용할 수 있습니다.
Gold Stuff mt5
Vasiliy Strukov
4.93 (187)
Gold Stuff mt5는 금을 위해 특별히 설계된 추세 지표이며 모든 금융 상품에서도 사용할 수 있습니다. 표시기가 다시 그려지지 않고 지연되지 않습니다. 권장 기간 H1. 설정 및 개인 보너스를 받으려면 구매 후 즉시 저에게 연락하십시오!     강력한 지원 및 트렌드 스캐너 표시기의 무료 사본을 받으실 수 있습니다. 메시지를 보내주세요. 나!   설정 화살표 그리기 - 켜기 끄기. 차트에 화살표 그리기. 경고 - 가청 경고를 끕니다. 이메일 알림 - 켜기 끄기. 이메일 알림. Puch-notification - 켜기 끄기. 푸시 알림. 다음으로 색 영역을 조정합니다. Gold Stuff mt5는 금을 위해 특별히 설계된 추세 지표이며 모든 금융 상품에서도 사용할 수 있습니다. 표시기가 다시 그려지지 않고 지연되지 않습니다. 권장 기간 H1. 설정 및 개인 보너스를 받으려면 구매 후 즉시 저에게 연락하십시오!   설정 화살표 그리기 - 켜기 끄기. 차트에 화살표 그
Grabber System MT5
Ihor Otkydach
5 (10)
탁월한 기술적 지표인 Grabber를 소개합니다. 이 도구는 즉시 사용 가능한 “올인원(All-Inclusive)” 트레이딩 전략으로 작동합니다. 하나의 코드 안에 강력한 시장 기술 분석 도구, 매매 신호(화살표), 알림 기능, 푸시 알림이 통합되어 있습니다. 이 인디케이터를 구매하신 모든 분들께는 다음의 항목이 무료로 제공됩니다: Grabber 유틸리티: 오픈 포지션을 자동으로 관리하는 도구 단계별 영상 매뉴얼: 설치, 설정, 그리고 실제 거래 방법을 안내 맞춤형 세트 파일: 인디케이터를 빠르게 자동 설정하여 최고의 성과를 낼 수 있도록 도와줍니다 다른 전략은 이제 잊어버리세요! Grabber만이 여러분을 새로운 트레이딩의 정점으로 이끌어 줄 수 있습니다. Grabber 전략의 주요 특징: 거래 시간 프레임: M5부터 H4까지 거래 가능한 자산: 어떤 자산이든 사용 가능하지만, 제가 직접 테스트한 종목들을 추천드립니다 (GBPUSD, GBPCAD, GBPCHF, AUDCAD, AU
*** Entry In The Zone and SMC Multi Timeframe 은 Smart Money Concept (SMC)을 기반으로 한 실시간 시장 분석 도구 입니다. 이 도구는 반전 신호 와 **다중 시간대 구조 감지(Multi-Timeframe Structure Detection)**를 통합하여 주요 반전 구역(POI)을 자동으로 식별합니다. 이를 통해 트레이더가 더 체계적이고 자신감 있게 거래 계획과 결정을 내릴 수 있도록 지원 합니다. 주요 기능: - 자동 시장 구조 감지 (BOS  CHoCH, mBOS  mCHoCH) - Order Blocks, 공급 & 수요 구역, Fair Value Gaps (FVG) 식별 - 유동성 구역, Premium  Discount 영역, Equal Highs  Equal  Lows - 주요 관심 구역 (POI) - 거래 세션 시간 분석 (도쿄, 런던, 뉴욕) - 사용자 맞춤 자동 -계산 및 하이라이팅대시보드 -  신호 재도색 없음!
RelicusRoad Pro MT5
Relicus LLC
5 (20)
훌륭한 백테스트, 환상적인 숫자로 입증된 실제 계정 성능, 그리고 모든 곳에 퍼져 있는 통계를 자랑하는 트레이딩 지표를 얼마나 자주 구매하셨습니까? 하지만 사용 후에는 결국 계좌를 날려버리셨나요? 신호 자체만으로는 신뢰할 수 없습니다. 신호가 왜 처음 나타났는지 알아야 하며, 그것이 바로 RelicusRoad Pro가 가장 잘하는 일입니다! 사용자 매뉴얼 + 전략 + 교육 비디오 + VIP 액세스 전용 그룹 + 모바일 버전 사용 가능 시장을 보는 새로운 방법 RelicusRoad는 외환, 선물, 암호화폐, 주식 및 지수를 위한 세계에서 가장 강력하고 최고의 트레이딩 지표 로서, 트레이더가 계좌를 성장시키는 데 필요한 모든 정보와 도구를 제공합니다. 우리는 기술 분석 및 트레이딩 계획 을 제공하여 초보자 부터 고급 트레이더 까지 모든 트레이더가 성공할 수 있도록 돕습니다. 이것은 미래 시장을 예측 하는 데 충분한 정보를 제공하는 핵심 트레이딩 지표 입니다. 우리는 차트에서 의미 없
FX Volume MT5
Daniel Stein
4.84 (19)
FX Volume: 브로커 시각에서 바라보는 진짜 시장 심리 간단 요약 트레이딩 접근 방식을 한층 더 향상시키고 싶으신가요? FX Volume 는 소매 트레이더와 브로커의 포지션을 실시간으로 파악할 수 있게 해 줍니다. 이는 COT 같은 지연된 보고서보다 훨씬 빠릅니다. 꾸준한 수익을 추구하는 분이든, 시장에서 더 깊은 우위를 원하시는 분이든, FX Volume 을 통해 대규모 불균형을 찾아내고, 돌파 여부를 확인하며 리스크 관리를 정교화할 수 있습니다. 지금 시작해 보세요! 실제 거래량 데이터가 의사결정을 어떻게 혁신할 수 있는지 직접 경험해 보시기 바랍니다. 1. 트레이더에게 FX Volume이 매우 유익한 이유 탁월한 정확도를 지닌 조기 경보 신호 • 다른 사람들보다 훨씬 앞서, 각 통화쌍을 매수·매도하는 트레이더 수를 거의 실시간으로 파악할 수 있습니다. • FX Volume 은 여러 리테일 브로커에서 추출한 실제 거래량 데이터를 종합해 명확하고 편리한 형태로 제공하는
FX Power MT5 NG
Daniel Stein
5 (17)
FX Power: 통화 강세 분석으로 더 스마트한 거래 결정을 개요 FX Power 는 어떤 시장 상황에서도 주요 통화와 금의 실제 강세를 이해하기 위한 필수 도구입니다. 강한 통화를 매수하고 약한 통화를 매도함으로써 FX Power 는 거래 결정을 단순화하고 높은 확률의 기회를 발견합니다. 트렌드를 따르거나 극단적인 델타 값을 사용해 반전을 예측하고자 한다면, 이 도구는 귀하의 거래 스타일에 완벽히 적응합니다. 단순히 거래하지 말고, FX Power 로 더 스마트하게 거래하세요. 1. FX Power가 거래자에게 매우 유용한 이유 통화와 금의 실시간 강세 분석 • FX Power 는 주요 통화와 금의 상대적 강세를 계산하고 표시하여 시장 역학에 대한 명확한 통찰력을 제공합니다. • 어떤 자산이 앞서고 있고 어떤 자산이 뒤처지는지 모니터링하여 보다 현명한 거래 결정을 내릴 수 있습니다. 포괄적인 멀티 타임프레임 뷰 • 단기, 중기 및 장기 타임프레임에서 통화와 금의 강세를
Support And Resistance Screener는 하나의 지표 안에 여러 도구를 제공하는 MetaTrader에 대한 하나의 레벨 지표입니다. 사용 가능한 도구는 다음과 같습니다. 1. 시장 구조 스크리너. 2. 완고한 후퇴 영역. 3. 약세 후퇴 영역. 4. 일일 피벗 포인트 5. 주간 피벗 포인트 6. 월간 피벗 포인트 7. 고조파 패턴과 볼륨에 기반한 강력한 지지와 저항. 8. 은행 수준 구역. LIMITED TIME OFFER : HV 지원 및 저항 표시기는 50 $ 및 평생 동안만 사용할 수 있습니다. ( 원래 가격 125$ ) MQL5 블로그에 액세스하면 분석 예제와 함께 모든 프리미엄 지표를 찾을 수 있습니다. 여기를 클릭하십시오. 주요 특징들 고조파 및 볼륨 알고리즘을 기반으로 하는 강력한 지원 및 저항 영역. Harmonic 및 Volume 알고리즘을 기반으로 한 강세 및 약세 풀백 영역. 시장 구조 스크리너 일간, 주간 및 월간 피벗 포인트. 실제 거래의
Matrix Arrow Indicator MT5
Juvenille Emperor Limited
5 (14)
매트릭스 화살표 표시기 MT5 는 외환, 상품, 암호 화폐, 지수, 주식과 같은 모든 기호/도구에 사용할 수 있는 100% 다시 칠하지 않는 다중 기간 표시기를 따르는 고유한 10 in 1 추세입니다.  Matrix Arrow Indicator MT5 는 다음과 같은 최대 10개의 표준 지표에서 정보와 데이터를 수집하여 초기 단계에서 현재 추세를 결정합니다. 평균 방향 이동 지수(ADX) 상품 채널 지수(CCI) 클래식 하이켄 아시 캔들 이동 평균 이동 평균 수렴 발산(MACD) 상대 활력 지수(RVI) 상대 강도 지수(RSI) 포물선 SAR 스토캐스틱 오실레이터 윌리엄스의 백분율 범위 모든 지표가 유효한 매수 또는 매도 신호를 제공하면 강력한 상승/하락 추세를 나타내는 다음 캔들/막대가 시작될 때 해당 화살표가 차트에 인쇄됩니다. 사용자는 사용할 표시기를 선택하고 각 표시기의 매개변수를 개별적으로 조정할 수 있습니다. 매트릭스 화살표 표시기 MT5는 선택한 표시기에서만 정보를 수
FX Levels MT5
Daniel Stein
5 (5)
FX Levels: 모든 시장을 위한 뛰어난 정확도의 지지와 저항 간단 요약 통화쌍, 지수, 주식, 원자재 등 어떤 시장이든 믿을 만한 지지·저항 레벨을 찾고 싶나요? FX Levels 는 전통적인 “Lighthouse” 기법과 첨단 동적 접근을 결합해, 거의 보편적인 정확성을 제공합니다. 실제 브로커 경험을 반영하고, 자동화된 일별 업데이트와 실시간 업데이트를 결합함으로써 FX Levels 는 가격 반전 포인트를 파악하고, 수익 목표를 설정하며, 자신 있게 트레이드를 관리할 수 있게 돕습니다. 지금 바로 시도해 보세요—정교한 지지/저항 분석이 어떻게 여러분의 트레이딩을 한 단계 끌어올릴 수 있는지 직접 확인하세요! 1. FX Levels가 트레이더에게 매우 유용한 이유 뛰어난 정확도의 지지·저항 존 • FX Levels 는 다양한 브로커 환경에서도 거의 동일한 존을 생성하도록 설계되어, 데이터 피드나 시간 설정 차이로 인한 불일치를 해소합니다. • 즉, 어떤 브로커를 사용하
This indicator is based on the mathematics of the great trader W.D. Ganna. With its help, you can easily find strong levels by analyzing swings to find the optimal entry point. The indicator works on all instruments and all timeframes. The indicator is fully manual and has control buttons. All you need to do is press the NEW button, a segment will appear, which you can place on any movement, swing or even 1 candle that you want to analyze. By placing the segment, press the OK button. A grid (th
Berma Bands
Muhammad Elbermawi
5 (4)
Berma Bands(BBs) 지표는 시장 동향을 파악하고 이를 활용하려는 트레이더에게 귀중한 도구입니다. 가격과 BBs 간의 관계를 분석함으로써 트레이더는 시장이 추세 단계인지 범위 단계인지를 분별할 수 있습니다. 자세한 내용을 알아보려면 [ Berma Home Blog ]를 방문하세요. 버마 밴드는 세 개의 뚜렷한 선으로 구성되어 있습니다. 어퍼 버마 밴드, 미들 버마 밴드, 로어 버마 밴드입니다. 이 선들은 가격 주위에 그려져 전체 추세에 대한 가격 움직임을 시각적으로 표현합니다. 이 밴드들 사이의 거리는 변동성과 잠재적인 추세 반전에 대한 통찰력을 제공할 수 있습니다. 버마 밴드 라인이 각각에서 분리될 때, 그것은 종종 시장이 횡보 또는 범위 이동 기간에 접어들고 있음을 시사합니다. 이는 명확한 방향 편향이 없음을 나타냅니다. 트레이더는 이러한 기간 동안 추세를 파악하기 어려울 수 있으며 더 명확한 추세가 나타날 때까지 기다릴 수 있습니다. 버마 밴드 라인이 단일 라인으로
IX Power MT5
Daniel Stein
4.88 (8)
IX Power: 지수, 원자재, 암호화폐 및 외환 시장 통찰력을 발견하세요 개요 IX Power 는 지수, 원자재, 암호화폐 및 외환 시장의 강도를 분석할 수 있는 다목적 도구입니다. FX Power 는 모든 가용 통화 쌍 데이터를 사용하여 외환 쌍에 대해 가장 높은 정확도를 제공하는 반면, IX Power 는 기초 자산 시장 데이터에만 초점을 맞춥니다. 이로 인해 IX Power 는 비외환 시장에 이상적이며, 다중 쌍 분석이 필요하지 않은 간단한 외환 분석에도 신뢰할 수 있는 도구입니다. 모든 차트에서 매끄럽게 작동하며, 거래 결정을 향상시키기 위한 명확하고 실행 가능한 통찰력을 제공합니다. 1. IX Power가 트레이더에게 유용한 이유 다양한 시장 강도 분석 • IX Power 는 지수, 원자재, 암호화폐 및 외환 심볼의 강도를 계산하여 각 시장에 맞는 통찰력을 제공합니다. • US30, WTI, 금, 비트코인 또는 통화 쌍과 같은 자산을 모니터링하여 거래 기회를 발견
Enigmera MT5
Ivan Stefanov
3.67 (3)
ENIGMERA: 시장의 핵심 소개 이 지표 및 트레이딩 시스템은 금융 시장에 대한 놀라운 접근 방식을 제공합니다. ENIGMERA는 프랙탈 사이클을 사용하여 지지선과 저항선을 정확하게 계산합니다. 진정한 누적 구간을 표시하고 방향과 목표를 제시합니다. 추세든 조정장이든 상관없이 작동하는 시스템입니다. 작동 원리 지표의 대부분 기능은 차트 왼쪽에 있는 버튼으로 제어되며, 다양한 시장 상황에 빠르게 대응할 수 있습니다. 버튼 설명 ON/OFF – 지표 전체를 표시하거나 숨깁니다. Support – 추세의 주요 지지선입니다. Ch – 지지 채널을 활성화하여 허용 오차 범위를 나타냅니다. Dev1 (첫 번째 편차) – 지지선 편차 내에서 가격 움직임을 표시하여 시장 불확실기나 세력 누적을 나타냅니다. Dev2 (두 번째 편차) – 편차 사이에서의 가격 움직임을 표시하여 추세 형성과 방향을 시사합니다. Dev3 (세 번째 편차) – 강한 추세 가속과 높은 변동성을 나타냅니다. 45deg
The indicator is designed to work on any trading platform. The program is based on proprietary algorithms and W.D.Ganna's mathematics, allowing you to calculate target levels of price movement based on three points with the highest degree of certainty. It is a great tool for stock trading. The indicator has three buttons: NEW - call up a triangle for calculation. DEL - delete the selected triangle. DELS - completely remove all constructions. The probability of achieving the goals is more than 80
Transaction Speed MT5
Ivan Stefanov
5 (1)
이 지표는 시장에서 관심이 나타나는 영역 을 강조 표시한 후, 주문이 누적되는 영역 을 보여줍니다. 이는 **대규모 오더북(호가창)**처럼 작동합니다. 이것은 거대한 자금 을 위한 인디케이터입니다. 성능은 탁월하며, 시장에서 어떤 관심이 있든 반드시 포착할 수 있습니다 . (이것은 완전히 새로 작성되고 자동화된 버전 입니다 – 이제 수동 분석은 필요하지 않습니다.) **거래 속도(Transaction Speed)**는 새로운 개념의 인디케이터로, 시장에 대규모 주문이 언제, 어디에 쌓이는지를 보여주며 , 그 이점을 분석합니다. 매우 초기 단계에서 트렌드 전환 을 감지할 수 있습니다. FX 시장에서 흔히 사용하는 "거래량(volume)"은 오해입니다. 실제로는 시간당 가격 변화량 이므로, 올바른 용어는 거래 속도 입니다. 우리가 어떻게 사고하고, 행동하며, 분석하느냐 가 가장 중요합니다. 분석 패러다임의 전환 은 필수적입니다. 이 인디케이터는 외환 시장에서의 볼륨 개념을 논리적으로
ACB Breakout Arrows MT5
KEENBASE SOFTWARE SOLUTIONS
5 (1)
ACB Breakout Arrows 지표는 특별한 돌파 패턴을 감지하여 시장에서 중요한 진입 신호를 제공합니다. 이 지표는 차트를 지속적으로 스캔하면서 한 방향으로 움직임이 자리 잡을 때를 포착하여 큰 움직임 직전에 정확한 진입 신호를 제공합니다. 다중 종목 및 다중 시간대 스캐너는 여기에서 확인하세요 - ACB Breakout Arrows MT5용 스캐너 핵심 기능 지표가 자동으로 손절(Stop Loss) 및 익절(Take Profit) 수준을 제공합니다. 모든 시간대의 돌파 신호를 추적하는 MTF 스캐너 대시보드 포함. 데이 트레이더, 스윙 트레이더 및 스캘퍼에게 적합합니다. 신호 정확도를 높이기 위해 최적화된 알고리즘 사용. 손익분기점 또는 빠른 수익 목표를 위한 특별한 라인 (Quick Profit Line) 제공. 승률, 성공 비율, 평균 수익 등의 성과 분석 지표 제공. 재도색 없음. 신호는 고정되어 신뢰할 수 있습니다. 거래 확인 - ACB Trade Filter 지
Trend Forecaster
Alexey Minkov
5 (7)
The Trend Forecaster indicator utilizes a unique proprietary algorithm to determine entry points for a breakout trading strategy. The indicator identifies price clusters, analyzes price movement near levels, and provides a signal when the price breaks through a level. The Trend Forecaster indicator is suitable for all financial assets, including currencies (Forex), metals, stocks, indices, and cryptocurrencies. You can also adjust the indicator to work on any time frames, although it is recommen
Bill Williams Advanced
Siarhei Vashchylka
5 (10)
Bill Williams Advanced is designed for automatic chart analysis using Bill Williams' "Profitunity" system. The indicator analyzes four timeframes at once. Manual (Be sure to read before purchasing) Advantages 1. Automatically analyzes the chart using the "Profitunity" system of Bill Williams. The found signals are placed in a table in the corner of the screen. 2. Equipped with a trend filter based on the Alligator indicator. Most of the system signals are recommended to be used only according t
Quantum TrendPulse
Bogdan Ion Puscasu
5 (14)
SuperTrend   ,   RSI   ,   Stochastic   의 힘을 하나의 포괄적인 지표로 결합하여 트레이딩 잠재력을 극대화하는 궁극의 트레이딩 도구   인 Quantum TrendPulse를   소개합니다. 정밀성과 효율성을 추구하는 트레이더를 위해 설계된 이 지표는 시장 추세, 모멘텀 변화, 최적의 진입 및 종료 지점을 자신 있게 식별하는 데 도움이 됩니다. 주요 특징: SuperTrend 통합:   주요 시장 추세를 쉽게 따라가고 수익성의 물결을 타세요. RSI 정밀도:   매수 과다 및 매도 과다 수준을 감지하여 시장 반전 시점을 파악하는 데 적합하며 SuperTrend 필터로 사용 가능 확률적 정확도:   변동성이 큰 시장에서 숨겨진 기회를 찾기 위해 확률적 진동   을 활용하고 SuperTrend의 필터로 사용 다중 시간대 분석:   M5부터 H1 또는 H4까지 다양한 시간대에 걸쳐 시장을 최신 상태로 유지하세요. 맞춤형 알림:   맞춤형 거래 조건이 충족되면
Gartley Hunter Multi
Siarhei Vashchylka
5 (10)
Gartley Hunter Multi - An indicator for searching for harmonic patterns simultaneously on dozens of trading instruments and on all possible timeframes. Manual (Be sure to read before purchasing) | Version for MT4 Advantages 1. Patterns: Gartley, Butterfly, Shark, Crab. Bat, Alternate Bat, Deep Crab, Cypher 2. Simultaneous search for patterns on dozens of trading instruments and on all possible timeframes 3. Search for patterns of all possible sizes. From the smallest to the largest 4. All fou
MonetTrend
Aliya Bolek
MonetTrend — Премиум-индикатор для торговли по тренду (M30, H1, H4) MonetTrend — это мощный и визуально понятный трендовый индикатор, созданный для торговли на таймфреймах M30, H1 и H4. Он идеально подходит для работы с волатильными инструментами, такими как: • Золото (XAUUSD) • Криптовалюты (BTCUSD) • Валютные пары (EURUSD, USDJPY и др.) Ключевые особенности MonetTrend: • Автоматическое отображение Take Profit 1 (TP1) и Stop Loss (SL): После появления сигнала индикатор сразу показывает: • TP
TPSpro RFI Levels MT5
Roman Podpora
4.55 (20)
주요 플레이어의 반전 구역 / 피크 볼륨 / 활성 구역 =       TS TPS프로시스템 지침 RUS       /       지침       영어       /           버전 MT4        이 지표를 구매한 모든 구매자는 또한 다음을 무료로 받습니다. RFI SIGNALS 서비스의 거래 신호에 6개월 동안 액세스할 수 있습니다. TPSproSYSTEM 알고리즘에 따른 즉시 사용 가능한 진입 포인트입니다. 정기적으로 업데이트되는 교육 자료 - 전략에 푹 빠져서 전문가 수준을 높여보세요. 주중 24/5 지원 및 비공개 트레이더 채팅 이용 - 시장 상황에 대한 소통, 지원 및 분석. 저자가 설정한 파일 - 별도의 노력 없이 최대 결과를 얻을 수 있도록 지표를 자동으로 설정합니다. 주요 기능: 판매자와 구매자의 활동 영역을 표시합니다! 이 지표는 매수 및 매도에 대한 모든 올바른 첫 번째 임펄스 레벨/존을 표시합니다. 진입점 검색이 시작되는 이러한 레벨/존이 활성화되면
소개       Quantum Breakout PRO   , 브레이크아웃 존 거래 방식을 변화시키는 획기적인 MQL5 지표! 13년 이상의 거래 경험을 가진 숙련된 트레이더 팀이 개발한       퀀텀 브레이크아웃 PRO       혁신적이고 역동적인 브레이크아웃 존 전략으로 거래 여정을 새로운 차원으로 끌어올리도록 설계되었습니다. Quantum Breakout Indicator는 5개의 이익 목표 영역이 있는 브레이크아웃 영역의 신호 화살표와 브레이크아웃 상자를 기반으로 한 손절 제안을 제공합니다. 초보자 거래자와 전문 거래자 모두에게 적합합니다. Quantum EA 채널:       여기를 클릭하세요 중요한! 구매 후 설치 매뉴얼을 받으려면 개인 메시지를 보내주십시오. 추천: 기간: M15 통화쌍: GBPJPY, EURJPY, USDJPY,NZDUSD, XAUUSD 계정 유형: 스프레드가 매우 낮은 ECN, Raw 또는 Razor 브로커 시간: GMT +3 중개인 :
TPSproTREND PrO MT5
Roman Podpora
4.72 (18)
VERSION MT4        —        ИНСТРУКЦИЯ RUS           —        INSTRUCTIONS  ENG 주요 기능: 렌더링 없이 정확한 입력 신호! 신호가 나타나면 관련성은 유지됩니다! 이는 신호를 제공한 후 변경하여 예금 자금 손실을 초래할 수 있는 다시 그리기 지표와의 중요한 차이점입니다. 이제 더 큰 확률과 정확도로 시장에 진입할 수 있습니다. 화살표가 나타난 후 목표에 도달(이익실현)하거나 반전 신호가 나타날 때까지 캔들을 색칠하는 기능도 있습니다. STOP LOSS / TAKE PROFIT 구역 표시 진입점 검색 시 시각적 명확성을 높이기 위해 시장 진입을 위한 최적 지점이 검색되는 BUY/SELL 영역을 초기에 표시하는 모듈을 만들었습니다. 정지 손실 수준 작업을 위한 추가 지능형 논리는 시간이 지남에 따라 크기를 줄이는 데 도움이 되므로 거래에 들어갈 때 초기 위험을 줄이는 데 도움이 됩니다(move sl). 더 높은 기간의 MIN
Atbot
Zaha Feiz
4.65 (48)
AtBot: 작동 방식 및 사용 방법 ### 작동 방식 MT5 플랫폼용 "AtBot" 지표는 기술 분석 도구의 조합을 사용하여 매수 및 매도 신호를 생성합니다. 01:37 단순 이동 평균(SMA), 지수 이동 평균(EMA), 평균 진폭 범위(ATR) 지수를 통합하여 거래 기회를 식별합니다. 또한 Heikin Ashi 캔들을 사용하여 신호의 정확성을 향상시킬 수 있습니다. 구매 후 리뷰를 남기면 특별 보너스 선물을 받게 됩니다. ### 주요 기능: - 비재표시: 신호는 플로팅 후 변경되지 않습니다. - 비재작성: 신호는 일관되며 변경되지 않습니다. - 지연 없음: 지연 없이 시기적절한 신호를 제공합니다. - 다양한 시간대: 거래 전략에 맞게 모든 시간대에서 사용할 수 있습니다. ### 운영 단계: #### 입력 및 설정: - firstkey (TrendValue): 추세 감지의 민감도를 조정합니다. - Secondkey (SignalValue): 매수/매도 신호 생성의 민감도를 정의
우선 이 거래 시스템이 리페인팅, 리드로잉 및 레이그 인디케이터가 아니라는 점을 강조하는 것이 중요합니다. 이는 수동 및 로봇 거래 모두에 이상적인 것으로 만듭니다. 온라인 강좌, 설명서 및 프리셋 다운로드. "스마트 트렌드 트레이딩 시스템 MT5"은 새로운 및 경험이 풍부한 트레이더를 위해 맞춤형으로 제작된 종합적인 거래 솔루션입니다. 10개 이상의 프리미엄 인디케이터를 결합하고 7개 이상의 견고한 거래 전략을 특징으로 하여 다양한 시장 조건에 대한 다목적 선택이 가능합니다. 트렌드 추종 전략: 효과적인 트렌드 추이를 타기 위한 정확한 진입 및 손절 관리를 제공합니다. 반전 전략: 잠재적인 트렌드 반전을 식별하여 트레이더가 범위 시장을 활용할 수 있게 합니다. 스캘핑 전략: 빠르고 정확한 데이 트레이딩 및 단기 거래를 위해 설계되었습니다. 안정성: 모든 인디케이터가 리페인팅, 리드로잉 및 레이그가 아니므로 신뢰할 수 있는 신호를 보장합니다. 맞춤화: 개별 거래 선호도를 고려한 맞춤
Entry Points Pro for MT5
Yury Orlov
4.46 (130)
다시 색을 칠하지 않고 거래에 진입할 수 있는 정확한 신호를 제공하는 MT5용 지표입니다. 외환, 암호화폐, 금속, 주식, 지수 등 모든 금융 자산에 적용할 수 있습니다. 매우 정확한 추정값을 제공하고 매수와 매도의 가장 좋은 시점을 알려줍니다. 하나의 시그널로 수익을 내는 지표의 예와 함께 비디오 (6:22)시청하십시오! 대부분의 거래자는 Entry Points Pro 지표의 도움으로 첫 거래 주 동안 트레이딩 결과를 개선합니다. 저희의   Telegram Group 을 구독하세요! Entry Points Pro 지표의 좋은점. 재도색이 없는 진입 신호 신호가 나타나고 확인되면(시그널 캔들이 완성된 경우) 신호는 더 이상 사라지지 않습니다. 여타 보조지표의 경우 신호를 표시한 다음 제거되기 때문에 큰 재정적 손실로 이어집니다. 오류 없는 거래 게시 알고리즘을 통해 트레이드(진입 또는 청산)를 할 이상적인 순간을 찾을 수 있으며, 이를 통해 이를 사용하는 모든 거래자의 성공률이
제작자의 제품 더 보기
Supertrend Targets Signal   is a powerful trend-following and breakout confirmation indicator designed to help traders   identify high-probability entry points ,   visualize dynamic target zones , and   receive clean, reliable signals   across various market conditions. The core trend logic is built on a custom Supertrend that uses an ATR-based band structure with long smoothing chains—first through a WMA, then an EMA—allowing the trend line to respond to major shifts while ignoring noise. A key
The Fibonacci Confluence Toolkit  is a powerful indicator designed to highlights areas of interest where significant price action or reactions are anticipated, automatically applies Fibonacci retracement levels to outline potential pullback zones, and detects engulfing candle patterns.. This tool automates the detection and visualization of key market structures and potential reversal zones. Key Features: CHoCH Detection (Change of Character): Automatically identifies structural shifts in marke
Market Sessions Pre
Cao Minh Quang
5 (1)
The Market Sessions indicator is a popular tool among forex and stock traders for visually representing global trading sessions on a price chart. It highlights the time periods for major trading sessions — such as the Asian (Tokyo) , European (London) , and American (New York) sessions — directly on the chart. This helps traders identify when markets open and close, allowing for better decision-making based on session-specific trading behavior. - Asian Session (Default: 00:00-09:00) - London Se
FREE
ICT   Fair Value Gaps  MTF Indicator Unlock the power of   Fair Value Gaps (FVGs)   across multiple timeframes using the   ICT     Fair Value Gaps  Multi - Timeframe Indicator —a precision tool built for traders who follow the   Smart Money Concept (SMC) . Key Features : Multi-Timeframe FVG Detection : Automatically identifies Fair Value Gaps from higher timeframes (M15, H1, H4, etc.) and plots them on your active chart for immediate insight. Break of Structure (BOS) & Change of Character (CHoCH
Simple ICT Concepts
Cao Minh Quang
5 (2)
The Simple  ICT Concepts Indicator is a powerful tool designed to help traders apply the principles of the Inner Circle Trader (ICT) methodology. This indicator focuses on identifying key zones such as liquidity levels, support and resistance, and market structure, making it an invaluable asset for price action and smart money concept traders. Key Features Market Structure : Market structure labels are constructed from price breaking a prior swing point. This allows a user to determine the curr
Fair Value Gaps MT4
Cao Minh Quang
4.29 (7)
The Fair Value Gap (FVG) is a price range where one side of the market liquidity is offered, typically confirmed by a liquidity void on the lower time frame charts in the same price range. Price can "gap" to create a literal vacuum in trading, resulting in an actual price gap. Fair Value Gaps are most commonly used by price action traders to identify inefficiencies or imbalances in the market, indicating that buying and selling are not equal. If you're following the ICT Trading Strategy or Smart
FREE
MACD Indicator It has MACD line, Signal line, and Histogram. The Histogram has 4 colors based on Direction Above and Below the Zero Line, showing its movement direction as simple as possible. Allows Show MACD & Signal Line, Show Change In color of MACD   Line based on cross of Signal Line. Show Dots at Cross of MacD and Signal Line, Turn on and off Histogram. Enjoy your trading experience, and feel free to share your comments and reviews. If you are interested in this indicator, you might be i
FREE
The Pure Price Action ICT Tools indicator is designed for pure price action analysis, automatically identifying real-time market structures, liquidity levels, order & breaker blocks, and liquidity voids. Its unique feature lies in its exclusive reliance on price patterns, without being constrained by any user-defined inputs, ensuring a robust and objective analysis of market dynamics. Key Features Market Structures A Market Structure Shift, also known as a Change of Character (CHoCH), is a pivot
MACD Indicator It has MACD line, Signal line, and Histogram. The Histogram has 4 colors based on Direction Above and Below the Zero Line, showing its movement direction as simple as possible. Allows Show MACD & Signal Line, Show Change In color of   MACD     Line based on cross of Signal Line. Show Dots at Cross of MacD and Signal Line, Turn on and off Histogram. Enjoy your trading experience, and feel free to share your comments and reviews. If you are interested in this indicator, you might
FREE
SMC Analyzer Single-Timeframe (STF) The SMC Analyzer STF is a powerful, single-timeframe Smart Money Concepts (SMC) analysis tool designed for precision trade confirmations based on core SMC components. It evaluates market structure across four levels of confirmation using elements such as Break of Structure (BOS), Change of Character (CHoCH), Order Blocks (OB), Fair Value Gaps (FVGs), Liquidity Zones , and Higher Timeframe Trend Bias . Each level has configurable elements (BOS, OB, FVG, Liquid
SMC Analyzer Single-Timeframe (STF) for MT4 The   SMC Analyzer STF  MT4  is a powerful, single-timeframe Smart Money Concepts (SMC) analysis tool designed for precision trade confirmations based on core SMC components. It evaluates market structure across four levels of confirmation using elements such as   Break of Structure (BOS), Change of Character (CHoCH), Order Blocks (OB), Fair Value Gaps (FVGs), Liquidity Zones , and   Higher Timeframe Trend Bias . Each level has configurable elements (
The Linear Regression Oscillator (LRO) is a technical indicator based on linear regression analysis, commonly used in financial markets to assess the momentum and direction of price trends. It measures the distance between the current price and the value predicted by a linear regression line, which is essentially the best-fit line over a specified period. Here’s a breakdown of how it works and its components: Key Components of the Linear Regression Oscillator Linear Regression Line (Best-Fit Lin
Unicorn Model ICT Indicator — Smart Trading with Precision The   Unicorn Model ICT Indicator   is a powerful and intelligent tool designed for traders who follow   Smart Money Concepts (SMC)   and   Inner Circle Trader (ICT)   methodologies. This indicator simplifies complex price action by visually identifying key market structures and providing high-probability trade setups. Key Features: A Bullish Unicorn Pattern A Lower Low (LL), followed by a Higher High (HH) A Fair Value Gap (FVG), overla
Market Sessions Pre MT4
Cao Minh Quang
5 (1)
The Market Sessions indicator is a popular tool among forex and stock traders for visually representing global trading sessions on a price chart. It highlights the time periods for major trading sessions — such as the   Asian (Tokyo) ,   European (London) , and   American (New York)   sessions — directly on the chart. This helps traders identify when markets open and close, allowing for better decision-making based on session-specific trading behavior. - Asian Session (Default: 00:00-09:00) - Lo
FREE
ICT Fair Value Gaps  MTF Unlock the power of Fair Value Gaps (FVGs) across multiple timeframes using the ICT   Fair Value Gaps  Multi - Timeframe Indicator —a precision tool built for traders who follow the Smart Money Concept (SMC) . Key Features : Multi-Timeframe FVG Detection : Automatically identifies Fair Value Gaps from higher timeframes (M15, H1, H4, etc.) and plots them on your active chart for immediate insight. Break of Structure (BOS) & Change of Character (CHoCH): Clearly marked BOS
The latest version of Indicator is fully integrated into an all-in-one package, including: Fair Value Gaps (FVG).  Implied Fair Value Gap (IFVG).  OrderBlock (OB).  The options in the settings section are relatively easy to navigate, and you can even use them right away upon activation without encountering difficulties when using the default configuration. The indicator utilizes an algorithm to automatically draw and identify Order Blocks (OB), Fair Value Gaps (FVGs), and Implied Fair Value Gaps
The latest version of Indicator is fully integrated into an all-in-one package, including: Fair Value Gaps (FVG).  Implied Fair Value Gap (IFVG).  OrderBlock (OB).  The options in the settings section are relatively easy to navigate, and you can even use them right away upon activation without encountering difficulties when using the default configuration. The indicator utilizes an algorithm to automatically draw and identify Order Blocks (OB), Fair Value Gaps (FVGs), and Implied Fair Value Gap
The Market Structure with Inducements & Sweeps indicator is a unique take on Smart Money Concepts related market structure labels that aims to give traders a more precise interpretation considering various factors. Compared to traditional market structure scripts that include Change of Character (CHoCH) & Break of Structures (BOS) -- this script also includes the detection of Inducements (IDM) & Sweeps which are major components of determining other structures labeled on the chart. SMC & price a
Order Block Multi Timeframe The   Order Block Multi Timeframe   is a powerful tool for Smart Money Concept (SMC) traders, combining high-accuracy   Order Block detection   with real-time   Break of Structure (BOS)   and   Change of Character (CHoCH)   analysis across multiple timeframes. Smart Money Insight, Multi-Timeframe Precision This indicator automatically identifies   institutional Order Blocks —key price zones where large players have entered the market—and plots them directly on your ch
This Simple Smart Money Concepts indicator displays real-time market structure (internal & swing BOS / CHoCH), order blocks, premium & discount zones, equal highs & lows, and much more...allowing traders to automatically mark up their charts with widely used price action methodologies. "Smart Money Concepts" (SMC) is used term amongst price action traders looking to more accurately navigate liquidity & find more optimal points of interest in the market. Trying to determine where institutional
The Pure Price Action ICT Tools indicator is designed for pure price action analysis, automatically identifying real-time market structures, liquidity levels, order & breaker blocks, and liquidity voids. Its unique feature lies in its exclusive reliance on price patterns, without being constrained by any user-defined inputs, ensuring a robust and objective analysis of market dynamics. Key Features Market Structures A Market Structure Shift, also known as a Change of Character (CHoCH), is a pivot
Unicorn Model ICT Indicator — Smart Trading with Precision The Unicorn Model ICT Indicator is a powerful and intelligent tool designed for traders who follow Smart Money Concepts (SMC) and Inner Circle Trader (ICT) methodologies. This indicator simplifies complex price action by visually identifying key market structures and providing high-probability trade setups. Key Features: A Bullish Unicorn Pattern A Lower Low (LL), followed by a Higher High (HH) A Fair Value Gap (FVG), overlapping the est
Multiple Non-Linear Regression MT4 This indicator is designed to perform multiple non-linear regression analysis using four independent variables: close, open, high, and low prices. Here's a components and functionalities: Inputs: Normalization Data Length: Length of data used for normalization. Learning Rate: Rate at which the algorithm learns from errors. Show data points: Show plotting of normalized input data(close, open, high, low) Smooth?: Option to smooth the output. Smooth Length: Lengt
Smart Market Structure Simple is a powerful indicator that helps traders identify market structure based on the Smart Money Concept (SMC) . This indicator automatically detects Break of Structure (BOS), Change of Character (CHoCH), Fair Value Gaps (FVG), Order Blocks (OB), Liquidity Zones (LQZ), and key swing points Higher High (HH), Higher Low (HL), Lower High (LH), Lower Low (LL) . Main Objective: Assist traders in tracking institutional flow ( Smart Money ) and finding high-probability trade
Automatically detect bullish or bearish order blocks to optimize your trade entries with our powerful indicator. Ideal for traders following ICT (The Inner Circle Trader). Works with any asset type, including cryptocurrencies, stocks, and forex. Displays order blocks on multiple timeframes, from M2 to W1. Alerts you when an order block is detected, migrated, or a higher timeframe order block is created/migrated. Perfect for both scalping and swing trading in Smart Money Concepts.  Enhanced by st
The   Linear Regression Oscillator (LRO)   is a technical indicator based on linear regression analysis, commonly used in financial markets to assess the momentum and direction of price trends. It measures the distance between the current price and the value predicted by a linear regression line, which is essentially the best-fit line over a specified period. Here’s a breakdown of how it works and its components: Key Components of the Linear Regression Oscillator Linear Regression Line (Best-Fit
The   Simple  ICT Concepts Indicator   is a powerful tool designed to help traders apply the principles of the   Inner Circle Trader (ICT)   methodology. This indicator focuses on identifying key zones such as liquidity levels, support and resistance, and market structure, making it an invaluable asset for price action and smart money concept traders. Key Features Market Structure : Market structure labels are constructed from price breaking a prior swing point. This allows a user to determine t
The Market Structure with Inducements & Sweeps indicator is a unique take on Smart Money Concepts related market structure labels that aims to give traders a more precise interpretation considering various factors. Compared to traditional market structure scripts that include Change of Character (CHoCH) & Break of Structures (BOS) -- this script also includes the detection of Inducements (IDM) & Sweeps which are major components of determining other structures labeled on the chart. SMC & pri
Smart Market Structure Simple   is a powerful indicator that helps traders identify   market structure   based on the   Smart Money Concept (SMC) . This indicator automatically detects   Break of Structure (BOS), Change of Character (CHoCH), Fair Value Gaps (FVG), Order Blocks (OB), Liquidity Zones (LQZ),   and key swing points   Higher High (HH), Higher Low (HL), Lower High (LH), Lower Low (LL) . Main Objective:   Assist traders in tracking institutional flow ( Smart Money ) and finding high-p
The   Quasimodo Pattern Indicator  is no more difficult than the Head and Shoulders. Still, only a few traders know about it, and some even confuse one with the other. However, this is not a reason to avoid this tool in your forex trading strategy.    Features: Automatic Detection:   The indicator automatically scans for valid QM patterns across any timeframe, reducing the need for manual chart analysis. Visual Highlights:   Clear and customizable on-chart drawing of shoulders, heads, and breako
필터:
MonetFx
1436
MonetFx 2025.06.12 07:36 
 

사용자가 평가에 대한 코멘트를 남기지 않았습니다

Cao Minh Quang
46013
개발자의 답변 Cao Minh Quang 2025.06.12 07:43
Thanks!
Benjamin Afedzie
1588
Benjamin Afedzie 2025.06.10 19:02 
 

사용자가 평가에 대한 코멘트를 남기지 않았습니다

Cao Minh Quang
46013
개발자의 답변 Cao Minh Quang 2025.06.10 23:43
Thank bro!
kareem13
109
kareem13 2025.05.26 14:38 
 

I like it it’s so helpful thank you

Cao Minh Quang
46013
개발자의 답변 Cao Minh Quang 2025.05.26 22:38
Thank bro!
Gustavo Montello
18
Gustavo Montello 2025.05.24 20:20 
 

Muy bueno !!!

Cao Minh Quang
46013
개발자의 답변 Cao Minh Quang 2025.05.25 00:36
Thank bro!
fxready
24
fxready 2025.05.03 09:19 
 

I like this version of FVG. It simple but meet my expectation.

Cao Minh Quang
46013
개발자의 답변 Cao Minh Quang 2025.05.03 12:36
Thank man!
behzad zallaghi
48
behzad zallaghi 2025.05.02 14:43 
 

gooooooooooooooooood

Cao Minh Quang
46013
개발자의 답변 Cao Minh Quang 2025.05.03 01:46
Thank bro!
SACABOLLOS TIN
54
SACABOLLOS TIN 2025.04.30 06:22 
 

Excelente indicador, muchas gracias por su aporte, tenga usted muchos éxitos en su vida.

Cao Minh Quang
46013
개발자의 답변 Cao Minh Quang 2025.04.30 06:42
Thanks and good luck for you!
Habibu Asini Shabani
539
Habibu Asini Shabani 2025.04.21 10:12 
 

Hello, Thanks for your dedication to this platform, your work is very good and you impacts so many lives of traders around the globe. Can you please add just minor issue. Allow alerts from two different TF, like from 15min and 1H simultaneously without applying to all TF

Cao Minh Quang
46013
개발자의 답변 Cao Minh Quang 2025.04.21 12:41
Let's me check it then update soon! Thanks!
P.ARMz4915
324
P.ARMz4915 2025.04.20 08:36 
 

very good

Cao Minh Quang
46013
개발자의 답변 Cao Minh Quang 2025.04.20 08:37
Thank bro!
mozink
14
mozink 2025.04.15 09:10 
 

사용자가 평가에 대한 코멘트를 남기지 않았습니다

Cao Minh Quang
46013
개발자의 답변 Cao Minh Quang 2025.04.15 09:26
Thanks bro, i'll fix it soon!
Javier Sarró
18
Javier Sarró 2025.04.12 10:25 
 

Thank you for you job and dedicated time. I propose 2 improvements: 1- To allow the user to select in the input table the FVG range to detect (in points), avoiding the selection of FVGs below those points. 2- Improve the Alert/Warning item. It only allows: OFF One item (out of 5) All above Would be great if the user could select several of the items (2,3 or 4) at the same time; not ALL ABOVE. Kind Regards.

Cao Minh Quang
46013
개발자의 답변 Cao Minh Quang 2025.04.12 12:09
Thanks bro, I will consider and implement your suggestions!
Ngonidzashe Jiji
262
Ngonidzashe Jiji 2025.04.01 16:46 
 

사용자가 평가에 대한 코멘트를 남기지 않았습니다

Cao Minh Quang
46013
개발자의 답변 Cao Minh Quang 2025.04.02 00:44
Yes, bro, i agree it, need more elements to improve accuracy.
Ardeshir Amiri
95
Ardeshir Amiri 2025.03.31 08:48 
 

Great work. Thank you.

Cao Minh Quang
46013
개발자의 답변 Cao Minh Quang 2025.03.31 09:21
Thanks and good luck for you!
xaxotf
231
xaxotf 2025.03.12 17:34 
 

Man... Brillant work... I love it!!!!

Cao Minh Quang
46013
개발자의 답변 Cao Minh Quang 2025.03.13 01:11
Thank man!
Ramtin Hide
18
Ramtin Hide 2025.03.06 18:03 
 

사용자가 평가에 대한 코멘트를 남기지 않았습니다

Cao Minh Quang
46013
개발자의 답변 Cao Minh Quang 2025.03.07 06:32
Thank for your suggest, but opacity in MQL seem not good.
Damian Friedli
118
Damian Friedli 2025.02.20 17:59 
 

Works great, was looking for this

Cao Minh Quang
46013
개발자의 답변 Cao Minh Quang 2025.02.21 01:11
Thank and good luck for you!
Vns Oktora
228
Vns Oktora 2025.02.13 02:52 
 

Pretty good and useful for sure!

Cao Minh Quang
46013
개발자의 답변 Cao Minh Quang 2025.02.13 23:39
Thank bro!
33.Hl21
154
33.Hl21 2025.01.19 13:01 
 

Excelente Muy acertado!

Cao Minh Quang
46013
개발자의 답변 Cao Minh Quang 2025.01.19 16:00
Thank you very much!
grblzli12
14
grblzli12 2025.01.14 13:38 
 

Доволен. Спасибо!

Cao Minh Quang
46013
개발자의 답변 Cao Minh Quang 2025.01.14 13:42
Thank bro, and good luck for you!
gnanos123
927
gnanos123 2024.12.23 19:59 
 

Very powerful indicator

Cao Minh Quang
46013
개발자의 답변 Cao Minh Quang 2024.12.23 21:31
Thanks bro!
리뷰 답변
버전 3.0 2025.04.15
- Fix issues redraw HTF FVG
버전 2.9 2025.04.13
- add fvg gap distance
- change fvg alert
버전 2.8 2025.02.11
add hide + alert when first touch
버전 2.7 2025.01.15
- Add AVG line of FVG
버전 2.6 2024.12.31
- Add IFVG
버전 2.5 2024.11.20
Add input Background color
Add input Outline style
버전 2.4 2024.11.04
Fix pointer and reup free version
버전 2.3 2024.10.30
Fix draw order block line
버전 2.2 2024.07.15
update text of alert
버전 2.1 2024.07.14
Update SendNotification function
버전 2.0 2023.12.19
Version 2.0: Free trial before launch premium from 1/1/2024.
- All in one solution with FVG/ OrderBlock / IFVG
버전 1.7 2023.11.30
Fix some small bugs
버전 1.6 2023.04.17
- Fix HTF fvg issues
버전 1.5 2023.02.20
Fix small bugs
버전 1.4 2023.02.16
- Add extend to the right for viewing more clearly than.
버전 1.3 2023.02.14
- Update multiple timeframe or higher timeframe.
- Update alert options when first touch / migrated / new fvg created.
버전 1.2 2023.01.10
Fix overlap issues.
버전 1.1 2023.01.04
Change default values