Quasimodo Signal MT4
- 지표
-
Cao Minh Quang
 Welcome to my profile. I am a developer MQL4 and MQL5.
Telegram: https://t.me/storevan
Thanks and regards! - 버전: 1.0
- 활성화: 5
The Quasimodo Pattern Indicator is no more difficult than the Head and Shoulders. Still, only a few traders know about it, and some even confuse one with the other. However, this is not a reason to avoid this tool in your forex trading strategy.
Features:
-
Automatic Detection: The indicator automatically scans for valid QM patterns across any timeframe, reducing the need for manual chart analysis.
-
Visual Highlights: Clear and customizable on-chart drawing of shoulders, heads, and breakout zones for easy identification.
-
Breakout & Retest Zones: Identifies potential breakout points and retest levels to assist with precision entries.
-
Alert System: Real-time alerts when a new pattern forms
How it works:
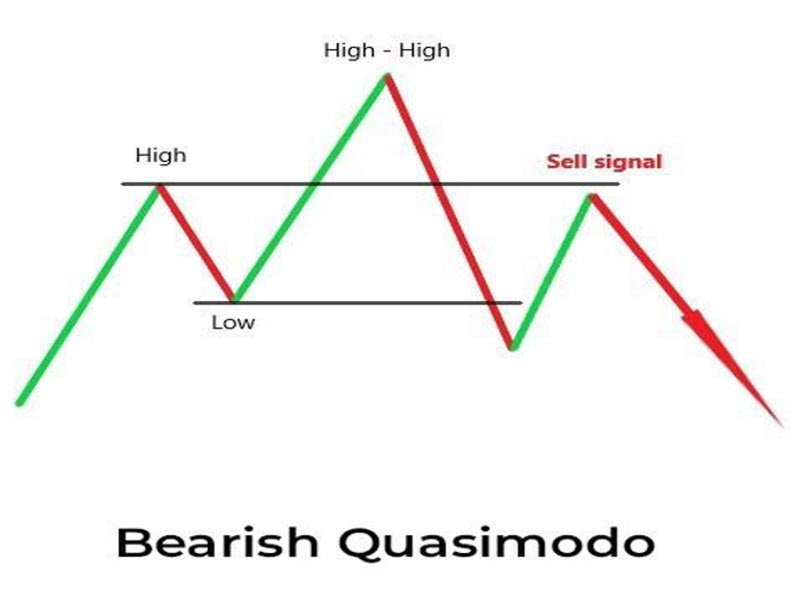
- Bearish Quasimodo
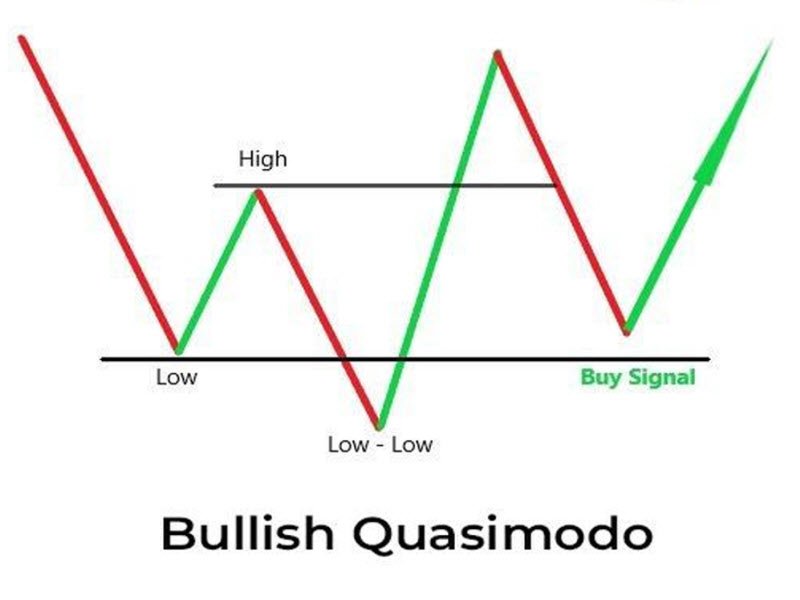
- Bullish Quasimodo
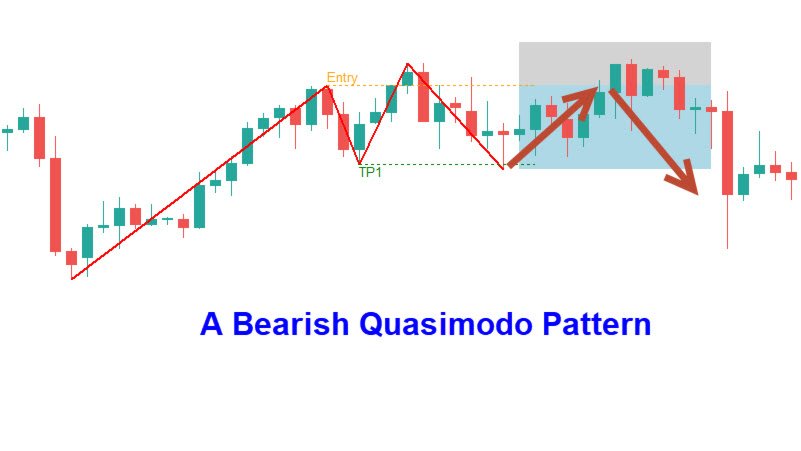
A bearish QM occurs at the end of an uptrend and signals the formation of a new downtrend. It consists of three peaks (a head in the middle and two shoulders at the sides) and two troughs. The second peak (head) is the highest, and the second trough is the lowest.
The theory suggests that a trader should open a sell position as soon as the third peak is formed. To open a trade at the best possible level, the price should set a lower low (the second bottom). The second low could be used as a take-profit target. The head would serve as the stop-loss target.
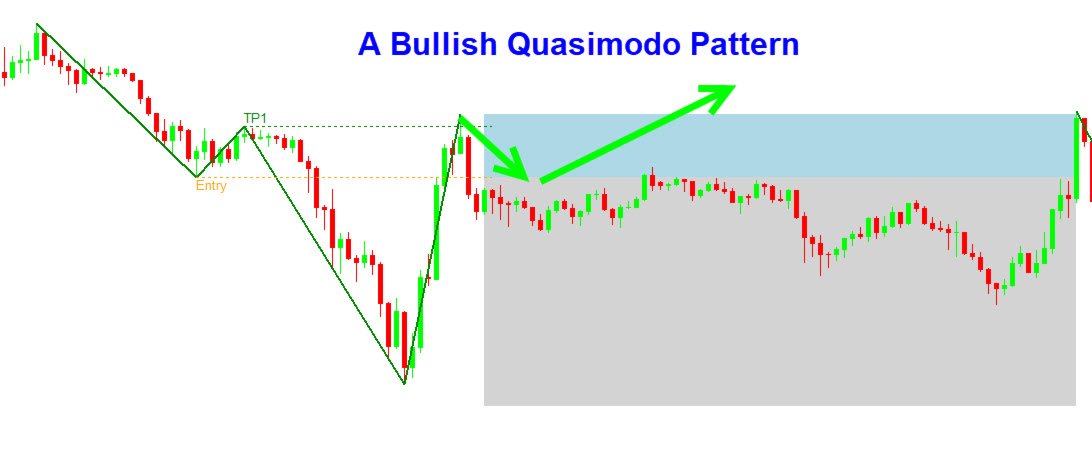
A bullish (inverse) Quasimodo occurs at the end of a downtrend and signals a potential uptrend. It consists of three lows (a head in the middle and two shoulders at the sides) and two maximums, where the second trough (head) is the lowest and the second top is the highest.
According to the bullish Quasimodo pattern’s rules, a buy position could be opened as soon as the second shoulder appears. To enter the market at the best possible level, consider the price’s higher low (the second shoulder) as a potential entry point. You may set a take-profit order at the peak between the head and the right shoulder and use the head as a stop-loss target.Use Cases:
-
Spot high-probability reversals at market tops and bottoms.
-
Combine with FVG, Order Blocks, or Liquidity Zones for confluence-based setups.
-
Works well with Smart Money Concepts (SMC) and Price Action Strategies.
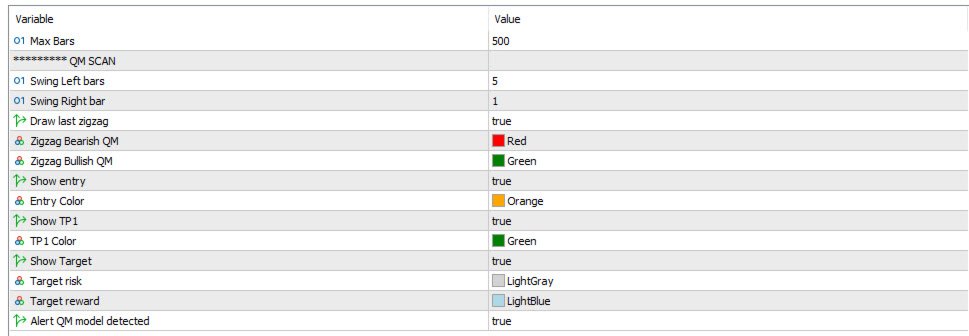
Customizable Settings:
-
Pattern sensitivity and depth
-
Color schemes and labels