MultiTimeFrame Moving Average Osw
- 지표
-
William Oswaldo Mayorga Urduy
 MQL4 and MQL5 trader and developer since February 2019, delivering projects in under one day and providing post-delivery technical support.
Optimized code, advanced logic, and high-quality code. - 버전: 1.1
- 업데이트됨: 4 7월 2024
- 활성화: 5
다중 시간 프레임 이동 평균 OSW
(메타트레이더 5)
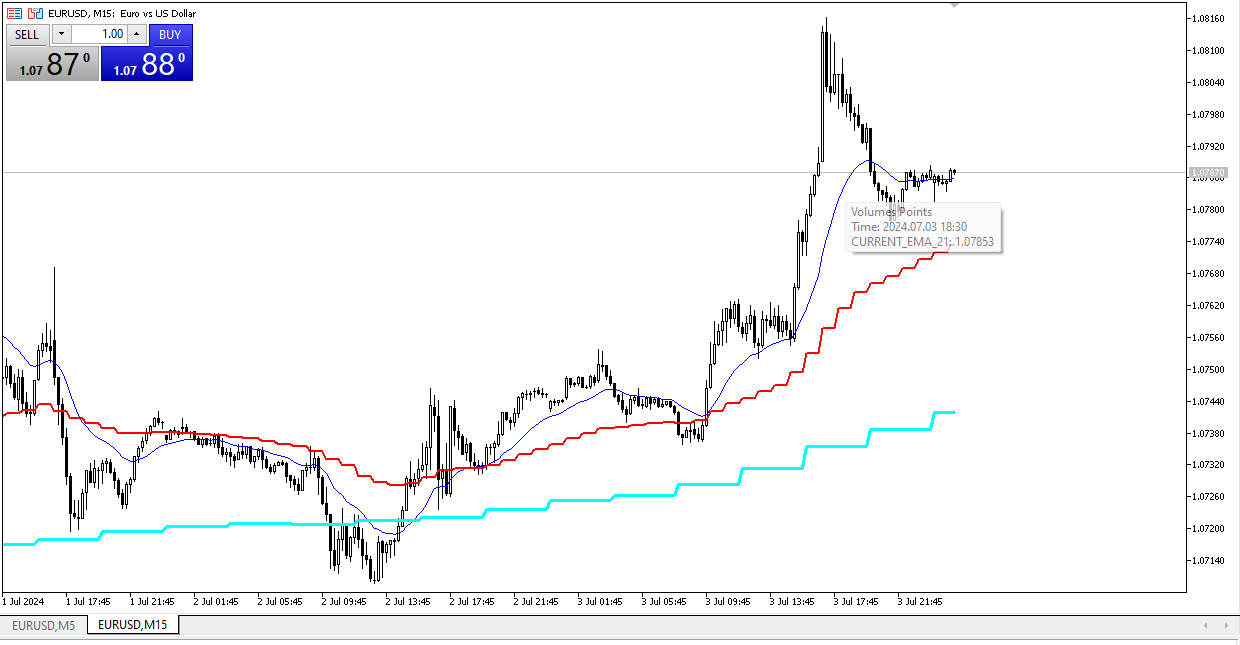
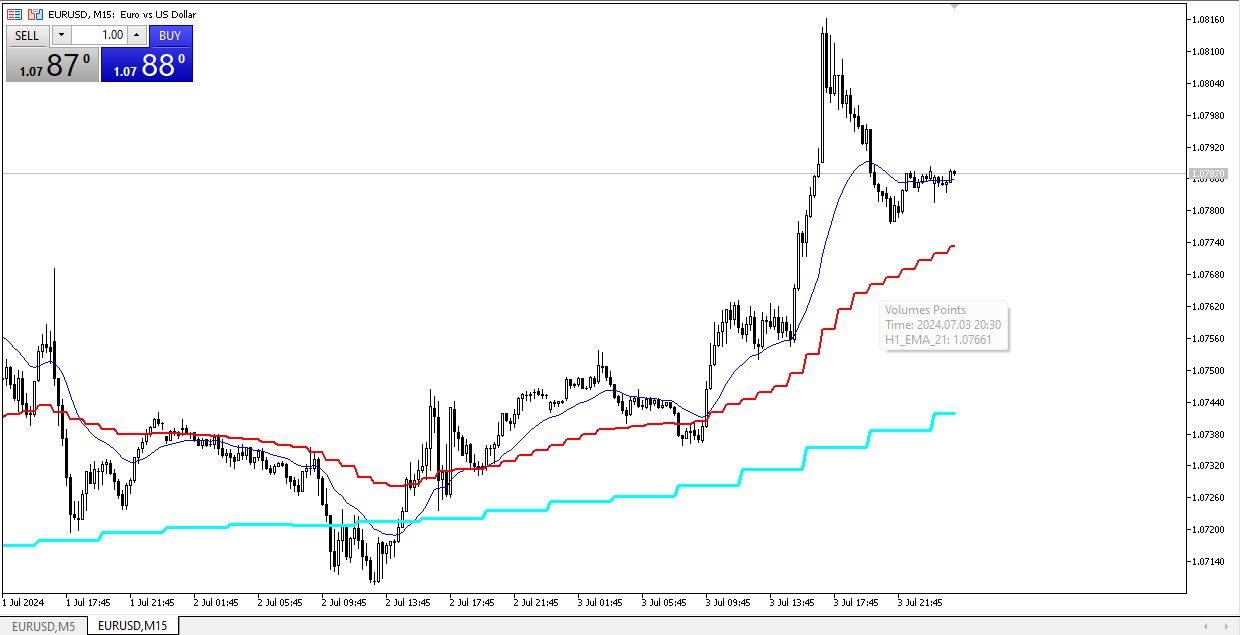
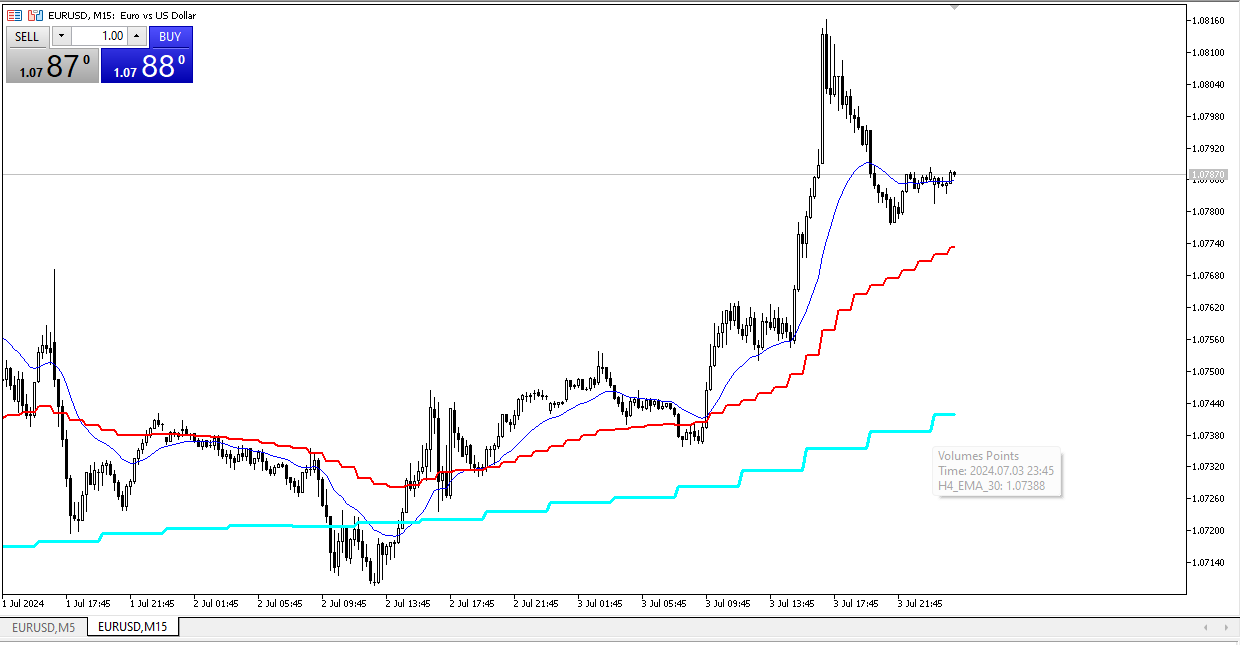
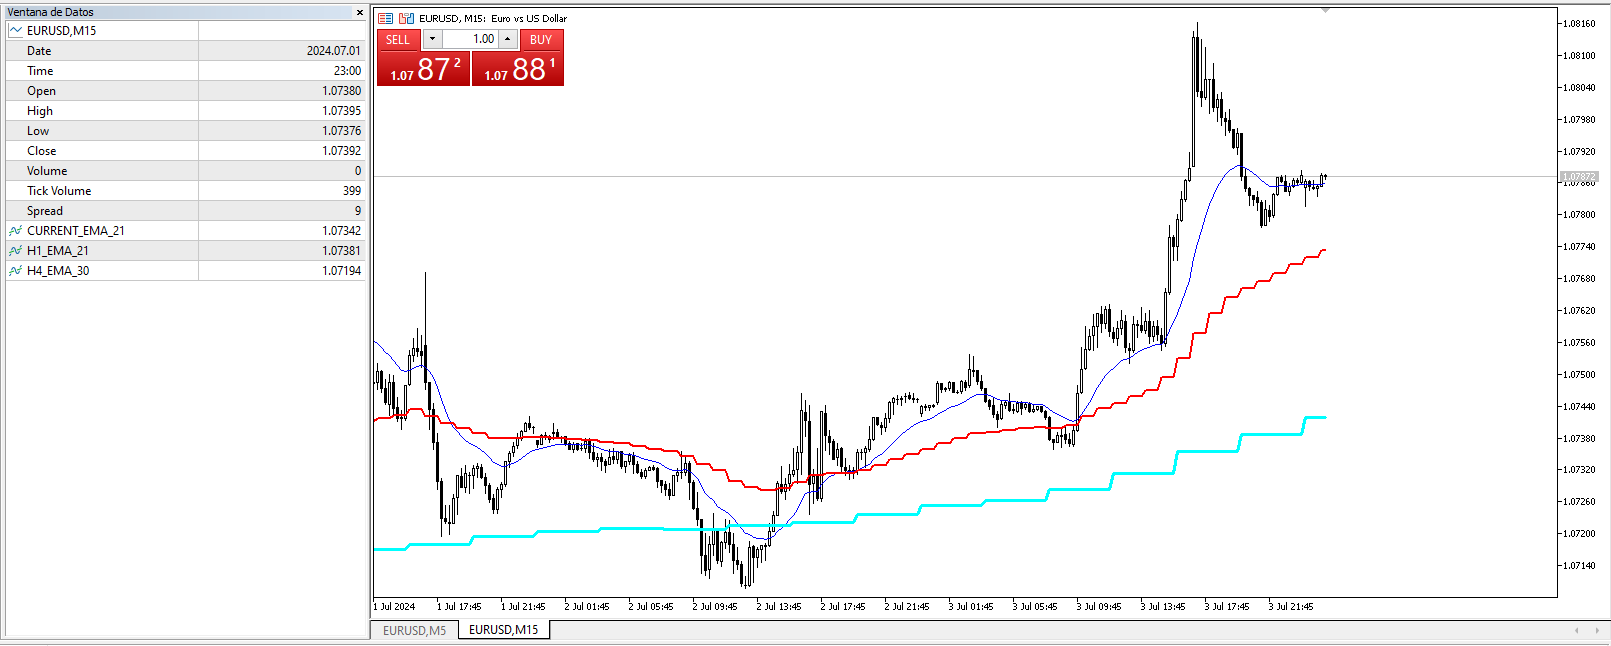
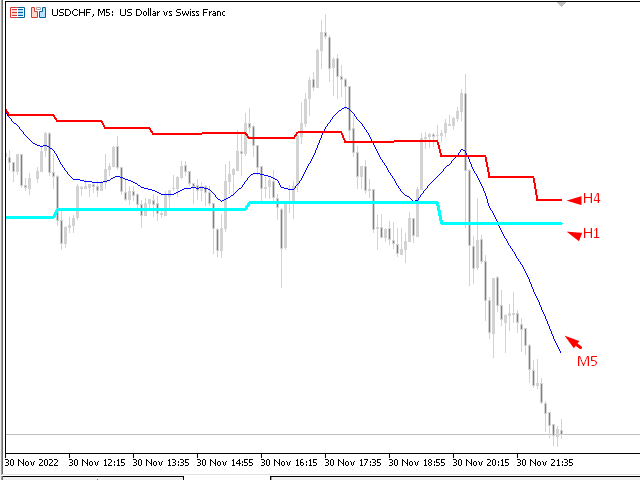
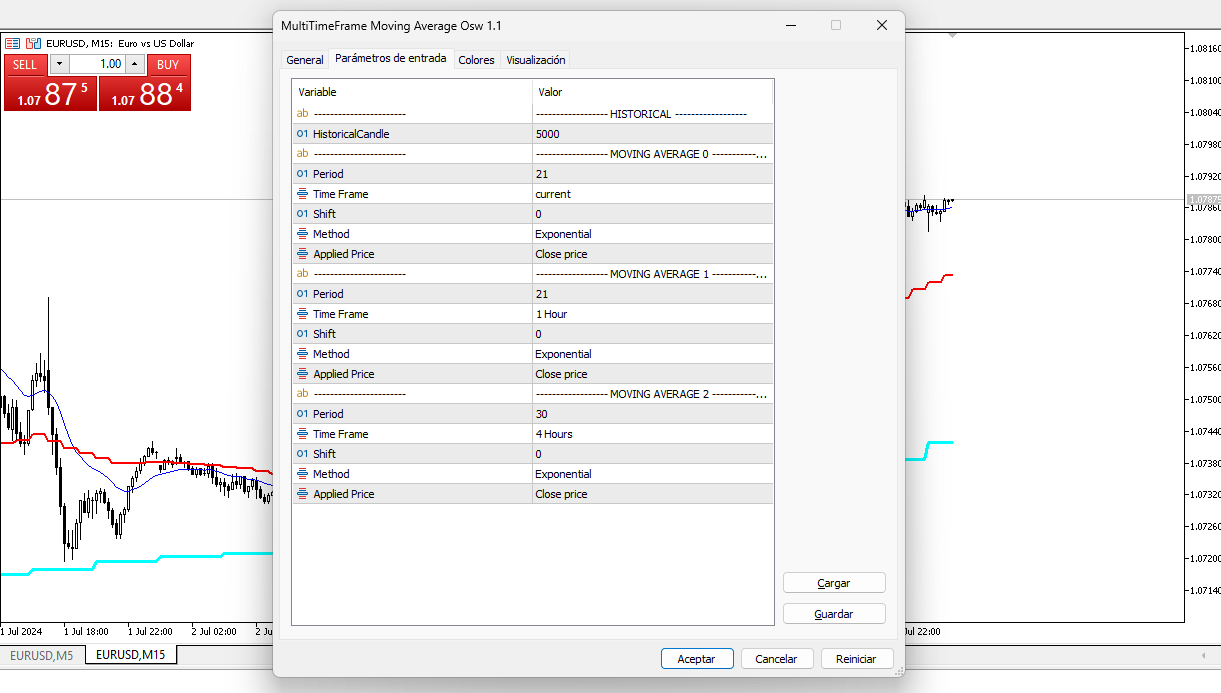
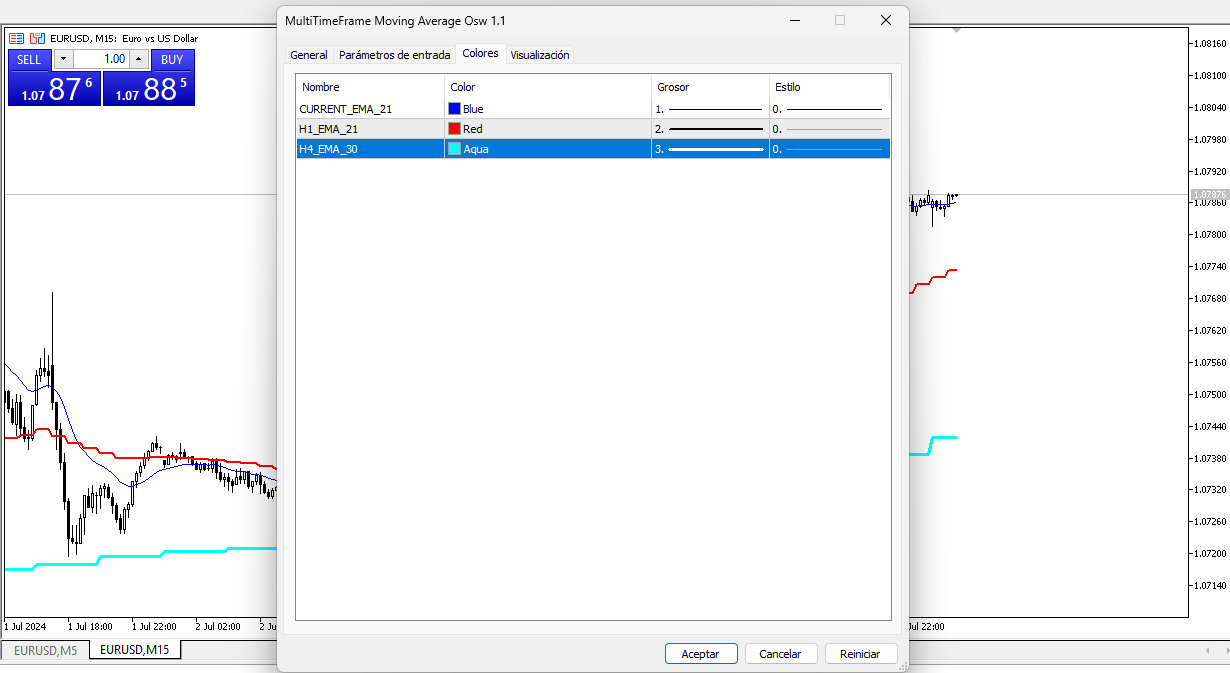
이 표시기를 사용하면 모든 유형의 구성에 대한 이동 평균을 추가할 수 있습니다. 단, 시간 프레임에 있는 경우 더 높은 수준에서 추가할 수 있다는 차이점이 있습니다(예: 5분 시간 프레임에 있는 경우). 15분, 1시간, 4시간의 시간성 20의 이동 평균 지수를 보고 싶다면 지표 메뉴에서 올바른 매개변수를 구성해야만 지표 이미지에 표시된 대로 볼 수 있습니다.
다중 시간 프레임 이동 평균 OSW
(메타트레이더 5)
이 표시기를 사용하면 모든 유형의 구성에 대한 이동 평균을 추가할 수 있습니다. 단, 시간 프레임에 있는 경우 더 높은 수준에서 추가할 수 있다는 차이점이 있습니다(예: 5분 시간 프레임에 있는 경우). 15분, 1시간, 4시간의 시간성 20의 이동 평균 지수를 보고 싶다면 지표 메뉴에서 올바른 매개변수를 구성해야만 지표 이미지에 표시된 대로 볼 수 있습니다.