Close all profit positions

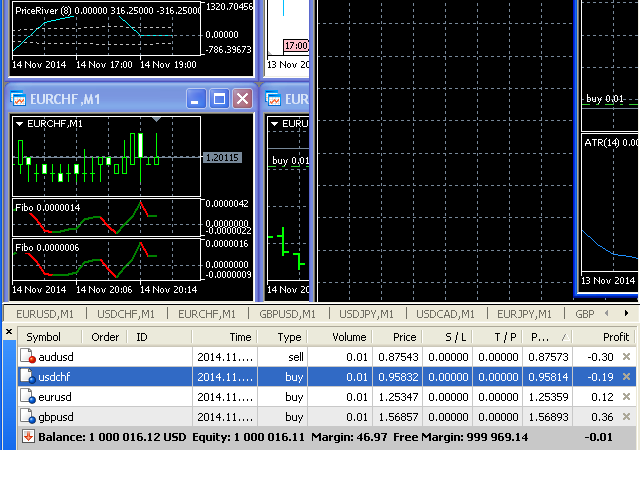
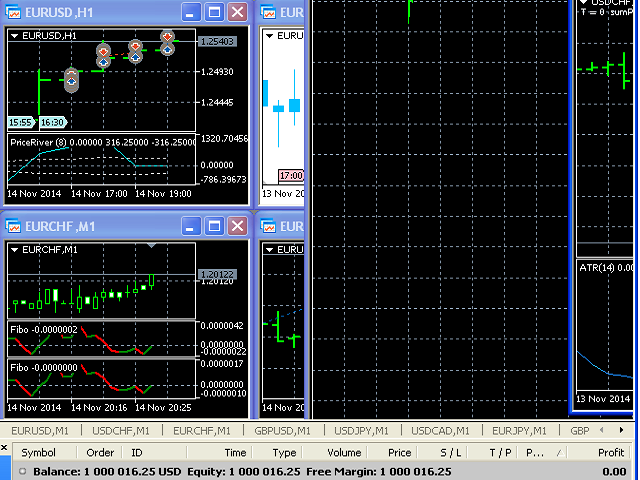
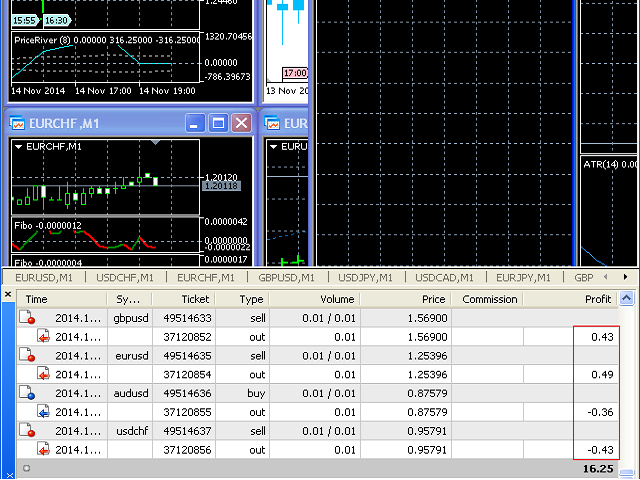
The script allows to close all opened positions if Sum of Profit from all opened positions  is greater than value of the input parameter: SumProfit.


Input parameters

  • SumProfit = 100

You can change SumProfit to any positive value (in dollars, not in the points!). This script will close all positions for a given currency pair only.

Keep in mind that you have to "Allow automated trading" on the "Expert Advisors" tab (Tools->Options).

추천 제품
EW Close All – 한 번 클릭. 모두 종료. EW Close All 은 가볍고 다국어 지원 Expert Advisor로, 단 한 번의 버튼 클릭만으로 모든 오픈 포지션을 즉시 청산하고 모든 대기 주문을 취소할 수 있습니다. 모든 오픈 포지션 청산   모든 대기 주문 취소   모든 심볼과 모든 타임프레임에서 작동   다국어 인터페이스 지원   깔끔하고 빠르고 안정적 빠른 청산, 리스크 관리, 장 마감 전 정리 작업에 완벽합니다. 항상 완벽한 컨트롤 — EW Close All로 단 몇 초 만에 모든 것을 종료하세요! EW Close All – 한 번 클릭. 모두 종료. EW Close All 은 가볍고 다국어 지원 Expert Advisor로, 단 한 번의 버튼 클릭만으로 모든 오픈 포지션을 즉시 청산하고 모든 대기 주문을 취소할 수 있습니다. 모든 오픈 포지션 청산   모든 대기 주문 취소   모든 심볼과 모든 타임프레임에서 작동  
FREE
Super simple, convenient, useful tool. Allows displaying the end time of a candle (standard) and expanding the symbol's spread in real time. The countdown tool is smooth, not jerky or slow like some other tools Useful tool for professional traders specializing in short-term and long-term trading. Contact author or user guide: https://www.mql5.com/en/channels/metool_trading
FREE
Automated Report Generator for the Spanish Treasury This utility allows you to generate automated reports for the Spanish treasury with several advantages: A detailed report is generated in an HTML file in the MetaTrader 5 base directory. This report includes all operations individually. For accounts nominated in another currency, the report will automatically generate a profit column in euros using the same broker data. Profits in other currencies will be accounted for as indicated by the Spa
The indicator displays useful trading information on the chart for futures contracts such as: Average daily volatility with adjustable period of time. Optimal volume to trade depending on percentage of account balance you use. The percentage can be adjusted. Optimal stop loss depending on your maximum risk per trade considering percentage of account balance you use. Initial margin for the contract. Tick value for the contract. The indicator has an ability to display dynamic daily volatility leve
What Exactly Is A Smart Trading Tool? Smart Trading Tool   was developed for fast and comfortable trading of the financial markets especially for   ORDER BLOCKS TRADERS .   It provides traders functionalities, such as: A Drawing Tool One-Click Trading Panel Automated Lot Sizes Calculation   based on your risk appetite & Money Management ( Watch this video , how this tool can help manage your risk per trade better!) Built in PRICE LEVELS (Fibonacci, Round Numbers, Daily hi-low, etc) Shows Trading
Close by percentage MT5
Konstantin Kulikov
5 (1)
Hello friends. I wrote this utility specifically for use in my profile with a large number of Expert Advisors and sets ("Joint_profiles_from_grid_sets"   https://www.mql5.com/en/blogs/post/747929 ). Now, in order to limit losses on the account, there is no need to change the "Close_positions_at_percentage_of_loss" parameter on each chart. Just open   one   additional chart, attach this utility and set the desired percentage for closing all trades on the account. The utility has the following fu
C Evolution MT5
Antonis Michos
5 (1)
Join the Out of the Box Telegram Group search for "Out of the Box" on Telegram or contact me This is not just a simple copier program that ONLY allows you to locally copy transactions between different MetaTrader 4 a accounts in any direction and quantity as quickly and easily as possible .Of course it does that. This copier DOES MUCH MUCH MORE!!! PLEASE READ BELOW AND SEE SCREENSHOTS. Many of us have martingale EAs or none martingale that are good but some point you wish to had opened the
COS COPY TRADE EA: USER MANUAL It must be used in conjunction with the master file. Cos copy trade master | Free Download Trading Utility for MetaTrader 5 1. System Overview & Architecture The COS Copy Trade system is a local, high-speed copying solution designed to replicate trades across accounts running on the same computer . It fully supports copying between different brokers and can mirror trades from an Investor Password account. 2. Installation & Setup Guide Step 1: Deploying the Master
How the Chart Cleaner Script Works The Chart Cleaner is a one-click tool designed to instantly wipe your chart clean. When you drag and drop the script onto a chart, it scans for and removes all visual objects—including trend lines, horizontal lines, text labels, shapes, and any other drawings you have placed. The result is a completely clean, uncluttered chart, giving you a fresh workspace for your analysis. It's the fastest way to reset your chart to its default state.
NOTIFY PANEL            Your trading dashboard delivered straight                   to your pocket — in real time OVERVIEW NotifyPanel is a lightweight Expert Advisor featuring 3 buttons that instantly sends your trading data as push notifications to your smartphone via the MetaTrader 5
Flow – Hotkey Tool for Discretionary Traders Take full control of MT5 with your keyboard and mouse. Flow is a powerful hotkey-based assistant designed specifically for discretionary traders who want to place orders, draw tools, and operate charts with speed and precision. No more right-click menus or wasting time. Just trade. Key Features Order Execution Place pending Buy/Sell orders (limit or stop) instantly with just a mouse click. Stop Loss and Take Profit lines are automatically attac
Signal Provider Utility Pro (Telegram & Discord) The Professional Solution for Signal Providers. Automated Broadcasting | Smart GUI Panel | Performance Reports Stop managing your signals manually. Signal Provider Utility Pro is the realiable bridge between your MetaTrader 5 terminal and your community on Telegram and Discord. Designed for high-performance signal services, this tool gives you instant control over your broadcasts without ever needing to open the settings window. From real-time tr
Defence Zone Engine Gold Professional XAUUSD Support & Resistance Analysis Using Market Structure, Supply & Demand and Timeframe-Aware Zone Refinement Overview Defence Zone Engine Gold is a professional market structure analysis tool designed . Defence Zone Engine Gold is a professional XAUUSD chart utility designed specifically for XAUUSD (Gold) to automatically identify, validate, refine, filter and rank support and resistance zones using market structure, supply and demand concepts, confidenc
This   Trading Statistics Indicator   gives you an overview of your trade statistics for a selected period. You can set different periodsand filter for Symbols and magics to analyse your trading success. You can also create charts for Balance/Equity, MFE and MAE Periods: Total Time Today Yesterday This Week Last Week This Month Last Month This Year Last Year This Trading Statistics Indicator is still work in progress. In the next versions I will add telegram and email notifications and some more
Native Websocket
Racheal Samson
5 (6)
An   easy to use, fast,  asynchronous   WebSocket library  for MQL5. It supports: ws://   and   wss://  (Secure "TLS" WebSocket) text   and   binary   data It handles: fragmented message  automatically (large data transfer) ping-pong   frames  automatically (keep-alive handshake) Benefits: No DLL required. No OpenSSL installation required. Up to 128 Web Socket Connections from a single program. Various Log Levels for error tracing Can be synchronized to MQL5 Virtual Hosting . Completely native t
Close All and Change Take Profit and Stop Loss All Orders. Main Features     Ability to Close All Orders the Symbol you put this EA.     Ability to Change Take Profit to All Order.     Ability to Change Stop Loss to All Order.     Show Order count.     Show Average price with info and Horizontal Line.     Show lot open.     Show Price diff from average to price now     Show broken price with info and Horizontal Line.     Easy to use . How to use Close All (Symbol) PC : you can click on CloseAl
Visual Trade Manager for MT5 is an interactive trade execution and position management tool designed for traders who want fast chart-based control over risk and execution. The panel provides a visual trade box with entry, stop and target lines directly on the chart. Position size is calculated from the selected risk percentage, and the tool supports both market execution and pending order placement. Main features - BUY and SELL switching directly from chart buttons - Draggable Entry, Stop and
메타트레이더 5 (MT5)용 UZFX - 손익분기점 즉시 설정 스크립트는 모든 오픈 포지션의 손절가를 진입 가격으로 빠르게 이동시켜 위험 없이 거래할 수 있는 강력한 도구입니다. 이 스크립트는 특히 활성 거래를 효율적으로 관리하는 데 유용하며 포지션이 유리하게 움직이면 잠재적 손실로부터 트레이더를 보호합니다. (프로필 방문 및 다른 모든 MT4/MT5 상품 확인) (리뷰 작성 잊지 마세요) 특징: 모든 오픈 포지션의 손절가를 손익분기점(진입가)으로 자동 설정합니다. 수익을 확보하고 잠재적 손실을 최소화하여 리스크 관리를 강화합니다. 사용 방법: 스크립트를 차트에 첨부하면 모든 오픈 포지션이 자동으로 조정됩니다. 포지션의 손절이 이미 손익분기점에 도달한 경우 건너뜁니다. 참고: 이 스크립트는 기존 거래만 수정하며 새 주문은 하지 않습니다. 심볼에 관계없이 모든 오픈 포지션에 적용됩니다. 브로커가 정확한 진입 가격으로 손절가 수정을 허용하는지 확인하세요.
FREE
FlipPro Unlimited EA Manual 1. Introduction FlipPro Unlimited is an Expert Advisor (EA) designed for the MetaTrader 5 (MT5) trading platform. It is a versatile trading tool that allows users to initiate buy or sell positions with customizable stop loss (SL) mechanisms, and it supports automated flipping of trade directions upon hitting SL. The EA includes features like dynamic or fixed SL, trailing to breakeven (BE), martingale pending orders, target profit closure, and a common take profit (
Global crosshair for spotting levels and positions on multiple chart (timeframes). Features: Toggle with middle click (replace default MT5 crosshair). Toggle with HotKey shortcut and on chart button. Multi instance feature. (every chart can draw separate instance). Customizable Display Style. (color / line style / ex.) Global crosshair for spotting levels and positions on multiple chart (timeframes).
Buy by Trend
Konstantin Kulikov
Sometimes the markets are in such a trending phase that it is impossible not to notice and it is enough to simply buy with the trend. 1) So, we scroll through the charts of different instruments, and see a good entry point, so let's specify the desired price for the first order in the Price_for_First_Order parameter and the direction in the Trend_Direction parameter, this is already enough for a good deal. (If Price_for_First_Order=0, the position will open immediately at the market price.) 2) T
Signal Copy Multiplier automatically copies trades on the same account, for example, to get a better entry and adjusted volume on a subscribed signal. MT4-Version:  https://www.mql5.com/de/market/product/67412 MT5-Version:  https://www.mql5.com/de/market/product/67415 You have found a good signal, but the volume of the provider's trades is too small?  With Signal Copy Multiplier you have the possibility to copy trades from any source (Expert Advisor, Signal, manual trades) and change the volume
SL Trailing Stop
Makarii Gubaydullin
트레일링 스탑:  시장 움직임에 따른 SL 자동 이동 . 거래에서  최대 이익  획득 SL 이동 프로세스는 전략에 따라 자동화 가능합니다. 다양한 설정으로 모든 전략에 유용. 특히 단기 트레이더에게 중요. 다기능 유틸리티 : 65+ 기능 포함 | 문의 | MT4 버전 활성화를 위해 4가지 주요 매개변수 설정 필요(패널에서): 1. 심볼 또는 거래 (적용 대상): 현재 [Symbol]/[ALL] 전체, 또는 특정 거래 [Ticket]. [Symbol] 또는 [ALL] 규칙 외 개별 [Ticket] 규칙 설정 가능(우선 적용). 2. 활성화 시점 : [ 즉시 실행 후]: 주문 체결 시 지연 없음 ; [이익 시] : 지정 이익액 도달 시 활성화; 3. SL 계산 방식 : [v] 선택기로 설정: 핍 또는 포인트 고정값. 가격 변동 퍼센트 . 이동 평균 (MA) 기반 SL. 설정 항목: MA 계산 시간대, 기간, 방법, 봉 가격; MA에서 SL 배치 거리: 0: SL=MA 값; 양수: TP
Horizontal Line Trade Assistant EA  Semi-Automated Trading Assistant      IMPORTANT :     On the main/purchased program a user can click on the Horizontal line and change it to Buy or Sell, and drag by double clicking on it. Please keep in mind that this option is not available on demo version, due to some restrictions/limitations of Strategy Tester, some Object related operations are not available in the  Strategy Tester. But, it will not prevent you from Testing, please drop an Object to chart
DDKiller Pro
Njaratahiry Michael Randrianiaina
Stop Blowing Your Account. Once and For All. DDKiller Pro is the MT5 risk guardian that runs silently on your chart and shuts down trading the moment you hit a limit — whether you're grinding a prop firm challenge or managing your own CFD account. The problem every trader knows: You set your rules. You break them anyway. One revenge trade. One overleveraged position. One session that erases a month of gains. DDKiller Pro removes that decision from your hands entirely. What it does: The second yo
This script analyzes all symbols in Market Watch for a set timeframe. The result is displayed on the Experts tab and in the specified file. For more convenient viewing and editing, the result is displayed in a csv file. For the calculation, the Pearson formula is used. The value of the correlation coefficient of pairs close to 1 means that the pairs move almost identically. A value close to -1 means that the pairs move in the same way. This tool will be useful to those who use hedging due to the
Apex StopLoss Manager
Muhammad Hassan Muhammad Ahmad Atiyah
Apex StopLoss Manager MT5 Script – Stop Loss Control Utility Overview Apex StopLoss Manager is a trade management script for MetaTrader 5 designed to provide precise, rule-based control over Stop Loss behavior on existing open positions . The script focuses on manual execution and accuracy. It does not use automated trading logic, does not open trades, and runs once per attachment . Core Functionality The script provides two independent Stop Loss control functions, both enabled only through exp
브레이크이븐 레벨: 1클릭으로 SL 이동. 기존 이익 손실 방지 이 도구를 사용하면 1클릭으로 빠르게 이익을 보호할 수 있습니다. 단기 거래에 특히 중요합니다. 오프셋 옵션도 사용 가능합니다. 다기능 유틸리티 : 66개 이상 기능, 이 도구 포함 | 문의하기 | MT4 버전 SL 레벨 이동 방법: 1. 특정 [심볼] 을 지정하거나 [모두] 심볼을 선택합니다. 2. 브레이크이븐을 적용할 거래 유형 을 선택합니다: [모두]: 모든 활성 거래에 적용; [롱]: 매수 거래만; [숏]: 매도 거래만; 3. [이익 >] 옵션: 활성화 시 이익이 지정 값을 초과할 때만 SL이 이동됩니다. 4. [+ 오프셋] : TP 레벨 방향으로 추가 SL 이동 을 설정할 수 있습니다. 따라서 SL을 브레이크이븐뿐만 아니라 수익성 있는 레벨로 이동할 수 있습니다. [v] 선택기 를 사용하여 이익 및 오프셋 값의 계산 방법 을 선택할 수 있습니다: 금액 / 핍 / 포인트 / SL 크기의 % / TP 크기의 %
Trader Agent MT5  Trader Agent MT5 — Professional Trade Management Panel Trader Agent is an all-in-one trade management Expert Advisor that gives you complete control over every aspect of your trading — from one-click order execution to advanced risk management, partial close strategies, and automated position protection. With 40+ built-in features organized across 5 intuitive tabs, it replaces the need for multiple tools and puts professional-grade order management at your fingertips. Why Trade
DAQ Capital - Visual Position Tool Stop guessing your lot sizes. Start planning trades like a professional with the visual precision of TradingView, now inside MetaTrader 5. Get this tool for FREE Unlock lifetime access to this tool (and much more) by joining the DAQ Capital community! Join here: https://daqcapital.pro/ Designed by DAQ Capital, this utility solves the biggest problem for trade
이 제품의 구매자들이 또한 구매함
Trade Assistant MT5
Evgeniy Kravchenko
4.43 (213)
거래당 위험 계산, 라인을 사용한 손쉬운 신규 주문, 부분 청산 기능을 통한 주문 관리, 7가지 유형의 트레일링 스탑 및 기타 유용한 기능을 제공합니다. 추가 자료 및 지침 설치 지침   -   애플리케이션 지침   -   데모 계정용 애플리케이션 평가판 라인 기능       - 차트에 개시선, 손절매, 차익실현을 표시합니다. 이 기능을 사용하면 새로운 주문을 쉽게 하고 개봉 전에 추가 특성을 볼 수 있습니다. 위기 관리       -       위험 계산 기능은 설정된 위험과 손절매 주문의 크기를 고려하여 새 주문의 볼륨을 계산합니다. 이를 통해 손절매 크기를 설정하고 동시에 설정된 위험을 존중할 수 있습니다. 로트 계산 버튼 - 위험 계산을 활성화/비활성화합니다. 필요한 위험 값은 위험 필드에 0에서 100 사이의 백분율 또는 예금 통화로 설정됩니다. 설정 탭에서 위험 계산 옵션을 선택합니다. $ 통화, % 잔액, % 지분, % 자유 마진, % 사용자 정의, % AB 이전
Trade Manager EA에 오신 것을 환영합니다. 이 도구는 거래를 보다 직관적이고 정확하며 효율적으로 만들기 위해 설계된 궁극적인 리스크 관리 도구 입니다. 단순한 주문 실행 도구가 아닌, 원활한 거래 계획, 포지션 관리 및 리스크 제어를 위한 종합 솔루션입니다. 초보자부터 고급 트레이더, 빠른 실행이 필요한 스캘퍼에 이르기까지 Trade Manager EA는 외환, 지수, 상품, 암호화폐 등 다양한 시장에서 유연성을 제공합니다. Trade Manager EA를 사용하면 복잡한 계산은 이제 과거의 일이 됩니다. 시장을 분석하고 진입, 손절 및 익절 수준을 차트의 수평선으로 표시한 후 리스크를 설정하면, Trade Manager가 이상적인 포지션 크기를 즉시 계산하고 SL 및 TP 값을 실시간으로 표시합니다. 모든 거래가 간편하게 관리됩니다. 주요 기능: 포지션 크기 계산기 : 정의된 리스크에 따라 거래 크기를 즉시 결정합니다. 간단한 거래 계획 : 진입, 손절, 익절을 위한
Local Trade Copier EA MT5
Juvenille Emperor Limited
4.96 (142)
Local Trade Copier EA MT5 를 사용하여 매우 빠른 거래 복사 경험을 해보세요. 1분 안에 간편하게 설정할 수 있으며, 이 거래 복사기를 사용하면 Windows 컴퓨터 또는 Windows VPS에서 여러 개의 MetaTrader 터미널 간에 거래를 0.5초 미만의 초고속 복사 속도로 복사할 수 있습니다. 초보자든 전문가든   Local Trade Copier EA MT5 는 다양한 옵션을 제공하여 사용자의 특정 요구에 맞게 맞춤 설정할 수 있습니다. 이는 수익 잠재력을 높이려는 모든 사람을 위한 최고의 솔루션입니다. 지금 사용해보시고 이것이 왜 시장에서 가장 빠르고 쉬운 무역용 복사기인지 알아보세요! 팁: 여기 에서 데모 계정에서 Local Trade Copier EA MT5 데모 버전을 다운로드하여 사용해 볼 수 있습니다. 다운로드한 무료 데모 파일을 MT5 >> File >> Open Data Folder >> MQL5 >> Experts 폴더에 붙여넣고 터
베타 출시 Telegram to MT5 Signal Trader 는 곧 공식 알파 버전을 출시할 예정입니다. 일부 기능은 아직 개발 중이며, 작은 버그가 발생할 수 있습니다. 문제가 있으면 꼭 보고해 주세요. 여러분의 피드백은 소프트웨어 개선에 도움이 됩니다. Telegram to MT5 Signal Trader 는 Telegram 채널 또는 그룹의 거래 신호를 자동으로 MetaTrader 5 계정으로 복사하는 강력한 도구입니다. 공개 및 비공개 채널을 모두 지원하며, 여러 신호 제공자를 여러 MT5 계정에 연결할 수 있습니다. 소프트웨어는 빠르고 안정적으로 동작하며, 복사된 거래를 완벽히 제어할 수 있습니다. 인터페이스는 깔끔하며 대시보드와 차트가 시각적으로 구성되어 있고, 직관적인 네비게이션이 가능합니다. 여러 Signal Account를 관리하고, 공급자별 설정을 세밀하게 조정하며, 모든 동작을 실시간으로 모니터링할 수 있습니다. 필수 조건 MQL의 제한으로 인해 EA는 Te
TradePanel MT5
Alfiya Fazylova
4.88 (160)
Trade Panel은 다기능 거래 도우미입니다. 이 애플리케이션에는 50개 이상의 수동 거래 기능이 포함되어 있으며 대부분의 거래 작업을 자동화할 수 있습니다. 구매하기 전에 데모 계정에서 데모 버전을 테스트할 수 있습니다. 데모 계정용 애플리케이션 체험판 다운로드: https://www.mql5.com/en/blogs/post/750865 . 전체 지침 여기 . 거래. 한 번의 클릭으로 거래를 수행할 수 있습니다: 리스크 자동 계산과 함께 예약 주문 및 포지션 열기. 한 번의 클릭으로 여러 주문 및 포지션 열기. 주문 그리드 열기. 예약 주문 및 포지션을 그룹별로 닫기. 포지션 방향 전환 (Buy 닫기 > Sell 열기, Sell 닫기 > Buy 열기). 포지션 잠금 (부족한 포지션을 열어 Buy와 Sell 포지션의 수량을 동일하게 만들기). 모든 포지션 한 번의 클릭으로 부분적으로 닫기. 모든 포지션의 테이크 프로핏과 스톱로스를 같은 가격 수준에 설정. 모든 포지션의 스톱로스를
파워 캔들 전략 스캐너 - 자체 최적화 다중 종목 설정 찾기 도구 파워 캔들 전략 스캐너는 마켓 워치에 등록된 모든 종목에 대해 파워 캔들 지표와 동일한 자체 최적화 엔진을 동시에 실행합니다. 하나의 패널에서 현재 통계적으로 거래 가능한 종목, 각 종목별 최적의 전략, 최적의 손절매/익절 조합을 알려주며, 새로운 신호가 발생하면 즉시 알림을 전송합니다. 이 도구는 Stein Investments 에코시스템의 일부입니다. 18개 이상의 도구와 함께 당신의 1대1 AI 트레이딩 멘토 Max.  항상 대기 중, 모든 인디케이터를 깊이 있게 이해, 무언가를 차근차근 생각해보고 싶은 순간에 도움을 줍니다.  https://stein.investments 에서 만나보세요 완벽한 시장 모니터링. 종목당 3,000건 이상의 자동 최적화. 2가지 알림 유형. 한 번의 클릭으로 차트를 전환하고 바로 거래하세요. 이 도구가 필요한 이유 대부분의 다중 종목 스캐너는 가격 변동만 보여줍니다. 티커별
Farmed Hedge Yield Farming | All Markets (Manual - Hybrid - Semi/Automated EA) MULTI-ASSET SUPPORT Trade any asset available on your broker - Forex: Major, Minor, Exotic pairs - Crypto: BTC, ETH, XRP, SOL, BNB - Stocks: Apple, Tesla, Amazon, Google, etc. - Commodities: Gold, Silver, Oil, Gas - Indices: US30, NAS100, SPX500, DAX40 - Any CFD your broker offers VERIFIED TRADING RESULTS - Farmed Hedge Yield Axi Copy:  https://www.mql5.com/en/signals/2356376 - Farmed Hedge Yield Exn Copy:   https:/
Quant AI Agents
Ho Tuan Thang
5 (1)
Quant AI Agents are independent trading Expert Advisors. Instead of trading using a fixed strategy like other conventional EAs, Quant AI Agents   is a   multi-agent AI trading framework   that turns natural-language strategy prompts into live.  WANT THE SAME RESULTS AS MY LIVE SIGNAL?   Use the exact same brokers I do:   IC MARKETS , IC TRADING   .  Unlike the centralized stock market, Forex has no single, unified price feed.  Every broker sources liquidity from different providers, creating un
Exp COPYLOT CLIENT for MT5
Vladislav Andruschenko
3.94 (34)
MetaTrader 5용 전문 트레이드 복사기 MetaTrader 용 빠르고 전문적이며 신뢰할 수 있는 트레이드 복사기 입니다. COPYLOT 은 MT4와 MT5 터미널 간의 Forex 거래 복사를 지원하며, Hedge 및 Netting 계좌를 모두 지원합니다. COPYLOT MT5 버전 지원 구성: - MT5 Hedge → MT5 Hedge - MT5 Hedge → MT5 Netting - MT5 Netting → MT5 Hedge - MT5 Netting → MT5 Netting - MT4 → MT5 Hedge - MT4 → MT5 Netting MT4 버전 전체 설명 + DEMO + PDF 구매 방법 설치 방법 로그 파일 확인 방법 테스트 및 최적화 방법 Expforex의 모든 제품 MT4 터미널로도 거래를 복사할 수 있습니다(MT4 → MT4, MT5 → MT4): COPYLOT CLIENT for MT4 COPYLOT은 2개, 3개, 심지어 10개의 터미널과 동시에 작동할
FUTURES ORDERFLOW FOOTPRINT CHART Professional OrderFlow EA for MetaTrader 5 Version 1.01| Professional tool for real traders | Institutional-Grade Visualization STRATEGY TESTER USERS - PLEASE SELECT EVERY REAL TICK WHEN TESTING AND YOU HAVE DOWNLOADED HISTORICAL DATA. IF YOU SEE A WAITING SCREEN AND IT IS NOT DOWNLOADING, IT MEANS YOU HAVE LOW HISTORICAL DATA. TRY 1 MIN AND 5 MIN FIRST ON 1 DAY DATA. ONE DAY DATA SHOULD BE THE NEWEST AND MOST CURRENT DATE. PLEASE WAIT UNTIL THE MARKET HAS ROL
Telegram to MT5 Multi-Channel Copier 는 Telegram 채널의 트레이딩 신호를 자동으로 MetaTrader 5로 직접 복사합니다. 봇도, 브라우저 확장 프로그램도, 수동 복사도 필요 없습니다. Telegram에서 신호를 받으면 EA가 몇 초 안에 터미널에서 거래를 엽니다. 본 제품은 두 가지 구성 요소로 구성되어 있습니다: Telegram 채널을 감시하는 Windows 애플리케이션과 MT5 터미널에서 신호를 실행하는 이 Expert Advisor입니다. MT4 버전도 제공됩니다. 설정 가이드 및 애플리케이션 다운로드: https://www.mql5.com/en/blogs/post/768988 작동 방식 Windows 애플리케이션은 봇이 아닌 사용자 자신의 API 자격 증명을 사용하여 Telegram에 연결됩니다. 이는 프라이빗 및 VIP 채널을 포함하여 구독 중인 모든 채널, 그룹 또는 주제를 읽을 수 있음을 의미합니다. 신호를 감지하면 이를 파싱하여
Telegram To MT5 Receiver
Levi Dane Benjamin
4.53 (15)
가입한 모든 채널에서 (개인 및 제한된 채널 포함) 시그널을 바로 MT5로 복사합니다.   이 도구는 사용자를 고려하여 설계되었으며 거래를 관리하고 모니터하는 데 필요한 많은 기능을 제공합니다. 이 제품은 사용하기 쉽고 시각적으로 매력적인 그래픽 인터페이스로 제공됩니다. 설정을 사용자 정의하고 제품을 몇 분 안에 사용할 수 있습니다! 사용자 가이드 + 데모  | MT4 버전 | 디스코드 버전 데모를 시도하려면 사용자 가이드로 이동하십시오. Telegram To MT5 수신기는 전략 테스터에서 작동하지 않습니다! Telegram To MT5 특징 여러 채널에서 동시에 신호를 복사합니다. 개인 및 제한된 채널에서 신호를 복사합니다. Bot 토큰이나 채팅 ID가 필요하지 않습니다.   (원하는 경우에는 사용할 수 있습니다) 위험 % 또는 고정된 로트로 거래합니다. 특정 심볼을 제외합니다. 모든 신호를 복사할지 또는 복사할 신호를 사용자 정의할지 선택할 수 있습니다. 모든 신호를 인
Premium Trade Manager - 코치가 내장된 트레이딩 패널 Premium Trade Manager 는 차트 안에 트레이딩 코치를 심어놓은 도구입니다. 주문을 확정하기 전에, AI 트레이딩 코치 Max가 설정된 거래를 직접 읽고 명확한 판단을 내려줍니다. 스톱이 규율 있는 접근 방식에 맞는지, 리스크 크기가 합리적인지, 고영향 뉴스 이벤트가 몇 분 후에 있는지, 프롭 펌 한도에 근접했는지. 그 아래에는 완전한 실행 엔진이 있습니다. 원클릭 리스크 기반 진입, 드래그 가능한 스톱과 타겟 라인, 최대 4단계 분할 익절, 7가지 트레일링 방식, 실시간 프롭 펌 컴플라이언스, 뉴스 가드, 그리고 자체 비용을 평가하는 스프레드까지. 결정은 당신이 내립니다. Max가 두 번째 시선으로 확인합니다. 패널이 그 이후의 모든 것을 처리합니다. 구매 전에 직접 체험해 보세요. 브라우저에서 라이브 패널을 직접 클릭해볼 수 있습니다. 구매 전에 실제 사용감을 느낄 수 있는 가장 빠른 방법입니다
Trade Dashboard MT5
Fatemeh Ameri
4.95 (129)
Trade Dashboard simplifies how you open, manage, and control your trades, with built-in lot size calculation. It allows you to execute trades, manage risk, and control positions directly on the chart, with tools such as partial close, breakeven, and trailing stop. Designed to reduce manual work and help you stay focused on your trading decisions. A demo version is available for testing. Detailed explanations of features are provided within the MQL5 platform. Installation instructions are include
AI Agent Supervisor is NOT an Expert Advisor. AI Agent Supervisor   is a   multi-agent AI risk & portfolio supervisor   that watches every EA on your account and intervenes in real time.  WANT AN AI PORTFOLIO MANAGER WATCHING YOUR FLEET 24/7?   Run your fleet on the same brokers I do:   IC MARKETS , IC TRADING   .  Unlike the centralized stock market, Forex has no single, unified price feed.  Every broker sources liquidity from different providers, creating unique data streams. The Supervisor r
Telegram to mt5 pro
Janet Abu Khalil
3.67 (3)
Telegram to MT5 Pro — Advanced Telegram Signal Copier with Auto-Fix, Multi-TP, Risk Control and Full Trade Management Telegram to MT5 Pro — 전문 텔레그램 신호 복사기 Telegram to MT5 Pro는 텔레그램 신호를 MetaTrader 5 계정으로 자동으로 직접 실행하는 고성능 트레이드 복사기로, 리스크, 실행, 트레이드 관리에 대한 완전한 제어를 제공합니다. 이 시스템은 두 가지 구성 요소로 이루어져 있습니다: • MetaTrader 5 내부에서 실행되는 Expert Advisor (EA) • 텔레그램에 연결되어 신호를 로컬로 EA에 전송하는 데스크톱 브리지 애플리케이션 두 구성 요소는 동일한 컴퓨터에서 실행되어야 합니다. MQL5 플랫폼 제한으로 인해 EA는 텔레그램에 직접 연결할 수 없습니다. 브리지는 텔레그램을 처리하고 EA는 거래를 실행합니다. 지원 및 설치
Seconds Chart MT5
Boris Sedov
4.61 (18)
Seconds Chart - MetaTrader 5에서 초 단위 차트를 생성하는 독특한 도구입니다. Seconds Chart 를 사용하면 초 단위로 설정된 타임프레임으로 차트를 작성할 수 있어, 표준 분 또는 시간 단위 차트에서는 불가능한 유연성과 정밀한 분석이 가능합니다. 예를 들어, S15 타임프레임은 15초 동안의 캔들로 구성된 차트를 의미합니다. 사용자 정의 심볼을 지원하는 모든 인디케이터와 전문가 어드바이저를 사용할 수 있습니다. 이를 사용하는 것은 표준 차트에서 거래하는 것만큼 편리합니다. 표준 도구와 달리, Seconds Chart 는 초고속 타임프레임에서도 높은 정확도와 지연 없이 작업할 수 있도록 지원합니다. 무료 데모: Seconds Chart v2.29 Demo.ex5 무료 데모를 다운로드하고 직접 확인하십시오: 완전한 기능 - 모든 기능 사용 가능 24시간 테스트 - 정확성과 편리성을 평가하기에 충분한 시간 데모 계정만 - 대부분의 브로커에서 쉽게 개설 가능
Entry In The Zone with SMC Multi Timeframe is a real-time 2-in-1 market analysis tool that combines market structure analysis and a No Repaint BUY / SELL signal system into a single indicator, built on Smart Money Concepts (SMC) — a widely adopted framework used by professional traders to understand market structure. This indicator helps you see the market more clearly, make decisions based on structure rather than guesswork, and focus on high-probability zones where price is more likely to reac
Timeless Charts
Samuel Manoel De Souza
5 (7)
Timeless Charts is an all-in-one trading utility for professional traders. It combines custom chart types such as Seconds Charts and Renko with advanced order flow analysis using Footprints , Clusters , Volume Profiles , VWAP studies, and anchored analysis tools for deeper market insight. Trading and position management are handled directly from the chart through an integrated trade management panel , while Market Replay and Virtual Accounts provide environments for practicing trading skills and
작동 데모 다운로드 Copy Cat More (카피캣) MT5 트레이드 카피어 (Trade Copier) 는 로컬 트레이드 카피어이자, 오늘날의 트레이딩 과제를 위해 설계된 완전한 리스크 관리 및 실행 프레임워크입니다. 프롭 펌 (prop firm) 챌린지부터 개인 포트폴리오 관리까지, 견고한 실행, 자본 보호, 유연한 설정, 고급 트레이드 처리의 조합으로 모든 상황에 적응합니다. 이 카피어는 마스터 (Master, 송신측) 와 슬레이브 (Slave, 수신측) 두 모드 모두에서 작동하며, 시장가 주문과 대기 주문, 트레이드 수정, 부분 청산, 상호 청산 (Close By) 작업을 실시간으로 동기화합니다. 데모 및 실거래 계좌, 트레이딩 또는 인베스터 로그인 모두와 호환되며, EA·터미널·VPS가 재시작되더라도 영구 트레이드 메모리 (Persistent Trade Memory) 시스템을 통해 복구를 보장합니다. 고유 ID로 여러 마스터와 슬레이브를 동시에 관리할 수 있으며, 브로커
Footprint Chart Pro — Professional OrderFlow EA for MetaTrader 5 Version 6.34 | Professional tool for real traders | Institutional-Grade Visualization DEMO USERS - PLEASE SELECT EVERY TICK / REAL TICK WHEN TESTING AND YOU HAVE DOWNLOADED HISTORICAL DATA. IF YOU SEE A WAITING SCREEN AND IT IS NOT DOWNLOADING, IT MEANS YOU HAVE LOW HISTORICAL DATA. TRY 1 MIN AND 5 MIN FIRST ON 1 DAY DATA. ONE DAY DATA SHOULD BE THE NEWEST AND MOST CURRENT DATE. PLEASE WAIT UNTIL THE MARKET HAS ROLLED OVER PERIOD.
The product will copy all telegram signal to MT5 ( which you are member) , also it can work as remote copier.  Easy to set up, copy order instant, can work with almost signal formats, image signal,  s upport to translate other language to English Work with all type of channel or group, even channel have "Restrict Saving Content", work with  multi channel, multi MT5 Work as remote copier: with signal have ticket number, it will copy exactly via ticket number. Support to backtest signal. How to s
Trade Manager DaneTrades
Levi Dane Benjamin
4.28 (29)
거래 관리자는 위험을 자동으로 계산하는 동시에 거래를 빠르게 시작하고 종료하는 데 도움을 줍니다. 과잉 거래, 복수 거래 및 감정 거래를 방지하는 데 도움이 되는 기능이 포함되어 있습니다. 거래를 자동으로 관리할 수 있으며 계정 성과 지표를 그래프로 시각화할 수 있습니다. 이러한 기능은 이 패널을 모든 수동 거래자에게 이상적으로 만들고 MetaTrader 5 플랫폼을 향상시키는 데 도움이 됩니다. 다중 언어 지원. MT4 버전  |  사용자 가이드 + 데모 트레이드 매니저는 전략 테스터에서 작동하지 않습니다. 데모를 보려면 사용자 가이드로 이동하세요. 위기 관리 % 또는 $를 기준으로 위험 자동 조정 고정 로트 크기 또는 거래량과 핍을 기반으로 한 자동 로트 크기 계산을 사용하는 옵션 RR, Pips 또는 Price를 사용한 손익분기점 손실 설정 추적 중지 손실 설정 목표 달성 시 모든 거래를 자동으로 마감하는 최대 일일 손실률(%)입니다. 과도한 손실로부터 계정을 보호하고 과도한
Grid Manual MT5
Alfiya Fazylova
4.73 (22)
"Grid Manual"은 주문 그리드 작업을 위한 거래 패널입니다. 이 유틸리티는 보편적이며 유연한 설정과 직관적인 인터페이스를 제공합니다. 그것은 손실을 평균화하는 방향뿐만 아니라 이익을 증가시키는 방향으로 주문 그리드와 함께 작동합니다. 거래자는 주문 그리드를 만들고 유지할 필요가 없으며 유틸리티에서 수행합니다. 거래자가 주문을 시작하는 것으로 충분하며 "Grid Manual"는 자동으로 그를 위한 주문 그리드를 생성하고 거래가 마감될 때까지 그와 동행할 것입니다. 전체 설명 및 데모 버전 여기 . 유틸리티의 주요 기능: 모바일 터미널을 포함하여 어떤 방식으로든 열린 주문과 함께 작동합니다. "제한" 및 "중지"의 두 가지 유형의 그리드와 함께 작동합니다. 고정 및 동적(ATR 표시기 기반)의 두 가지 유형의 그리드 간격 계산과 함께 작동합니다. 오픈 오더 그리드의 설정을 변경할 수 있습니다. 차트에서 각 주문 그리드의 손익분기점 수준을 표시합니다. 각 주문 그리드에 대한 이익
YuClusters
Yury Kulikov
4.93 (43)
Attention: You can view the program operation in the free version  YuClusters DEMO .  YuClusters is a professional market analysis system. The trader has unique opportunities to analyze the flow of orders, trade volumes, price movements using various charts, profiles, indicators, and graphical objects. YuClusters operates on data based on Time&Sales or ticks information, depending on what is available in the quotes of a financial instrument. YuClusters allows you to build graphs by combining da
================================================================================ POC BREAKOUT - V20.72. Full Professional Grade Toolkit ================================================================================ POC Breakout is a full MetaTrader 5 trading dashboard for discretionary traders who want breakout signals, Point of Control (POC) context, volume profiles, order flow, market structure, news, alerts, and advanced trade planning in one professional workspace. Attached directly to you
EA Auditor
Stephen J Martret
5 (3)
EA Auditor is an independent analysis tool for traders evaluating Expert Advisors and trading signals on MetaTrader 5. It audits backtest reports, reviews posted developer signals, and cross-verifies the two against each other to help traders assess strategies before committing capital. The MQL5 market offers a wide range of Expert Advisors from many developers, with varying approaches, quality, and transparency. EA Auditor provides a consistent, data-driven framework for reviewing them, answer
Royal Copier
Janet Abu Khalil
5 (1)
Royal Copier — 전문 MT5 트레이드 복사기 Royal Copier는 MetaTrader 5용 전문 로컬 실시간 트레이드 복사기입니다. 이제 두 기능이 하나의 MT5 Expert Advisor 안에 통합되었습니다. 입력값에서 EA를 Master 모드 로 실행할지 Client 모드 로 실행할지 선택하면 됩니다. 즉, 동일한 EA를 원본 계정과 수신 계정 모두에서 사용할 수 있으며, 기존 복사기의 동작 방식은 그대로 유지됩니다. Royal Copier는 다음과 같은 일반적인 계정 간 복사를 지원합니다. MT5에서 MT5 MT5에서 MT4 MT4에서 MT4 MT4에서 MT5 MT4와 복사하려면 MT4_Copier 를 사용하십시오. 작동 방식 Royal Copier는 동일한 Windows PC의 공유 파일을 통해 작동하는 로컬 복사기입니다. EA가 Master 모드 로 설정되면 원본 계정을 모니터링하고 모든 거래 활동을 공유 파일에 기록합니다. EA가 Client 모드 로 설정되
Anchor Trade Manager
Kalinskie Gilliam
5 (3)
Anchor: The EA Manager Run your full EA portfolio without conflicts, without stacked risk, and without watching every chart yourself. Anchor coordinates up to 64 Expert Advisors on a single account. Attach Anchor to any chart. Type your EA names and magic numbers in one line. Click OK. Anchor begins coordinating immediately. Built for portfolios. Built for discipline. Built for prop firms. The Problem Running multiple EAs on the same account creates risk. Two gold EAs can open opposite positions
Trade Manager DashPlus
Henry Lyubomir Wallace
5 (13)
DashPlus 는 MetaTrader 5 플랫폼에서 거래 효율성과 효과를 향상시키기 위해 설계된 고급 거래 관리 도구입니다. 리스크 계산, 주문 관리, 고급 그리드 시스템, 차트 기반 도구 및 성과 분석 등 포괄적인 기능을 제공합니다. 주요 기능 1. 리커버리 그리드 불리한 시장 상황에서 거래를 관리하기 위한 평균화 및 유연한 그리드 시스템을 구현합니다. 거래 회복을 최적화할 수 있도록 전략적인 진입 및 종료 포인트를 제공합니다. 2. 스택 그리드 강한 시장 움직임 동안 포지션을 추가하여 유리한 거래에서 잠재적 수익을 극대화하도록 설계되었습니다. 유리한 시장 트렌드에서 승률을 높이며 거래를 확장할 수 있도록 합니다. 3. 손익(P&L) 라인 차트에서 잠재적인 수익 및 손실 시나리오를 시각적으로 표현합니다. 설정을 조정하고 P&L 라인을 드래그하여 실행 전에 다양한 거래 결과를 평가할 수 있습니다. 4. 바스켓 모드 동일한 심볼에 여러 포지션을 단일 집계 포지션으로 결합하여 관리합니
제작자의 제품 더 보기
This indicator is designed for M1 timeframe and shows: Sum of points when the price goes up (Green Histogram). Sum of points when the price goes down (Red Histogram).  In other words, by the number and ratio of bullish points to bearish ones, you can do a technical analysis of the state of the market. If the green histogram prevails over the red one, you can conclude that at the moment the buyers are stronger than the sellers, and vice versa, if the red histogram prevails over the green, the se
This Multi TimeFrame indicator is based on the "Fractals" classical indicator. 2 Inputs: TimeFrame1; TimeFrame2; You can put any available TimeFrame values (from M1 (Period_M1) to MN1 (Period_MN1)) equal or greater ( >= ) than the Period of the current Time Frame. The last Fractals will shown as color lines (Dots Line) of Support and Resistance for the Price moving.
This is a Multi-Time indicator which allows to display RSI and Stochastic indicators from upper timeframes on a single chart. As an example: a single chart EURUSD M5 and RSI (blue line) and Stochastic (yellow line) from H1. Red Histogram is representing Lower trend and Green Histogram is representing Upper trend.
When you put this Multi TimeFrame Parabolic SAR indicator on the chart it will automatically use Parabolic SAR from next available 3 timeframes. Green arrow will show the beginning of Up trend and Red arrow will show the beginning of Down trend. If AlertsEnabled = true, the indicator will show the Alert (message window) with a text like this: "Price going Down on ", Symbol(), " - ", Period(), " min", " price = ", Bid; If eMailEnabled = true the Indicator will send you an eMail with the same text
The zero line is characterized the Flat trend. V-shaped impulse indicates the entrance to the opposite direction. U-shaped impulse = entry orders in the same direction. If AlertsEnabled = true, the indicator will show the Alert (message window) with a text like this: "Price going Down on ", Symbol(), " - ", Period(), " min", " price = ", Bid; If eMailEnabled = true the indicator will send you an eMail with the same text an Alert message with subject: "Trinity-Impolse" (of course you have to chec
The indicator displays the usual Moving Average with input parameters: maPeriod_1; maMethod_1; maAppPrice_1. Then it calculates and displays MA on MA1 with input parameters: maPeriod_2; maMethod_2. Then it calculates and displays MA on MA2 with input parameters: maPeriod_3; maMethod_3. If AlertsEnabled = true the Indicator will show the Alert (message window) with a text like this: "Price going Down on ", Symbol(), " - ", Period(), " min", " price = ", Bid; If eMailEnabled = true the Indicator w
Multi TimeFrame Indicator "MTF CCI Trigger" based on the Commodity Channel Index from the upper TF (input parameter "TimeFrame") yellow line. Aqua line is representing ATR envelopes from the current TF. Green and Red arrows is triggered by CCI and represented UP and DOWN trends accordingly.
The BBImpulse indicator is based on the standard Moving Average indicator. You have MA input parameters: maPeriod - Moving Average period; maMODE - Moving Average mode (0 = MODE_SMA; 1 = MODE_EMA; 2 = MODE_SMMA; 3 = MODE_LWMA); maPRICE - Applied price (0=PRICE_CLOSE; 1=PRICE_OPEN; 2=PRICE_HIGH; 3=PRICE_LOW; 4=PRICE_MEDIAN; 5=PRICE_TYPICAL; 6=PRICE_WEIGHTED). Green Histogram is representing an UP-trend, Red Histogram is representing a Down-trend.
Multi TimeFrame indicator MTF ADX with Histogram shows ADX indicator data from the TF by your choice. You may choose a TimeFrame equal or greater than current TF. Yellow line is representing a price trend from the upper TF. Green line is representing +DI from the upper TF. Red line is representing -DI from the upper TF. Green histogram is displaying an Up-trend. Red histogram is displaying a Down-trend.
This Indicator creates 2 white lines based on Exponential Moving Averag e of High and Low prices. You can regulate how many bars will be involved in the calculation with input parameter HL_Period. Red and Blue arrows are displaying the moment to go Short and Long trades accordingly.
The most common way to interpreting the price Moving Average is to compare its dynamics to the price action. When the instrument price rises above its Moving Average, a buy signal appears, if the price falls below its moving average, what we have is a sell signal. To avoid a spontaneous entries one may use this update from Moving Average Indicator = Stepper-MA.
Envelopes technical Indicator is formed with two Moving Averages one of which is shifted upward and another one is shifted downward. Envelopes define the upper and the lower margins of the price range. Signal to sell appears when the price reaches the upper margin of the band; signal to buy appears when the price reaches the lower margin. To avoid a spontaneous entries one may use this update from Envelopes Indicator = Envelopes-Stepper.
The interpretation of the Bollinger Bands is based on the fact that the prices tend to remain in between the top and the bottom line of the bands. Abrupt changes in prices tend to happen after the band has contracted due to decrease of volatility; If prices break through the upper band, a continuation of the current trend is to be expected; If the pikes and hollows outside the band are followed by pikes and hollows inside the band, a reverse of trend may occur; The price movement that has starte
Fibonacci sequence is defined by integer sequence: 0, 1, 1, 2, 3, 5, 8, 13, 34, 55, 89, 144, ... By definition, it starts from 0 and 1, the next number is calculated as a sum of two previous numbers. Instead of the standard moving average, the indicator uses the caluclation of average price in form: Bar0 + Bar1 + Bar2 + Bar3 + Bar5 + Bar8 + Bar13 +... Input parameters:  FiboNumPeriod (15) - Fibonacci period; nAppliedPrice (0) - applied price (PRICE_CLOSE=0; PRICE_OPEN=1; PRICE_HIGH=2; PRICE_LOW=
This indicator present a main Moving Average line with input parameters maPeriod_1, maMethod_1 and maAppPrice_1. The second line will be a calculation of the Moving Average data of a first line with input parameters maPeriod_2, maMethod_2. The third line will be a calculation of the Moving Average data of a second line with input parameters maPeriod_3, maMethod_3. To avoid a spontaneous entries one may use this indicator-stepper.
Average Bar
Leonid Basis
This indicator (as almost all others) is based on classical Moving Averages. It shows the Average Bar under the current bar colored in aqua or over the current bar colored in orange. Input Parameters: ma_Period and ma_Method. The Average Bar maybe helpful to predict where the price will move in the nearest future. Of course, this "near future" depends of the current time frame.
Buy when the market is falling and sell when the market is rising. When the market is moving down you start observing and looking for buy signals. When the market is moving up you start looking for sell signals. This indicator points to the moments to Buy (Blue arrow) and to Sell (Orange arrow). Two input parameters: barsNumber and step for optimization (depending on symbol and Time Frame).
This indicator shows: A green light in case the price goes up; A red light in case the price goes down; A yellow light in case there are a sideways trend. A sideways trend is the horizontal price movement that occurs when the forces of supply and demand are nearly equal. This typically occurs during a period of consolidation before the price continues a prior trend or reverses into a new trend
Sum of Ticks
Leonid Basis
This indicator is created for M1 timeframe. It shows how many ticks has occurred during current minute and ( after the slash) the sum of points Up (aqua color) and Down (orange color). In times of a high trading activity a grow up number of ticks Up and Down will signal of a big move of the price in the near future. In times of a high trading activity a grow up number of sum of points Up and Down will signal of a big move of the price in the near future too.
CCI Envelopes
Leonid Basis
Two yellow lines. This is similar to classical Envelopes but with automatic deviation. The Envelopes indicator is   a tool that attempts to identify the upper and lower bands of a trading range. Aqua line. This is a classical Commodity Channel Index added to the Envelopes on the chart, not in a separate window. The Commodity Channel Index ( CCI ) is a technical   indicator   that measures the difference between the current price and the historical average price.
Probability
Leonid Basis
Probability deals with the likelihood of an event happening.   Forex   probability indicates a possibility at a specific time. This is because the forex market is highly volatile, and predicting future events affecting it is impossible. This indicator will show a positive number above the current High or negative number under the current Low as a probability of the trend. Higher time frames usually show a higher probability, even more then 100%.
Envelopes is an excellent indicator when the market is trending. Open Long position when the ClosePrice crossed the upper Aqua band. Close Long position when the Price crossed the upper Yellow band moving down. Open Short position when the ClosePrice crossed the lower Aqua band. Close Short position when the Price crossed the lower Yellow band moving up.
Moving Average Bars is a self-explanatory indicator with one input parameter: nPeriod. When the previous Price Close is above the previous indicator Bar, the probability to go Long is very high.   When the previous Price Close is under the previous indicator Bar, the probability to go Short is very high.
This indicator is based on the same idea as https://www.mql5.com/en/market/product/2406 , but instead of Average Bars it uses series or Fibonacci sequence. When the previous Price Close is above the previous indicator Bar, the probability to go Long is very high. When the previous Price Close is under the previous indicator Bar, the probability to go Short is very high.
This indicator is based on two ideas: Correlations between 5 main currency pairs: EURUSD, GBPUSD, USDCHF, USDJPY, USDCAD; US Dollar Index = the value of the United States dollar relative to a basket of foreign currencies. The use of the indicator is the same as classical  Commodity Channel Index  (CCI) indicator. CCI is calculated with the following formula:  (Typical Price - Simple Moving Average) / (0.015 x Mean Deviation) (Typical Price - Simple Moving Average) / (0.015 x Mean Deviation)
Tick by Tick
Leonid Basis
A  tick  is a measure of the minimum upward or downward movement in the  price  of a security. A  tick  can also refer to the change in the  price  of a security from one trade to the next trade.  This indicator will show amounts of ticks when the price goes up and down. This indicator is designed for M1 time frame and shows: Sum of points when the price goes up (Green Histogram). Sum of points when the price goes down (Red Histogram). 
This indicator is a combination of 2 classical indicators MA and RVI. The Relative Vigor Index (RVI) is a momentum indicator used in technical analysis that measures the strength of a trend by comparing a security's closing price to its trading range while smoothing the results using a simple moving average   The input parameter  counted_bars  determines how many bars the indicator's lines will be visible. The input parameter MaRviPeriod  is used for MA and RVI calculation.
This indicator is a combination of 2 classical indicators: MA and Force Index. The input parameter  counted_bars  determines on how many bars the indicator lines will be visible. The input parameter  MaForcePeriod  is used for MA and Force calculation. You may go Long if the current price crossed Up the Ribbon (HISTOGRAM)  and you may go Short if the current price crossed Down the Ribbon (HISTOGRAM)
This indicator is a combination of 2 classical indicators: MA and CCI. Two moving averages form Upper and Lower bands. The input parameter  counted_bars  determines on how many bars the indicator's lines will be visible. The input parameter  barsNum  is used for MA and CCI calculation.
This indicator is using 2 classical indicators: Commodity Channel Index from the higher TF (which you may change using input parameter TimeFrame ) and Average True Range from the current TF. The Green ribbon indicates the upper trend and the Red ribbon indicates the down trend. Buy when the Yellow line crosses the Upper bound (Aqua line). Sell when the Yellow line crossover the Lower bound (Aqua line).
필터:
리뷰 없음
리뷰 답변