Breakout Pro Scalper Solution
- 지표
-
Remi Passanello
 Hello,
In the past 15 years, I was robot builder and code developer for heavy industry.
I started manual trading from the year 2012 and then I now use my knowledge to develop EA on MT4 and MT5.
R. - 버전: 1.11
- 업데이트됨: 8 3월 2019
- 활성화: 5
브레이크아웃 프로 스캘퍼 솔루션
이 표시기는 RPTrade Pro 솔루션 시스템의 일부입니다.
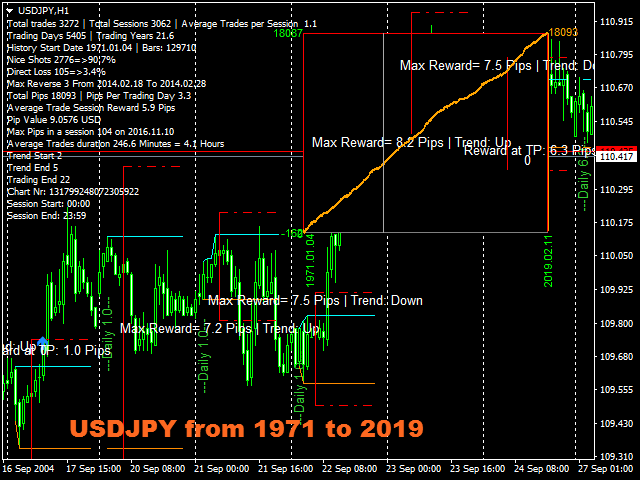
Breakout Pro Scalper Solution은 Price Action, Dynamic Support 및 Resistance를 사용하는 일일 추세 지표입니다.
누구나 사용할 수 있도록 설계되었으며 거래의 절대 초보자도 사용할 수 있습니다.
다시 칠하지 마십시오.
표시는 닫기에서 닫기로 제공됩니다.
단독으로 사용하도록 설계되어 다른 표시기가 필요하지 않습니다.
당신에게 하루의 시작에 추세와 잠재적인 이익실현을 제공합니다.
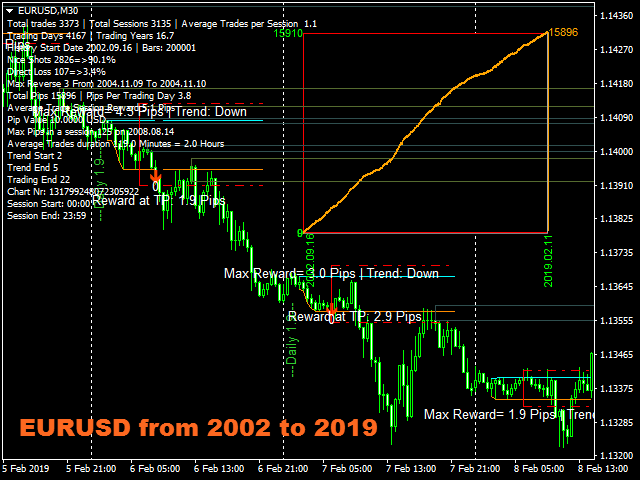
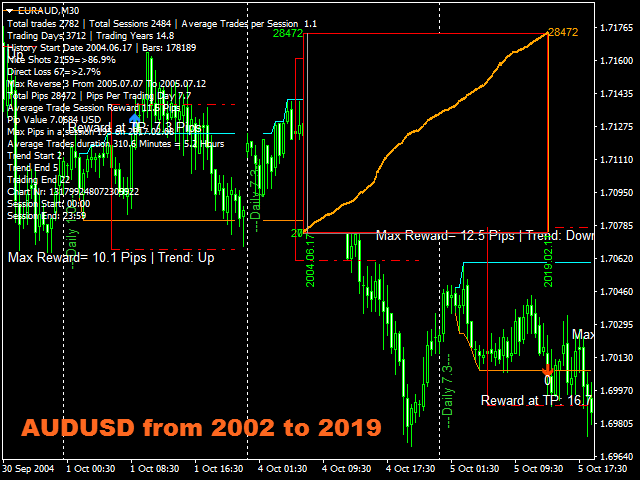
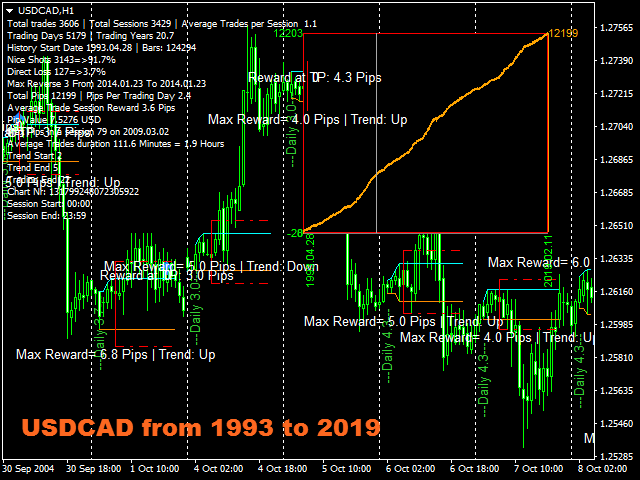
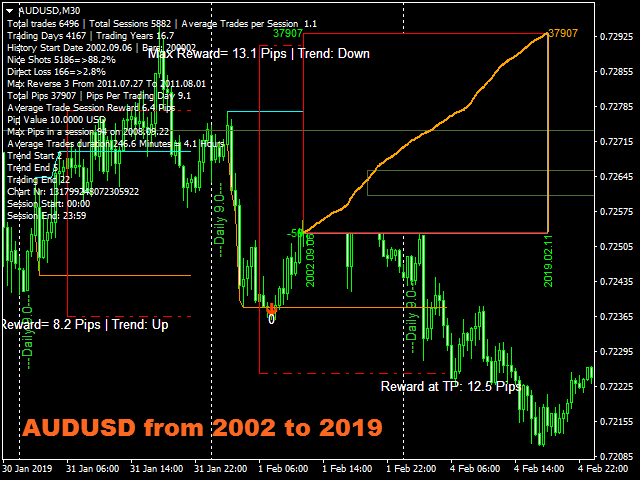
특정 그래프는 이력 데이터에 따른 잠재적 이익을 보여줍니다.
어떻게 작동합니까
Breakout Pro Scalper Solution은 가격 조치 및 동적 지원 및 저항과 결합된 브레이크아웃 전략을 사용합니다.
야간 추세와 변동성은 다음날에 사용할 것으로 분석됩니다.
이 분석에서 브레이크아웃 한계(파란색 및 진한 주황색 선)와 이익실현(Take Profit)이 결정됩니다.
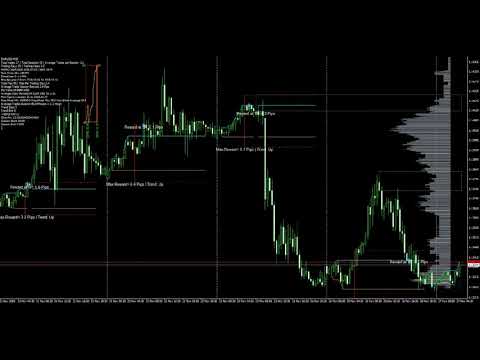
전략 및 설정의 "성공"은 차트의 그래프 덕분에 즉시 확인할 수 있습니다.
OnChart 그래프를 사용하면 전략에 "구멍"이 있는지 즉시 확인하고 더 잘 맞는 다른 TimeFrame 또는 Symbol을 선택할 수 있습니다.
캔들 종가에서 캔들 종가까지 실시간으로 추세 표시기는 신호 조건이 유효할 때까지 기다린 다음 화살표로 표시합니다(매수는 녹색, 매도는 주황색).
빨간색 점선은 이익실현 및 최종 손절매를 배치할 위치를 보여줍니다.
거래는 하나씩 표시되며 동시에 두 거래가 없습니다.
대부분의 거래(80%)가 하루 동안 완료됩니다.
브레이크아웃 프로 스캘퍼 솔루션은 다음을 나타냅니다.
거래를 여는 곳.
이익과 손절매를 가져라.
잡을 수 있는 잠재적 핍 수.
브레이크아웃 프로 스캘퍼 솔루션 작동
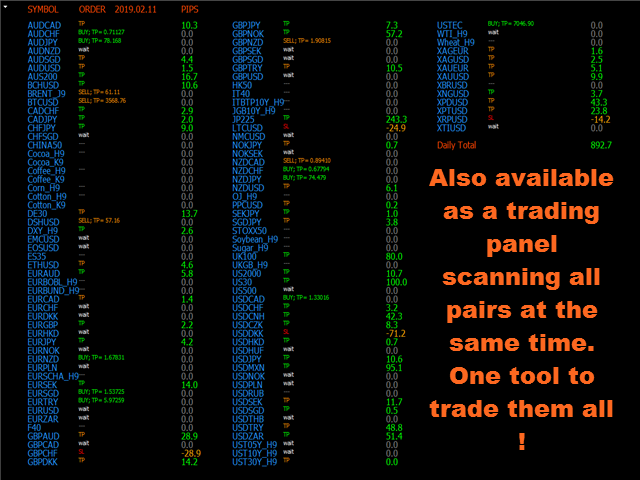
호가가 밤새 제공되는 경우 FX 쌍, 지수, 금속, 선물 또는 기타와 같은 모든 상품.
M15에서 H1까지.
모든 중개인과 함께.
브레이크아웃 프로 스캘퍼 솔루션 기능
신뢰할 수 있는 매수/매도 신호.
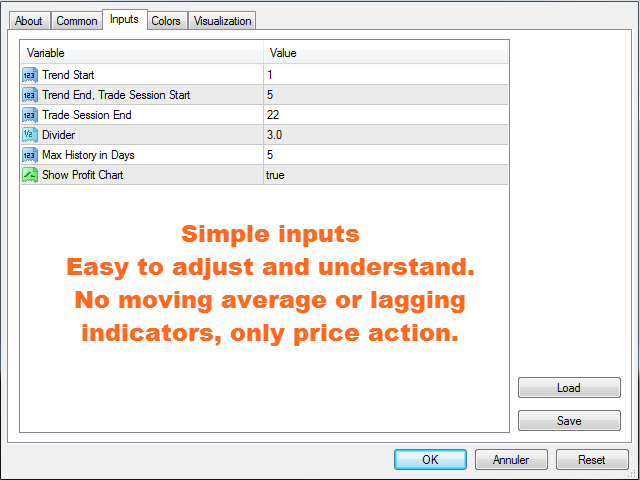
매우 간단한 입력.
온스크린 알림 + 푸시 알림 + 이메일 알림
모든 알림은 매우 상세하며 또한 이익 실현을 제공하여 모바일 장치에서 거래할 수 있습니다.
전체 기록 데이터에 대한 균형을 보여주는 차트 이익 핍 그래프. 전략이 선택한 도구와 일치하는지 쉽게 확인할 수 있습니다.
On Chart 그래프는 마우스로 움직일 수 있으며, 더블 클릭하여 화면의 편리한 위치로 이동합니다.
지지선과 저항선이 차트에 다시 표시됩니다.
가늘고 두꺼운 영역이 있는 레벨 라인이 차트에 표시됩니다.
브레이크아웃 프로 스캘퍼 솔루션 사용법
차트에 올리기만 하면 됩니다.
화살표와 이익실현 / 손절매 표시를 따르기만 하면 됩니다.
입력
트렌드 시작: [정수] 여기에 야간 트렌드의 시작 시간을 입력합니다. 기본값은 1시입니다. 0에서 23:59까지 인용되는 대부분의 Fx 쌍에 적합합니다.
추세 종료, 거래 세션 시작: [정수] 야간 추세 종료 및 거래 세션 시작 시간을 여기에 입력합니다. 기본값은 대부분의 악기에 맞습니다.
거래 세션 종료: [정수] 이 시간 이후에는 거래를 표시하지 않습니다.
Divider: [Double] 이익실현과 SL을 계산하기 위해 추세 시작과 추세 끝 사이의 거리를 나눕니다. 기본값은 3이며 TP와 SL이 야간 변동성 거리의 1/3임을 의미합니다.
최대 기록(일): [정수] 회색 가격 라인에 대한 기록 기간(일)을 설정합니다.
이익 차트 표시: [Bool] true = 이익 차트를 표시, false = 표시하지 않습니다.
테스트
서두르지 마세요. 복잡한 계산을 하기 때문에 테스트가 상당히 느립니다. 어쨌든 전략이 실제로 수익성이 있는지 확인하기 위해 오래 기다릴 필요가 없습니다.
다음 릴리스
새로운 릴리스가 곧 출시될 예정입니다. 그것은 직접 지원 및 저항을 사용하여 이익 실현, 손절매 및 필터 거래 시작 신호를 조정합니다.
세 번째는 가격 라인을 사용하여 가격 움직임을 "예측"합니다.
새 릴리스에서 과거 전략을 선택하고 사용할 수 있습니다.

incredible. Still have to find out some more details and how to avoid triggered trades, which run in the opposite direction right afterwards into a possible stopp/loss. But this simply never happens. So five stars for this masterpiece!