ScalpGuard Pro Arrows

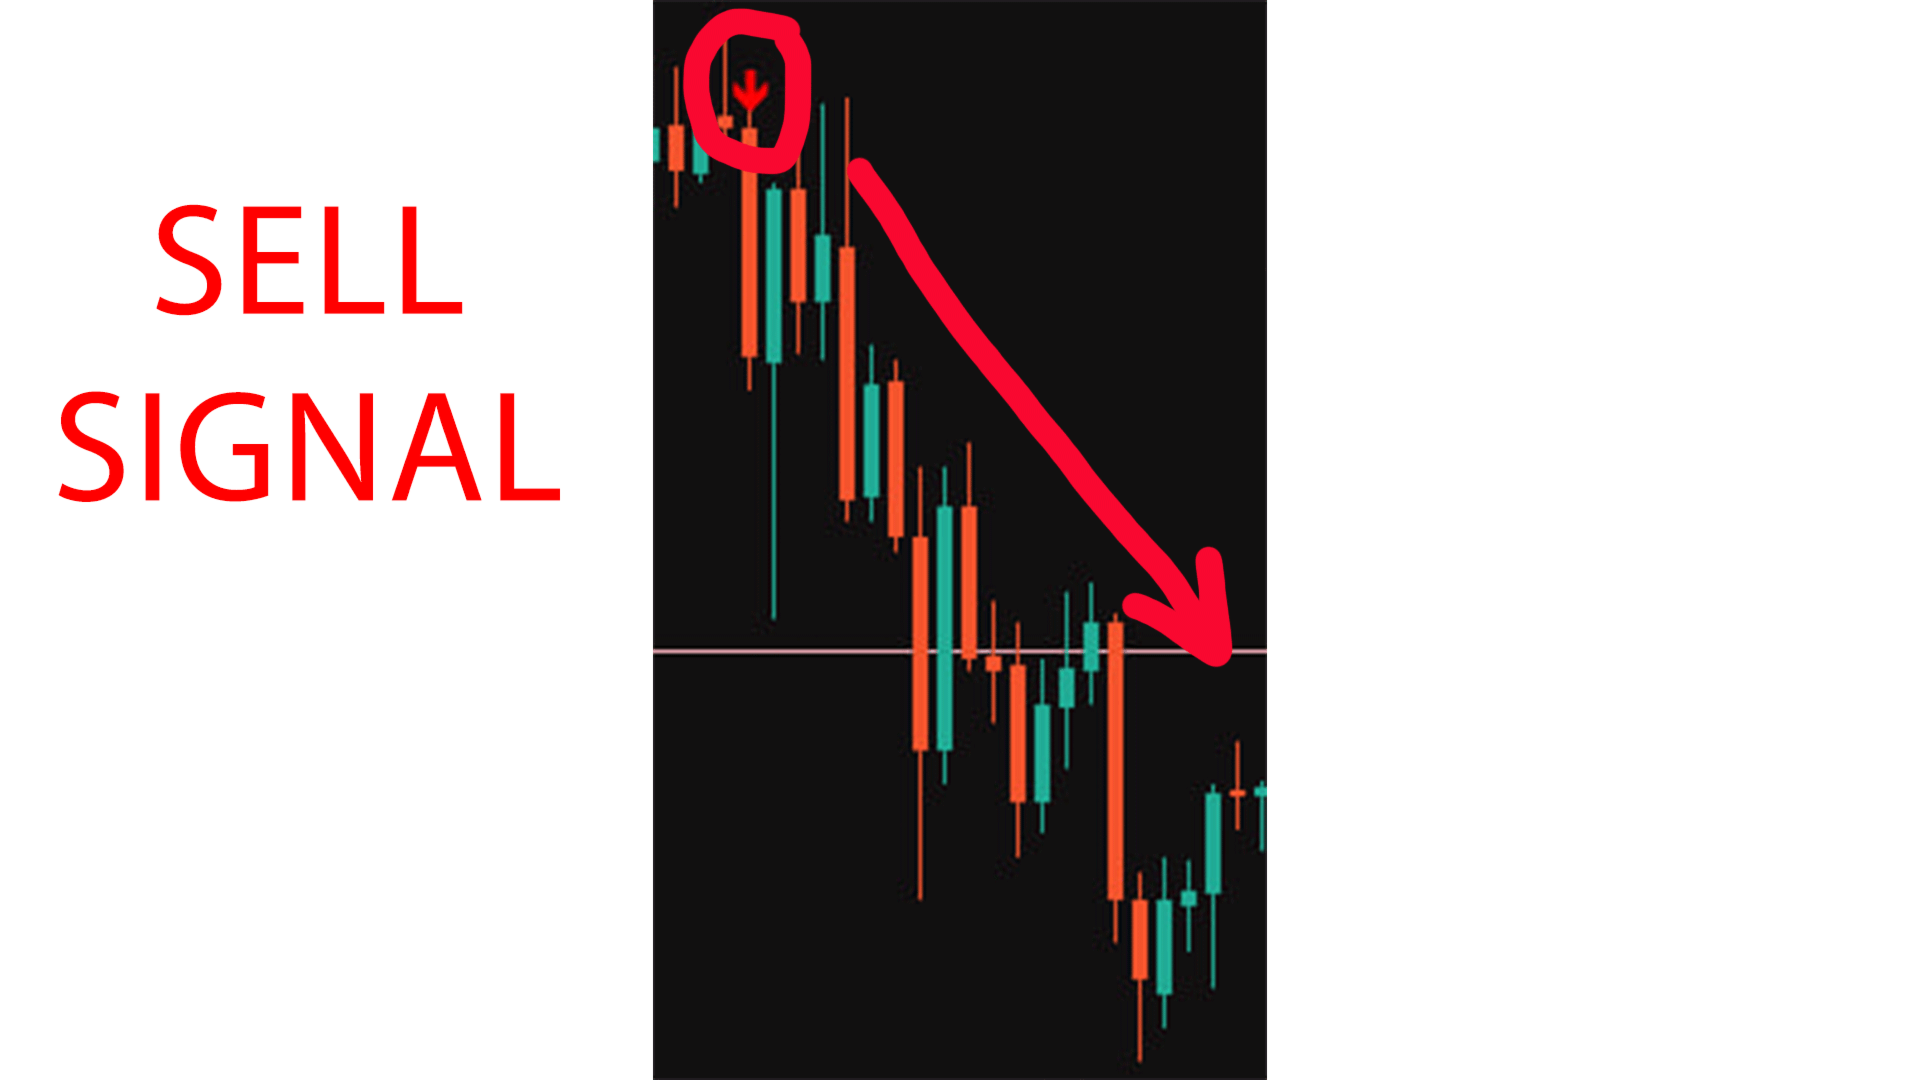
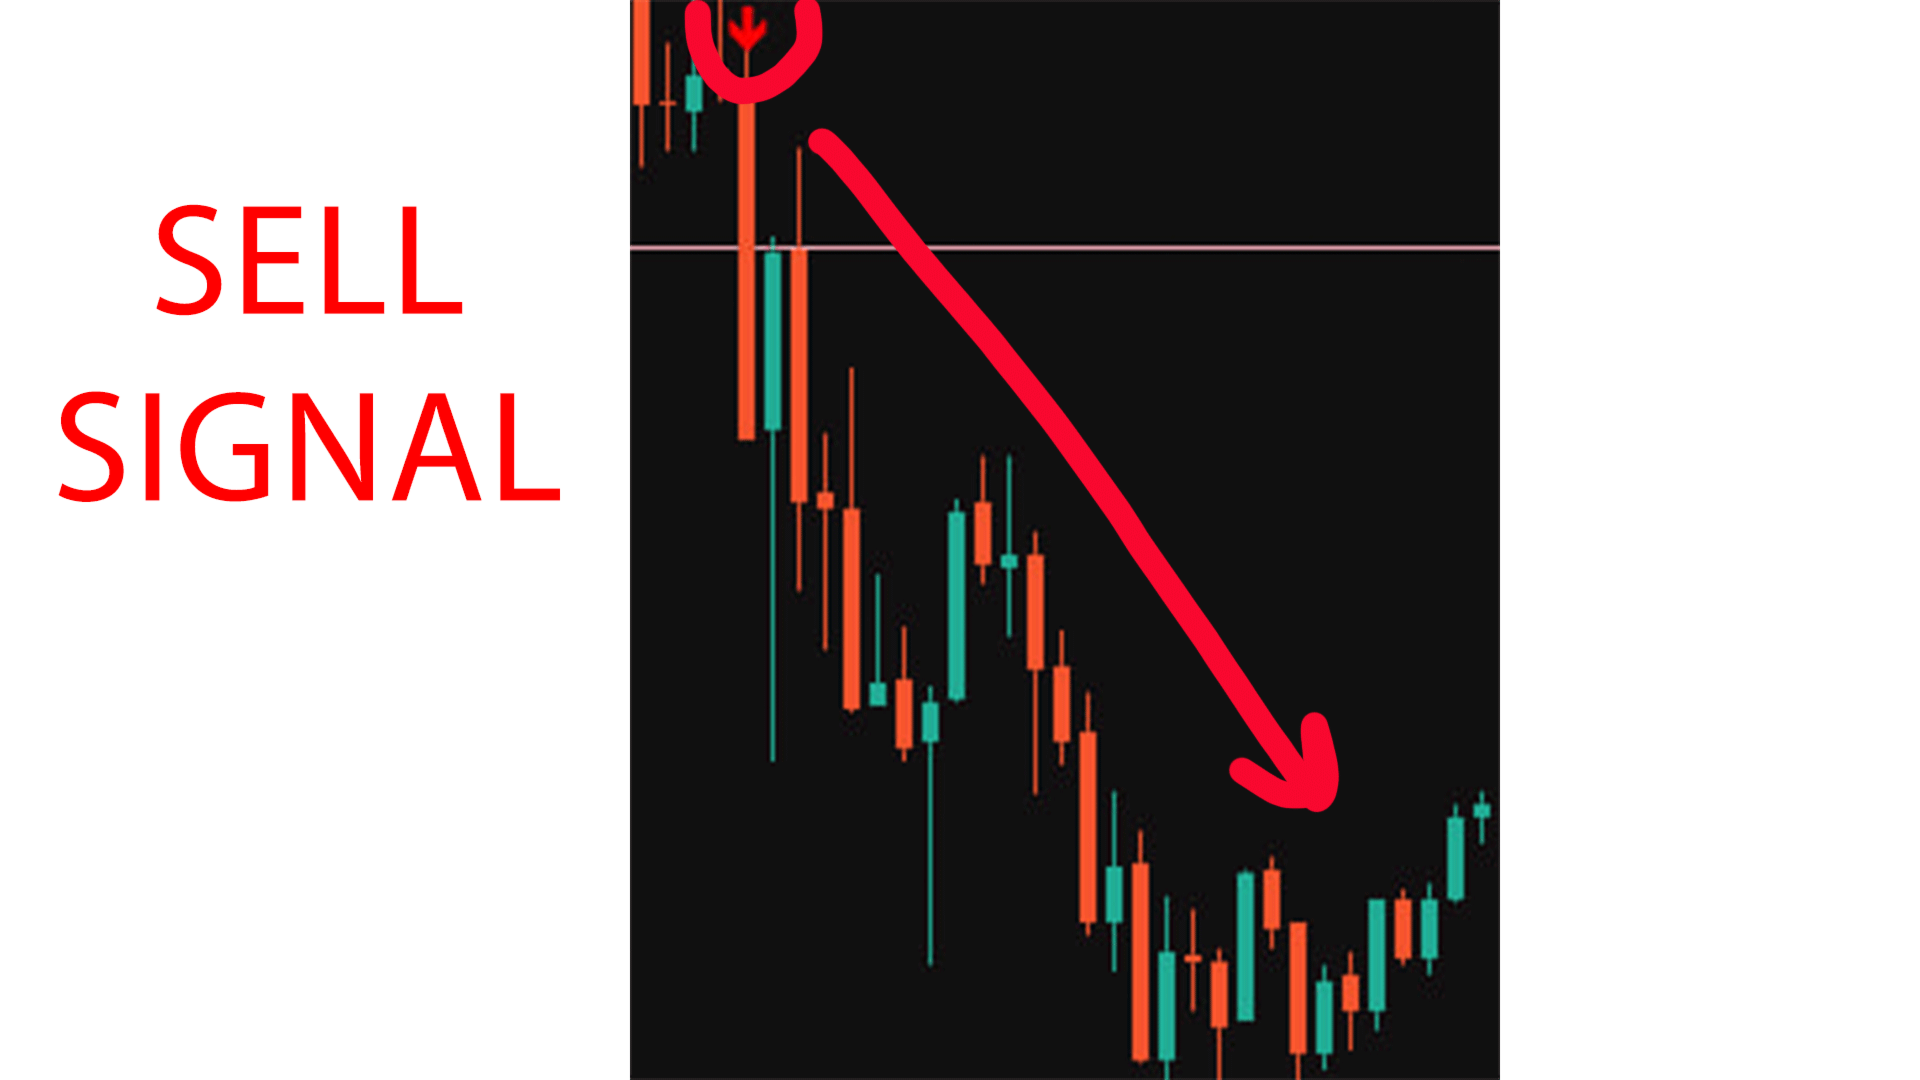
This indicator is designed for scalping on low timeframes (M1-M15) in volatile markets like major forex pairs (e.g., EURUSD, GBPUSD). It generates non-repainting buy (green up arrow) and sell (red down arrow) signals based on EMA crossover confirmed by RSI momentum and MACD crossovers, minimizing false signals in ranging markets.

How to Use:

  1. Attach the indicator to your MT4 chart.
  2. Look for arrows on the chart: Buy on green up arrow, Sell on red down arrow. Signals appear at the open of the new candle after confirmation.
  3. TP/SL Interpretation: Green dashed line = Take Profit (above entry for buys, below for sells). Red dashed line = Stop Loss (below entry for buys, above for sells). These are calculated dynamically using ATR for volatility adaptation or fixed pips. Aim for quick exits at TP or manual close if market reverses. Lines auto-update/remove on new signals.
  4. Customize via inputs: Adjust EMA/RSI/MACD periods for sensitivity, TP/SL multipliers for risk (e.g., 1:2 ratio), or switch to fixed pips for consistency. Enable alerts for real-time notifications.
  5. For EAs: Use buffers (Index 0 for Buy, 1 for Sell) where non-empty values indicate signals.

Recommendations for Settings and Trading Strategies:

  • Default Settings: Work well for M5 EURUSD. Use EMA 5/13, RSI 14 (30/70), MACD 12/26/9, ATR 14 with multipliers 1.0 SL / 2.0 TP for low-risk 1:2 RR.
  • Optimization Tips: On M1, reduce EMA periods (e.g., 3/8) for faster signals but increase Signal_Sensitivity to 1.2 to filter noise. On M15, increase to 8/21 for smoother trends. Test on demo with volatile sessions (London/New York overlap).
  • Sample Scalping Strategy: Enter on arrow, set SL/TP per lines. Exit at TP or if opposite signal appears. Avoid news events; combine with support/resistance. Risk 0.5-1% per trade. Target 5-15 pips profit per trade in high-volatility pairs. Backtest on history to fine-tune; aim for win rate >60% with tight stops to maximize high-profit potential.
  • Performance Notes: Code is efficient for real-time scalping, recalculating only on new bars. Tested for no repainting and quick execution on MT4. For best results, use on brokers with low spreads/ECN accounts.


추천 제품
BinaryScalping
Andrey Spiridonov
BinaryScalping is a professional indicator for trading binary options and scalping. The algorithm of the indicator is based on the calculation of pivot points for each time period separately, the location of the price of the trading instrument relative to the pivot points is analyzed and the probability of a trading operation is calculated. The indicator has a built-in filter of trading signals based on the global trend. The indicator is installed in the usual way and works with any trading inst
User Manual Download link: https://ontrd.com/our-books/ For all who are asking about indicator  ON Trade Numerology Station It obtain about 16 numerology strategies it make together completed unit control your trading . Basic strategies to work with it are 3 strategies statistics about them are the following : 1. RBA levels success rate more then 95%. 2. FF more then 96%  3.RBA SUN 98% We will not say 100 % as they are .. Ratio rates as following :  1.Rba levels more then 1/3 to 1/6 . 2.FF MORE
It will be the best tool for you to make a profit! Through unique algorithms You're going to see an amazing amount of right trading signals Make huge profits every day and realize more possibilities!   Like the car no money to buy it, the love of the girls dare not to pursue?Or the credit card bill is not paid, the rent does not have the extra money to settle?Or are you fed up with being bossed around by your boss and Hope to get more people's respect?Can't afford to buy the things you want ? wa
This is an arrow indicator without a future function,developed based on the most advanced profit trading algorithms.It has the most innovative and advanced dual trend analysis module, as well as the latest and highly effective market trend prediction algorithm.Trends are your friends, and following larger trends can earn the maximum profit in foreign exchange. This indicator helps traders identify current trends and track them. Someone once made a profit of 10 times in a week by relying on it.No
Trade Pinbar
Miracle Obinna Okafor
This indicator identifies pinbar candlesticks on the chart and displays an arrow as a trade signal based on the candlestick pattern. It offers user-friendly features, including push notifications and other types of alerts. It is most effective for identifying entry points or potential reversals at premium or discount prices. Additionally, it works on any time frame.
FREE
BinaryUniversal
Andrey Spiridonov
BinaryUniversal is a signal indicator for binary options and Forex. In its work, the indicator uses a complex algorithm for generating signals. Before forming a signal, the indicator analyzes volatility, candlestick patterns, important support and resistance levels. The indicator has the ability to adjust the accuracy of the signals, which makes it possible to apply this indicator for both aggressive and conservative trading. The indicator is set in the usual way, it works on any time period and
Gann Time Reversal Signals   are sophisticated trading concepts developed by Naveen Saroha using  W.D. Gann concepts that focus on predicting market turning points through the confluence of time cycles and price movements. Here are the key elements: Time-Balance : Gann famously stated, "When time is up, the market will reverse regardless of the price. This emphasizes that time cycles often take precedence over price levels in determining market reversals. Key Reversal Signals Price-Time Confluen
Towers
Yvan Musatov
Towers - Trend indicator, shows signals, can be used with optimal risk ratio. It uses reliable algorithms in its calculations. Shows favorable moments for entering the market with arrows, that is, using the indicator is quite simple. It combines several filters to display market entry arrows on the chart. Given this circumstance, a speculator can study the history of the instrument's signals and evaluate its effectiveness. As you can see, trading with such an indicator is easy. I waited for an a
Smooth price for Monarch MT4
Konstantin Gruzdev
3.67 (3)
The Smooth Price technical indicator is used for plotting a smoothed line as close to the price of the financial instrument as possible, and serves to eliminate its noise components. The indicator is part of the Monarch trading system, but here it is presented as an independent technical analysis tool. The indicator is based on the cluster digital filter , which, unlike the ClusterSMA , is applied directly to the price time series. Smooth Price does not redraw (except the very last, zero bar) an
Target Striking
Dmitriy Kashevich
Target Striking - One of the best binary options trading tools! It is set up so powerfully that you can trade not only on currency pairs, but also on raw gold oil! You can also try on cryptocurrency! Ideal for trading on currency pairs, the percentage of reliable transactions is more than + 75% The trading tool is already set for the best profit! Only Target Striking can unlock the potential of the trading market for you! With it, the signals are even and accurate without redrawing, a sig
This indicator works on MT4 and is very easy to use. When you receive a signal from it, you wait for that candle with the signal to close and you enter your trade at the beginning of the next new candle . A red arrow means sell and a green arrow means buy. All arrows comes with Alert  like for easy identification of trade signal. Are you okay with that? 1 minute candle 1 minute expire
Limitless MT4
Dmitriy Kashevich
Limitless MT4 is a universal indicator suitable for every beginner and experienced trader. works on all currency pairs, cryptocurrencies, raw stocks Limitless MT4 - already configured and does not require additional configuration And now the main thing Why Limitless MT4? 1 complete lack of redrawing 2 two years of testing by the best specialists in trading 3 the accuracy of correct signals exceeds 80% 4 performed well in trading during news releases Trading rules 1 buy signal - the ap
Powerful Binary Options
Ellan Dirgantara Tholkhah
This is the binary options signal you all have been looking for. This in a modified version of the Garuda Scalper, that has been modified for Binary Options traders. Signals are very unique! Why this is so effective for binary options is because  it is a trend following system, it understands that the trend is your friend. It takes advantage of the buying/selling after the pullback in continuation of the current trend wave.  Because  signals are generated after the pullback,   you can place shor
Alpha Trend sign has been a very popular trading tool in our company for a long time. It can verify our trading system and clearly indicate trading signals, and the signals will not drift. Main functions: Based on the market display of active areas, indicators can be used to intuitively determine whether the current market trend belongs to a trend market or a volatile market. And enter the market according to the indicator arrows, with green arrows indicating buy and red arrows indicating se
Signal From Level
Yaroslav Varankin
Binary Options Support Resistance Indicator This indicator is designed for binary options trading and effectively shows retracements from support and resistance levels. Signals appear on the current candle. A red arrow pointing downwards indicates a potential selling opportunity, while a blue arrow pointing upwards suggests buying opportunities. All that needs adjustment is the color of the signal arrows. It is recommended to use it on the M1-M5 timeframes as signals are frequent on these timef
FFx Pivot SR Suite PRO
Eric Venturi-Bloxs
MetaTrader 5 version available here: https://www.mql5.com/en/market/product/25794 FFx Pivot SR Suite PRO is a complete suite for support and resistance levels. Support and Resistance are the most used levels in all kinds of trading. Can be used to find reversal trend, to set targets and stop, etc. The indicator is fully flexible directly from the chart 4 periods to choose for the calculation: 4Hours, Daily, Weekly and Monthly 4 formulas to choose for the calculation: Classic, Camarilla, Fibonac
Next level of trend trading here. Possibility 75%, the indicator analyzes the current market to determine short (small dot), middle (circle with a dot inside) and long (cross with a circle and a dot inside) trends.  Wingdings characters of  Aqua color represents the beginning of the UP trend. Wingdings characters of  Orange color represents the beginning of the DOWN trend. Possibility 75% Indicator will improve your trading in the world of forex, commodities, cryptocurrencies and indices.
NostradamusMT4
Andrey Spiridonov
1 (1)
NostradamusMT4 is a powerful indicator from the set of professional trader. The indicator is based on Andrei Spiridonov's original price calculation method (ESTIMATED PRICE) for the current candle price. Advantages The indicator does not redraw. It works on any timeframes. Works with any trading instruments. Perfectly suitable for scalping and trading binary options. Parameters Color - color of the ESTIMATED PRICE FUTURE line. How to work with the indicator The indicator forms the ESTIMATED P
SYSTEM INTRODUCTION:   The Binary Options Momentum System Is Specifically Designed For Binary Options Trading. Unlike Other Systems And Indicators That Were Adopted From Other Trading Environments For Binary Options. Little Wonder Why Many Of Such Systems Fail To Make Money . Many End Up Loosing Money For Their Users.  A Very Important Fact That Must Be Noted Is The Fact That Application Of Martingale Is not Required. Thus Making It Safer For Traders Usage And Profitability. A Trader Can Use Fi
Crosskalp1
Mikhail Bilan
Добрый День уважаемые трейдеры!  Вашему вниманию индикатор созданный и работающий на базе трендовика ADX,  для торговли на смене направления движения который учитывает коррекцию и даёт возможность на ней заработать.  Применяю этот индикатор для скальпинга. Рекомендую таймфреймы от 15 ти минутного(М15) до часового (Н1) периодов.  Красный кружок сигнал на продажу- Sell) Зелёный кружок  сигнал на покупку Buy) Чем меньше ваш таймфрейм тем меньше пунктов вы зарабатываете.   Важно выставлять стопы! !В
Новая версия индикатора консолидаций Consolidation box Generator. Предыдущая версия тут . Примеры настроек на индикатор тут . На данный момент этот инструмент анализа рынка уже нельзя назвать просто индикатором. Потому как это торговая стратегия. Наше ноу-хау заключается в том, что данный индикатор не требует огромного количества тестов в тестере стратегий. В индикаторе реализован блок статистики - при нанесении на график вам сразу будет видна результативность работы стратегии. Вы можете настро
Owl smart levels
Sergey Ermolov
4.24 (37)
MT5 버전  |   FAQ Owl Smart Levels Indicator 는   Bill Williams 의 고급 프랙탈, 시장의 올바른 파동 구조를 구축하는 Valable ZigZag, 정확한 진입 수준을 표시하는 피보나치 수준과 같은 인기 있는 시장 분석 도구를 포함하는 하나의 지표 내에서 완전한 거래 시스템입니다. 시장과 이익을 취하는 장소로. 전략에 대한 자세한 설명 표시기 작업에 대한 지침 고문-거래 올빼미 도우미의 조수 개인 사용자 채팅 ->구입 후 나에게 쓰기,나는 개인 채팅에 당신을 추가하고 거기에 모든 보너스를 다운로드 할 수 있습니다 힘은 단순함에 있습니다! Owl Smart Levels   거래 시스템은 사용하기 매우 쉽기 때문에 전문가와 이제 막 시장을 연구하고 스스로 거래 전략을 선택하기 시작한 사람들 모두에게 적합합니다. 전략 및 지표에는 눈에 보이지 않는 비밀 공식 및 계산 방법이 없으며 모든 전략 지표는 공개되어 있습니다. Owl Smart Leve
The Serpent Rider Binary Options
Ellan Dirgantara Tholkhah
Embark on the pinnacle of Binary Options evolution. Our indicator isn't just adaptive—it's relentless. Picture a ninja riding a serpent, shadowing its every move; that's how this tool trails the market trend, unwavering till the end. Built upon the foundational prowess of the Ichimoku indicator and honed with an array of fine-tuned oscillators, it epitomizes accuracy and precision. Dive deep without getting lost in the Ichimoku's intricacies—our indicator simplifies the process for you. Perhaps
Perfect for one minutes high trading and scalping. This indicator is very effective for trading on one minutes, in the hour. A combination of moving averages and STOCHASTICS calculation to produce a very convincing signal every hour. Blue colour signals a buy opportunity. Follow the X signs for possible buy points. The Blue average line serves as possible trend direction and support. Red colour signals a sell opportunity. Follow the X signs for possible sell points. The Red average line serves a
MT4 "독수리 눈 지표"로 바이너리 옵션 거래의 가능성을 극대화하세요 메타트레이더 4(MT4)용 "독수리 눈 지표"를 활용하여 바이너리 옵션 거래의 혁명적인 세계에 도약해 보세요. 이 혁신적인 도구는 수술적인 정확성과 비교할 수 없는 수익성을 제공하여 거래 경험을 변화시킬 준비가 되어 있습니다. 잠재력의 경계가 깨지고 수익이 극대화되는 세계로 뛰어들어 보세요. 독수리 눈 지표의 뛰어난 정확성과 흔들림 없는 신뢰성 덕분에 시장의 숨겨진 비밀을 해결할 수 있습니다. 세심한 세부 사항에 주의를 기울여 개발된 이 최첨단 지표는 고급 알고리즘, 철저한 기술적 분석, 실시간 시장 데이터를 결합하여 탁월한 거래 이점을 제공합니다. 독수리 눈 지표는 시장의 포인트를 정확하게 파악하여 통찰력 있는 신속한 결정을 돕습니다. 직관적인 인터페이스와 사용하기 쉬운 디자인을 통해 초보 트레이더도 쉽게 바이너리 옵션의 복잡성을 탐색하고 이 도구의 엄청난 힘을 최대한 활용할 수 있습니다. 추측과 감정에 기반한
Trendiness Index
Libertas LLC
5 (3)
"The trend is your friend" is one of the best known sayings in investing, because capturing large trendy price movements can be extremely profitable. However, trading with the trend is often easier said than done, because many indicators are based on price reversals not trends. These aren't very effective at identifying trendy periods, or predicting whether trends will continue. We developed the Trendiness Index to help address this problem by indicating the strength and direction of price trend
A Boss Stats
Anthonius Soruh
Hi Trader, We are strategy development for Binary and Forex tools, our product have success for binary trading 1 min - 2 min experation. At the moment I build indicator for trading all day, not like Bonosu series with specific time. We launch A-Boss Stats Indicator for trading 1 minute to 5 minutes experation is mean can trade from 1 minutes - 5 minutes. Specification of A Boss Stats trading binary option: Work with all MT4 broker. Chart Time Frame M1 only, can use M5 Experation time for contact
Jeslyn
Justine Kelechi Ekweh
이것은 스캘퍼 시스템 또는 매우 강력한 모멘텀, 바이너리 옵션 거래자 또는 자동화 거래에 서 범용 EA가 사용하는 전략으로 Forex 수동 거래자 모두에게 적합한 다목적 시스템입니다. Jeslyn은 수년간의 연구를 기반으로 한 전략이며 특정 가격 행동 전략에 중점을 둡니다. 단순한 화살표 표시처럼 보이지만 정교하고 논리적인 알고리즘을 가지고 있습니다. 지표에서 계산을 하지 않고 가격 행동에 대한 계산만 합니다. 나는 추세, 모멘텀과의 차이, 다이버전스와 볼륨 스프레드 분석 사이의 관계를 해석하는 방 법을 찾았습니다. 모멘텀으로 포지션이 채워지는 미니 공급 및 수요 영역이 있습니다. 이것이 우리가 그들이 시작할 때 있기를 원하는 곳입니다. 또한 그들은 Metatrader에서 실제 볼륨을 얻을 수 없다고 말합니다. 음, 가격 모멘텀으로 볼륨을 얻고 조작하는 방법을 찾았습니다. Jeslyn은 수년간의 연구를 기반으로 한 전략이며 특정 가격 행동 전략에 중점을 둡니다. 단순한 화살표
BinaryIndicator
Andrey Spiridonov
BinaryIndicator is a highly accurate indicator for trading binary options. It shows excellent results in scalping. This indicator is based in multifactor analysis of trend indicators, as well as confirmation oscillators, which in the end gives an increased accuracy of signals. Advantages of the indicator Increased accuracy of signals. Excellent results when trading binary options with a short expiration time from M30 to M1 . It works on any timeframes. Works with any trade symbols. Parameters
REX complete 3in1
Christophe Godart
This is the complete REX package. It consists of the lite, pro and ULTRA version.  Perfect for beginners and intermediates. REX complete is 100% non repaint. The strategy is based on a mix of different strategies, statistics, including pivot points, oscillators and patterns.  As the trading idea consists of a variety of some classic indicators like Momentum, Williams Percent Range, CCI, Force Index, WPR, DeMarker, CCI, RSI and Stochastic, it is clear that the fundamental indicators have being u
이 제품의 구매자들이 또한 구매함
#EasyWayTradePanel indicator for #MetaTrader4 , is trade assistants for manual trading in any #currency in #FOREX , #CRYPTOCURRENCY as #Bitcoin , #Ethereum , #Lightcoin and more. Also is EasyWay to use for #COMMODITY as #Gold , #Silver , #Oil , #Gas ...... and #CFDs . When installed on the chart in your chosen time frame and trading tool, the indicator automatically draws the following custom indicators used in the EasyWayTradePanel trading strategy. 1) Zigzag_Extreme_Indicator, 2) Regression_C
Binary Smart Eye
Ramzi Abuwarda
"Binary Smart Eye" MT4 지표는 바이너리 옵션 및 외환 시장 모두에 거래 신호를 제공하도록 설계되었으며, M1에서 W1까지 광범위한 시간 프레임에서 작동합니다. 추세 수준, 지능형 이동 평균 및 최적화된 거래 기간을 결합한 독점적인 전략을 사용하여 잠재적인 진입점을 식별합니다. 주요 기능에 대한 분석은 다음과 같습니다. 다중 시간 프레임 분석: 지표의 다용도성은 트레이더가 다양한 시간 프레임에서 이를 활용하여 M1의 스캘핑부터 W1의 장기 추세 추종까지 다양한 거래 스타일에 맞출 수 있도록 합니다. 독점 전략: "Binary Smart Eye"의 핵심은 다음을 활용하는 고유한 전략에 있습니다. 추세 수준: 이러한 수준은 주요 시장 추세 및 잠재적인 반전 지점을 식별하는 데 도움이 됩니다. 지능형 이동 평균: 시장 변동성에 적응하고 정확한 추세 방향을 제공하는 사용자 정의 이동 평균입니다. 스마트 거래 기간: 지표는 최적의 시장 조건을 포착하기 위해 특정 시간 기간을
Enigmera
Ivan Stefanov
5 (8)
ENIGMERA: 시장의 핵심 중요: MQL5.com의 데모는 Strategy Tester에서 실행되며 Enigmera의 기능을 완전히 반영하지 못할 수 있습니다. 설명, 스크린샷 및 비디오를 확인하여 자세한 내용을 확인하십시오. 질문이 있으면 언제든지 메시지를 보내주세요! 인디케이터의 코드는 완전히 다시 작성되었습니다. 버전 3.0은 새로운 기능을 추가하고 인디케이터가 처음 출시된 이후 누적된 버그를 수정했습니다. 소개 이 인디케이터 및 거래 시스템은 금융 시장에 대한 주목할 만한 접근 방식입니다. ENIGMERA는 프랙탈 주기를 사용하여 정확하게 지원 및 저항 수준을 계산합니다. 실제 축적 단계를 보여주고 방향과 목표를 제공합니다. 트렌드와 수정 모두에서 작동하는 시스템입니다. 작동 방식 인디케이터의 대부분의 기능은 차트 왼쪽에 있는 버튼을 통해 제어되며, 이를 통해 다양한 시장 상황에 빠르게 대응할 수 있습니다. 버튼 ON/OFF – 인디케이터 전체를 표시하거나 숨깁니다.
This is a mini One pair version of Advanced Detector of Trend Reversal and Continuance known as TrueTrendStarM(TTSm25). It is a sensitive and Predictive indicator of Price Trends for Professional traders.  ( ATTENTION BUYERS:-Now the indicator is available for UNLIMITED TIME ONE TIME buy of just $500 ). Avail the Opportunity.    It detects high odds changes in Price Trend direction long before other indicator detects it. I have been working on it since 2019.    This is possible due to fractal
Hit Rate Top Bottom Signal
Martin Alejandro Bamonte
히트율 탑 바텀 신호 히트율 탑 바텀 신호 히트율 탑 바텀 신호 는 완전히 혁신적인 접근 방식을 제공합니다. 특정 TP-SL과 PAIR/TF에서 어떤 성과를 내는지 미리 평가하고자 하는 분들께 이상적입니다. 전략 히트율 탑 바텀 신호 는 모든 트레이더와 모든 거래 유형 에게 필수적인 도구입니다. 이 전략은 정확한 리페인트 없는 신호 를 제공하여 언제 어떤 방향으로 거래해야 할지를 명확하게 제시할 뿐만 아니라 각 페어와 TF에 대한 상세한 성공률 기록 을 제공합니다. 사전 정의된 테이크 프로핏(TP)과 스톱 로스(SL)을 통해 신호의 효율성을 미리 알 수 있습니다 , 이는 효과적인 리스크 관리와 정확한 거래에 매우 중요합니다. 이 전략의 특징은 전체 움직임이 아닌 임펄스 내의 반전 지점을 감지하는 데 중점을 두고 있어 전통적인 탑-바텀보다 신호 발생 빈도가 높고, 시장의 주요 변동에서 핵심 순간을 포착하는 데 집중합니다. 이 전략은 SL/TP 비율과 결합된 신호의 과거 성과를
Dual Momentum
Adolfina Denysenko
Dual Momentum is a modern arrow indicator for MetaTrader 4, created specifically for the accurate detection of market reversals and strong impulse movements. The indicator is based on a combination of two powerful oscillators – Williams %R and RSI, which allows you to filter noise and generate more reliable signals. Thanks to this, Dual Momentum indicates only key entry points when the probability of a successful trade is highest. Key advantages: No redrawing – signals remain on the cha
Predictive Levels
Satya Prakash Mishra
Market predictive price levels are key technical analysis tools is my finest invention through mathematics to predict automatically next price is where to reach after break any levels. A unique name quality it automatically calculate price range its my own invention according price value to predict what's is next price came than after it not fixed levels like Fibonacci or pivots Its Naveen's Predictive Levels .used to forecast where an asset's price might find support (stop falling) or resistanc
Support and Resistance Levels is an intelligent indicator that displays horizontal support and resistance levels, suitable for traders of different trading frequencies. You can select your preferred trading frequency, and the indicator will automatically calculate the support and resistance levels relevant to that frequency. Among these, the Bull-Bear Line is an interval used to distinguish the strength of bullish and bearish forces, and is an important level. You can combine it with other ind
WanaScalper MT4
Isaac Wanasolo
1 (1)
A scalping indicator based on mathematical patterns, which on average gives signals with relatively small SL, and also occasionally helps to catch big moves in the markets (more information in the video) This indicator has three main types of notifications: The first type warns of a possible/upcoming signal on the next bar The second type indicates the presence of a ready signal to enter the market/open a position The third type is for SL and TP levels - you will be notified every time price re
FFx Engulfing Setup Alerter gives trade suggestions with Entry, Target 1, Target 2 and StopLoss. Below are the different options available: Entry suggestion - pips to be added over the break for the entry 3 different options to calculate the SL - by pips, by ATR multiplier or at the pattern High/Low 3 different options to calculate the 2 TPs - by pips, by ATR multiplier or at Risk/Reward Offset the dashboard - any place on the chart Remove the suggestion once the price reached the SL line Lines
FFx InsideBar Setup Alerter gives trade suggestions with Entry, Target 1, Target 2 and StopLoss. Below are the different options available: Entry suggestion - pips to be added over the break for the entry Minimum candle size - to avoid too close buy/sell entry suggestions 3 different options to calculate the SL - by pips, by ATR multiplier or at the pattern High/Low 3 different options to calculate the 2 TPs - by pips, by ATR multiplier or at Risk/Reward Offset the dashboard - any place on the c
FFx OutsideBar Setup Alerter gives trade suggestions with Entry, Target 1, Target 2 and StopLoss. Below are the different options available: Entry suggestion - pips to be added over the break for the entry. 3 different options to calculate the SL - by pips, by ATR multiplier or at the pattern High/Low. 3 different options to calculate the 2 TPs - by pips, by ATR multiplier or at Risk/Reward. Offset the dashboard - any place on the chart. Remove the suggestion once the price reached the SL line.
FFx PinBar Setup Alerter gives trade suggestions with Entry, Target 1, Target 2 and StopLoss. Below are the different options available: Entry suggestion - pips to be added over the break for the entry Minimum candle size - to avoid too small candles 3 different options to calculate the SL - by pips, by ATR multiplier or at the pattern High/Low 3 different options to calculate the 2 TPs - by pips, by ATR multiplier or at Risk/Reward Offset the dashboard - any place on the chart Remove the sugges
Lineverse Trendlines
Arkady Segal
5 (1)
Automatic, live & interactive picture of all trendlines. Assign push, email and sound alerts to the lines of your choice and be informed about price rollback, breakout, rollback after breakout, number of rollbacks, line expiration by double breakout. Correct, drag or delete the lines and interactively tune the line system. https://youtu.be/EJUo9pYiHFA . Chart examples https: //www.mql5.com/en/users/efficientforex Price Interaction Events All events are effective immediately and only after one
FFx MACD Divergences
Eric Venturi-Bloxs
The purpose of this new version of the MT4 standard indicator provided in your platform is to display in a sub-window multiple timeframes of the same indicator with its divergences. See the example shown in the picture below. But the display isn't like a simple MTF indicator. This is the real display of the indicator on its timeframe. Here's the options available in the FFx divergences indicator: Select the timeframes to be displayed (M1 to Monthly) Define the width (number of bars) for each tim
FFx RSI Divergences
Eric Venturi-Bloxs
The purpose of this new version of the MT4 standard indicator provided in your platform is to display in a sub-window multiple timeframes of the same indicator with its divergences. See the example shown in the picture below. But the display isn't like a simple MTF indicator. This is the real display of the indicator on its timeframe. Here's the options available in the FFx divergences indicator: Select the timeframes to be displayed (M1 to Monthly) Define the width (number of bars) for each tim
FFx CCI Divergences
Eric Venturi-Bloxs
The purpose of this new version of the MT4 standard indicator provided in your platform is to display in a sub-window multiple timeframes of the same indicator with its divergences. See the example shown in the picture below. But the display isn't like a simple MTF indicator. This is the real display of the indicator on its timeframe. Here's the options available in the FFx divergences indicator: Select the timeframes to be displayed (M1 to Monthly). Define the width (number of bars) for each ti
The FFx Dashboard MTF alerter will show you on a single chart all the timeframes (M1 to Monthly) with their own status for the indicator. 2 Alert Options: Single timeframe: each selected timeframe alert separately when a signal occurs Multi timeframes: all selected timeframes must agree for an alert to be triggered Both options have an input to select the timeframes to be used for the alert(s). How to Understand the Status: Green/Red square: histogram above/below 0 line Green square + Red bord
The FFx Dashboard MTF alerter will show you on a single chart all the timeframes (M1 to Monthly) with their own status for the indicator. 2 Alert Options: Single timeframe: each selected timeframe alert separately when a signal occurs Multi timeframes: all selected timeframes must agree for an alert to be triggered Both options have an input to select the timeframes to be used for the alert(s). How to understand the status: Green/Red square: RSI above/below 50 line Green square + Red border: R
The FFx Dashboard MTF alerter will show you on a single chart all the timeframes (M1 to Monthly) with their own status for the indicator. 2 Alert Options: Single timeframe: each selected timeframe alert separately when a signal occurs Multi timeframes: all selected timeframes must agree for an alert to be triggered Both options have an input to select the timeframes to be used for the alert(s). How to understand the status: Green/Red square: Stoch above/below 50 line Green square + Red border:
The FFx Dashboard MTF alerter will show you on a single chart all the timeframes (M1 to Monthly) with their own status for the indicator. 2 Alert Options: Single timeframe: each selected timeframe alert separately when a signal occurs Multi timeframes: all selected timeframes must agree for an alert to be triggered Both options have an input to select the timeframes to be used for the alert(s). How to understand the status: Green/Red square: Price above/below Cloud (Kumo) Green square + Red bo
The FFx Dashboard MTF alerter will show you on a single chart all the timeframes (M1 to Monthly) with their own status for the indicator. 2 Alert Options: Single timeframe: each selected timeframe alert separately when a signal occurs Multi timeframes: all selected timeframes must agree for an alert to be triggered Both options have an input to select the timeframes to be used for the alert(s). How to understand the status: Green/Red square: MA pointing Up/Down Green square + Red border: MA po
The FFx Dashboard MTF alerter will show you on a single chart all the timeframes (M1 to Monthly) with their own status for the indicator. 2 Alert Options: Single timeframe: each selected timeframe alert separately when a signal occurs. Multi timeframes: all selected timeframes must agree for an alert to be triggered. Both options have an input to select the timeframes to be used for the alert(s). How to understand the status: Green square: Price above PSAR Red square: Price below PSAR Options
The FFx Dashboard MTF alerter will show you on a single chart all the timeframes (M1 to Monthly) with their own status for the indicator. 2 Alert Options: Single timeframe: each selected timeframe alert separately when a signal occurs Multi timeframes: all selected timeframes must agree for an alert to be triggered Both options have an input to select the timeframes to be used for the alert(s). How to understand the status: Green/Red square: CCI above/below levels (ie. 100/-100) Grey square: C
The FFx Dashboard MTF alerter will show you on a single chart all the timeframes (M1 to Monthly) with their own status for the indicator. 2 Alert Options: Single timeframe: each selected timeframe alert separately when a signal occurs Multi timeframes: all selected timeframes must agree for an alert to be triggered Both options have an input to select the timeframes to be used for the alert(s). How to understand the status: Green/Red square: ADX above level Grey square: ADX below level Red bor
The FFx Dashboard MTF alerter will show you on a single chart all the timeframes (M1 to Monthly) with their own status. 2 Alert Options: Single timeframe: each selected timeframe alert separately when a signal occurs Multi timeframes: all selected timeframes must agree for an alert to be triggered Both options have an input to select the timeframes to be used for the alert(s). How to understand the status: Green/Red square: bullish/bearish candle Options available in the FFx Dashboard Alerter
The indicator of a Professional Trader is an arrow indicator for predicting the direction of price movement. I have been working on this indicator since 2014. You can use this indicator as your main indicator, use its entry signals, and use it as your only indicator to find entry points. About the product: Recommended TF [H4-D1-W1]   . The indicator predicts the direction of the next candle. Fits a variety of tools; Flexibility in settings for different instruments and intervals through the MO
THE GRAFF III
Antonin Skaryd
The [GRAFF] III manual trading system is based on multiple MetaTrader (MT4) indicators. Together, the entire PACK of GRAFF III indicators makes an advanced trading tool. The system consists of over 20 different custom-built indicators which have been carefully selected and tested in the long term to produce strong and efficient trading signals. The particular indicators are based on different mathematical formulas, so the entire system is calibrated to remove false signals from its own indicator
제작자의 제품 더 보기
What is the Overlay Chart Indicator? The Overlay Chart indicator is exactly as its name suggests. It is a custom technical indicator which overlays another price chart over the current price chart window. It allows traders to overlay another currency pair over one pair which allows them to compare price movements and the characteristics of price action. It then plots a grid to indicate the price of the overlaid currency pair for better reference. It also plots the open, high, low, and close pric
Obie 1M Scalper Metatrader 4 Forex Robot은 13개의 이동 평균을 활용하는 자동화된 외환 거래 소프트웨어입니다. 기본적으로 매수/매도 거래 신호에 대한 시장을 스캔하는 논리를 공식화할 때 여러 이동 평균을 사용하면 이러한 경고가 점점 더 정확해집니다. 이름에서 알 수 있듯이 GBP/USD, EUR/USD, USD/CHF, USD/CAD 등과 같은 주요 외환 쌍과 상장 주식에서 1분 단위로 가장 잘 작동하는 스캘핑 알고리즘입니다. 나스닥에서. 이 자동 거래 시스템 거래와 관련된 위험은 스프레드입니다. 따라서 1분 Scalper 전문 고문은 EUR/USD, USD/JPY 및 GBP/USD와 같이 상대적으로 스프레드가 적은 외환 쌍에만 배치해야 합니다. 전략 테스터 보고서 1분 차트에서 GBP/USD 외환 쌍에 대한 1분 Scalper 외환 로봇 전략 테스터 보고서를 아래에서 찾으십시오. 전반적인 성능 EA는 총 13번의 거래에서 총 $605.4
Cycle Identifier PRO
Obaida Kusibi
4 (4)
MT4용 주기 식별자 표시기는 거래자가 매수 및 매도 포지션을 열 수 있는 조건이 언제인지 식별할 수 있도록 필터링된 가격 조치 신호를 생성합니다. Cycle Identifier MT4 지표는 단기 및 장기 거래자 모두에게 적합한 맞춤형 지표입니다. 사이클 식별자 MT4는 거래자가 매수 및 매도 포지션을 열 수 있는 조건이 언제인지 식별할 수 있도록 필터링된 가격 조치 신호를 생성합니다. 작동 방식 주기 식별자 MT4 표시기는 진동하는 회색 선을 그리는 기본 차트 아래에 별도의 표시기 차트에 표시됩니다. 이 회색 선은 시장 추세와 추세 모멘텀을 보여주기 위해 각각 녹색과 빨간색 막대가 동반되는 상승 및 하락 스파이크가 특징입니다. 백그라운드에서 지표는 SMA(Smooth Moving Averages), RSI(Relative Strength Index) 및 가격 조치 필터 지표의 조합을 사용합니다. 이를 통해 지표는 시장 추세를 식별하고 강도(모멘텀)를 분석하며 잘못된 신호도
Metatrader 4의 Three MA Buy and Sell Signals PRO 지표는 추세가 반대 방향으로 바뀔 때마다 매수 및 매도 신호를 제공하는 3 MA의 거래 시스템입니다. 이 시스템 지표는 3개의 서로 다른 기간을 사용하는 3개의 이동 평균으로 구성됩니다. 지표는 실제 거래 매수 및 매도 신호를 화살표 형태로 제공합니다. MT4 거래 플랫폼에 지표를 다운로드하고 설치하면 아래와 같은 이미지처럼 보일 것입니다. 키 포인트 추세 신호 표시기 다시 칠하지 않는 화살표 초보자 친화적 지표 컬렉션에 추가할 가치가 있음 이 지표는 추세 반전 신호 확인 도구로 기존 거래 전략 또는 시스템과 함께 작동할 수 있습니다. 기본 거래 신호 Metatrader 4에 대한 Three MA Buy and Sell Signals PRO 지표의 신호는 해석하기 쉽고 다음과 같이 진행됩니다. 구입 녹색 신호 화살표가 차트에 인쇄되는 즉시 매수 신호가 제공됩니다. 손절매를 지지선 아래에
MT4용 3번째 캔들 Forex Scalper 표시기는 모든 시간 프레임 및 쌍에 대해 잘 작동하는 진정한 스캘핑 표시기입니다. 키 포인트: 파란색 화살표는 구매 거래 기회를 나타냅니다. 빨간색 화살표는 매도 거래 기회를 나타냅니다. 지표는 매우 안정적이고 가벼우며 거래 플랫폼의 속도를 늦추지 않습니다. 그것으로 거래하는 방법? 파란색 스캘퍼 화살표가 차트에 나타날 때마다 매수 포지션을 엽니다. 빨간색 스캘퍼 화살표가 차트에 나타날 때마다 매도 포지션을 엽니다. 차트에서 반대 거래 신호가 발생하면 거래를 종료하십시오. 자신이 좋아하는 거래 방법을 자유롭게 사용하여 세 번째 캔들 외환 ​​스캘퍼 표시기로 거래를 열고 닫으십시오. 표시기 사양 거래 플랫폼: Metatrader 4(MT4)용으로 개발됨 통화 쌍: 모든 통화 쌍에서 작동합니다. 시간 프레임: 모든 시간 프레임에서 작동 입력 매개변수: 화살표 이동, 황소 곰 캔들 필터, 색상 설정 및 스타일 지표 유형:
Obie Scalper
Obaida Kusibi
Metatrader 4용 Obie Scalper 지표는 사용하기 쉬운 Forex 스캘핑 지표로 낮은 시간대에 빠른 수익을 제공합니다. 지표는 다양한 거래 세션 중에 발생할 수 있는 빠른 스캘핑 기회에 대해 차트를 분석합니다. 가장 변동이 심한 거래 세션(런던 및 미국)에서 최상의 결과를 얻었습니다. 당연히 Obie Scalper 표시기는 원하는 시간대와 통화 쌍에서 작동합니다. 그것으로 거래하는 방법(예시)? 밝은 파란색 화살표가 차트에 인쇄되자마자 매수 스캘핑 거래를 엽니다. 자홍색 화살표가 차트에 인쇄되자마자 매도 스캘핑 거래를 시작하십시오. 8-15 핍 이익을 위해 거래를 종료하십시오. 단기 손절매를 활용하여 손실을 최소화하십시오. AFSTAR Forex 지표로 거래를 열고 닫으려면 자신이 좋아하는 거래 방법을 자유롭게 사용하십시오. 표시기 사양 거래 플랫폼: Metatrader 4(MT4)용으로 개발됨 통화 쌍: 모든 통화 쌍에서 작동합니다. 시간 프레임
Pure Management Metatrader 4 Forex Robot은 하루 세션 동안 단 10핍의 이익을 얻도록 설계된 알고리즘 트레이더입니다. EA는 더 나은 결과를 찾기 위해 입찰에서 높은 연속 낙찰 가능성을 우선시하는 알고리즘을 배포하여 기대 보수를 향상시킵니다. 퓨어매니지먼트 전문 어드바이저는 거래 실패 후 로트의 증가와 함께 이력의 통계 데이터를 기반으로 한 자금 관리 기법을 활용합니다. Pure Management 외환 로봇은 몇 번의 연속 승리 직후에도 주문 로트를 늘려 위험을 낮춥니다. 기본 최대 로트 크기 한도인 5.0을 사용하여 이 증가하는 주문 로트를 확인합니다. 전략 테스터 보고서 1분 차트에서 EUR/USD 외환 쌍에 대한 Pure Management 로봇 전략 테스터 보고서를 아래에서 찾으십시오. 전반적인 성능 EA는 총 198건의 거래에서 총 $1640.00의 수익을 올렸습니다. 가장 큰 승리를 거둔 거래는 $50.00의 이익을 창출한
ObieAlerts
Obaida Kusibi
green up = buy red down = sell with alerts! that's how easy it is. --this indicator follows trend --based on moving averages and rsi and macd and pivot points --good for scalping and intraday trading and daytrading --works for swing --recommended time frame is 15m or 5m  contact me after purchase to receive a trading strategy with the indicator with another bonus indicator!
진정한 마진 세이프 실행을 제공하는 차세대 EMA/RSI + ATR 전략 개요 Signals w TP SL은 기존 EMA/RSI 교차 전략과 역동적인 ATR 기반 손절매 및 이익실현 목표가를 결합한 턴키 방식의 MetaTrader 4 전문가 자문 솔루션입니다. 업계 최초의 마진 세이프 랏 사이징 엔진도 탑재되어 있습니다. 모든 종목과 시간대에 맞춰 설계된 이 EA는 계좌 잔액에 맞춰 포지션 규모를 자동으로 조정하고, 과도한 레버리지를 사용하지 않으며, 실제로 감당할 수 있는 거래만 개시합니다. EURUSD, H1 또는 XAUUSD, D1 거래 여부에 관계없이 Signals w TP SL은 다음과 같은 이점을 제공합니다. 새로운 캔들에서 신뢰할 수 있는, 각 봉당 한 번의 신호 원활한 추세 감지를 위한 EMA 교차 필터 과매수/과매도 휩소 현상을 방지하는 RSI 확인 현재 변동성에 적응하는 ATR 기반 SL/TP 자본에 따라 확장되는 위험 비율 기반 랏 크기 조정 진정
Signals with TP SL Indicator — a powerful trading tool that combines EMA crossover , RSI filter , and ATR-based TP/SL levels to help you spot high-probability market entries. This indicator is built to visually support the Signals with TP SL Expert Advisor , but can also be used manually as a standalone confirmation tool for intraday and swing trading. Features: Buy/Sell arrows based on EMA crossover + RSI condition Real-time dynamic SL and TP levels calculated using ATR Plots arrows directly
MT5용 Obie Scalper Alerts 지표는 스캘퍼와 데이 트레이더 모두를 위한 탁월한 매수/매도 신호 도구입니다. 신호는 매우 이해하기 쉽고 기본 차트 창에 파란색과 빨간색 점으로 나타납니다. 구매 및 판매 신호: 파란색 점은 매수 신호입니다. 빨간색 점은 매도 신호입니다. 지표의 다양한 설정과 입력 값을 자유롭게 실험해 보십시오. 이 표시기는 모든 통화 쌍(메이저, 마이너 및 엑조틱)에서 동일하게 잘 작동하며 올바르게 사용하면 유망한 결과를 보여줍니다. 거래 팁: 이 스캘퍼 표시기로 거래할 때 자신이 좋아하는 거래 항목, 손절매 및 이익실현 전략을 자유롭게 사용하십시오. 항상 그렇듯이 전체 추세에 동의하고 이 지표를 완전히 이해할 때까지 먼저 데모 계정에서 연습하십시오. 표시기 사양 및 입력: 거래 플랫폼: Metatrader 5(MT5)용으로 개발됨 거래 상품: Forex, 주식, 상품, 주가 지수, 귀금속, 에너지 및 주식에 대한 작업 시간 프레임: 모
Gann Hi Lo
Obaida Kusibi
Gann High Low Activator Metatrader 5 외환 지표는 Robert Krausz의 1998년 Stocks & Commodities Magazine에서 설명되었습니다. 기술 지표는 이전 N 기간의 저점 또는 고점의 단순 이동 평균(SMA)을 나타냅니다. 최고점과 최저점의 곡선은 Gann High Low Activator 표시기를 사용하여 적절하게 추적됩니다. 그럼에도 불구하고 막대의 닫기는 플롯되는 항목을 결정하는 것입니다. 지표는 이중 색상 선(주황색 빨간색 및 라임 녹색), 회색 점선(채널 중앙에 약간 있음) 및 Gainsboro 그림자로 차트에 나타납니다. Gann High Low Activator 표시기의 이러한 구성 요소는 추세가 변경될 경우 위반해야 하는 일종의 채널을 형성합니다. 스캘핑, 데이 트레이딩 및 스윙 트레이딩 목적으로 이 지표를 사용하십시오. 아래의 GBP/USD H1 차트는 작동 중인 Gann High Low Activat
추세를 따르고 다시 칠하지 않는 외환 거래 게이지. 신호는 완전 자동 방식으로 계산 및 제공되며 이동 평균 교차점을 기반으로 합니다. 이러한 신호는 단순한 매수/매도 화살표의 형태로 표시되므로 초보자에게 친숙한 도구입니다. 그럼에도 불구하고 신호 신뢰성은 정말 견고합니다. 모든 외환 거래 전략과 함께 사용할 수 있습니다. Trend Signals Alerts Indicator는 모든 종류의 기간 및 통화 쌍에 적합합니다. 메인 트레이딩 차트에 바로 표시됩니다. 기본 설정은 입력 탭에서 직접 수정할 수 있습니다. Trend Signals Alerts Indicator 자세히 보기 이 지표의 기본 아이디어는 시장 동향과 무역 신호를 보여주는 간단한 방법을 제공하는 것입니다. 결과적으로 초보자와 고급 거래자 모두 도구를 활용할 수 있습니다. 스크린샷에서 MT5에서 활성화되었을 때 어떻게 보이는지 살펴보십시오. 추세 신호 경고 표시기 해부 보시다시피, 그에 따라 거래하기 위한 매
ObieTrader
Obaida Kusibi
ObieTrader is a short term signals indicator. It is used for intraday trading. ObieTrader identifies the short term trend using Williams percent R indicator and average true range. When a short term trend is confirmed by the indicator, it plots semaphores on the bar to show the trend. Bars with red dots indicate downtrend and bars with blue dots indicate uptrend. When a trend is identified, open positions in the direction of the trend. When red circles appear open short position. When blue cir
신뢰할 수 없는 신호가 차트를 가득 채우고 비용을 낭비하는 데 어려움을 겪고 계신가요? 가장 신뢰할 수 있는 세 가지 기술 도구를 하나의 명확하고 재작업이 필요 없는 신호 생성기로 결합한 강력하고 사용하기 쉬운 지표를 원하시나요? 바로 이 지표입니다! 이 지표를 선택해야 하는 이유 트리플 컨펌 전략 EMA 크로스오버, RSI 모멘텀, MACD 히스토그램을 결합하여 신뢰할 수 있고 발생 가능성이 높은 신호를 생성합니다. 잘못된 진입을 줄이고 신뢰도를 높여줍니다! 재작업 없음 닫힌 봉에만 신호가 표시되므로, 보이는 신호가 최종 신호입니다. 추측이나 오해의 소지가 있는 알림이 없습니다. 차트에 크고 명확한 화살표 표시 정확한 캔들에서 매수 및 매도 신호를 즉시 확인하세요. 복잡하거나 혼란스러운 부분은 없습니다. 자동 이익실현 및 손절매 라인 설정 가능한 이익실현 및 손절매 라인이 차트에 동적으로 표시됩니다. 더욱 스마트하고 간편하게 위험을 관리하세요.
TrendPulse EA - 스마트한 추세 추종 전문가 어드바이저 TrendPulse EA는 강력한 시장 추세를 정확하게 포착하도록 설계된 강력하고 안정적인 트레이딩 로봇입니다. 검증된 빠른 지수이동평균(EMA)과 느린 지수이동평균(EMA)의 조합과 RSI 필터를 활용하여, 높은 확률의 진입 시점을 파악하고 맞춤형 손절매, 이익실현, 트레일링 손절매를 통해 위험을 관리합니다. 주요 기능: RSI 확인을 통한 동적 EMA 교차 전략 조정 가능한 위험 비율을 통한 스마트한 자금 관리 손절매, 이익실현, 트레일링 손절매 매개변수 설정 가능 다중 미결제 거래를 통해 안전하게 추세에 맞춰 확장 가능 모든 주요 외환 통화쌍 및 인기 시간대(H1, H4 권장)에서 작동 낮은 스프레드와 낮은 수수료의 브로커에 최적화 TrendPulse EA는 초보자부터 숙련된 트레이더까지 진입, 청산, 위험 관리를 자동화하여 거래를 간소화하고, 성장과 일관성에 집중할 수 있도록 지원합니다. 지
필터:
리뷰 없음
리뷰 답변