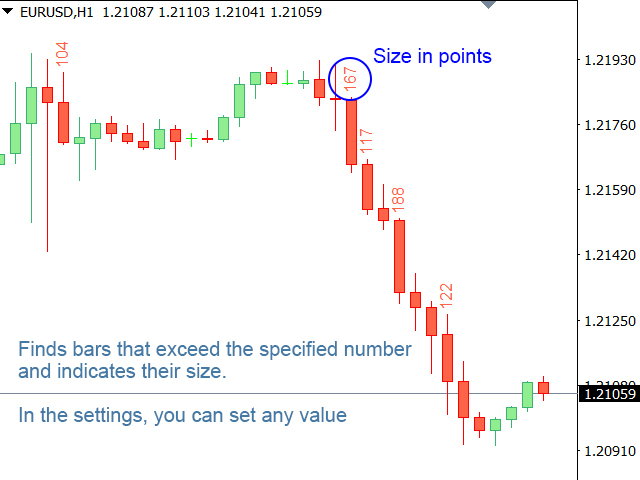
• 미리보기
  • 리뷰
  • 코멘트
  • 새 소식

Candle Size

Finds bars that exceed the specified size


My #1 Utility: includes 65+ functions  |  Contact me if you have any questions

2 operating modes:

  1. Real body: the difference between the open and close prices will be used;
  2. Extremes: the difference between the maximum and minimum prices will be used;


This Indicator:

  • Convenient for filter patterns in a period of low volatility;
  • Indicates the beginning of a trend;
  • Helps to see the most significant bars;
  • Can be used when trading binary options;

Input settings:

  • Bar Size: Set the size in points: the bars that exceed or equal this value will be indicated.
  • Real Bodies: 1) if truethe difference (Open-Close) will be used; 2) if false: the difference (High-Low) will be used;
  • Alert: Enable / disable notifications about the formation of new bars with the desired size;
  • Font Size: font size to indicate the size;
  • Up Color:  font color for bullish bars;
  • BearColor: font color for bear bars;
추천 제품
Blahtech Market Profile
Blahtech Limited
4.56 (16)
Was: $249  Now: $99   Market Profile defines a number of day types that can help the trader to determine market behaviour. A key feature is the Value Area, representing the range of price action where 70% of trading took place. Understanding the Value Area can give traders valuable insight into market direction and establish the higher odds trade. It is an excellent addition to any system you may be using. Blahtech Limited presents their Market Profile indicator for the MetaTrader community. Ins
Master scalping M1
Nataliia Marchuk
Master Scalping M1 is an innovative indicator that uses an algorithm to quickly and accurately determine the trend.The indicator calculates the time of opening and closing positions, the indicator's algorithms allow you to find the ideal moments to enter a deal (buy or sell an asset), which increase the success of transactions for most traders. Benefits of the indicator: Easy to assemble, does not overload the chart with unnecessary information. Can be used as a filter for any strategy. Works on
Trade with Gann on your side!! MASTER CIRCLE 360 CIRCLE CHART, originally created by Gann admitted that this is “The Mother of all charts”. It is one of the last studies that this great trader left for us. The numeric tab le is apparently quite simple like all the tables and is based on square numbers, the SQUARE OF 12 and is by evolution, one of the most important square numbers. Here we can find CYCLE, PRICE AND TIME thanks to angles and grades, to show past and future support and resistance.
TWO PAIRS SQUARE HEDGE METER INDICATOR Try this brilliant 2 pairs square indicator It draws a square wave of the relation between your two inputs symbols when square wave indicates -1 then it is very great opportunity to SELL pair1 and BUY Pair2 when square wave indicates +1 then it is very great opportunity to BUY pair1 and SELL Pair2 the inputs are : 2 pairs of symbols         then index value : i use 20 for M30 charts ( you can try other values : 40/50 for M15 , : 30 for M30 , : 10 for H1 ,
Point61 Indicator
Evgeniy Machok
5 (1)
The Point61 indicator is the result of many years of monitoring of price behavior of currency pairs and metals. It is not a secret, that in times of uncertainty, traders are looking for possible levels of support and resistance - the point, where price should stop its movement. There are 2 possible scenarios at these points: 1. Reverse (correction) to the opposite direction; 2. Breakthrough to continue movement. Very often these points are used to set stop orders - TakeProfit or
VR Cub
Vladimir Pastushak
VR Cub 은 고품질 진입점을 얻는 지표입니다. 이 지표는 수학적 계산을 용이하게 하고 포지션 진입점 검색을 단순화하기 위해 개발되었습니다. 지표가 작성된 거래 전략은 수년 동안 그 효율성을 입증해 왔습니다. 거래 전략의 단순성은 초보 거래자라도 성공적으로 거래할 수 있다는 큰 장점입니다. VR Cub은 포지션 개시 지점과 이익 실현 및 손절매 목표 수준을 계산하여 효율성과 사용 편의성을 크게 높입니다. 간단한 거래 규칙을 이해하려면 아래 전략을 사용한 거래 스크린샷을 살펴보세요. 설정, 세트 파일, 데모 버전, 지침, 문제 해결 등은 다음에서 얻을 수 있습니다. [블로그] 다음에서 리뷰를 읽거나 작성할 수 있습니다. [링크] 버전 [MetaTrader 5] 진입점 계산 규칙 포지션 개설 진입점을 계산하려면 VR Cub 도구를 마지막 최고점에서 마지막 최저점까지 늘려야 합니다. 첫 번째 지점이 두 번째 지점보다 빠른 경우, 거래자는 막대가 중간선 위에서 마감될 때까지 기다립
캔들의 종가를 예측하는 지표입니다. 지표는 주로 D1 차트에서 사용하기 위한 것이. 이 지표는 전통적인 외환 거래와 바이너리 옵션 거래 모두에 적합합니다. 지표는 독립형 거래 시스템으로 사용하거나 기존 거래 시스템에 추가로 사용할 수 있습니다. 이 표시기는 현재 양초를 분석하여 양초 본체 내부의 특정 강도 요인과 이전 양초의 매개변수를 계산합니다. 따라서 지표는 시장 움직임의 추가 방향과 현재 양초의 종가를 예측합니다. 이 방법 덕분에 지표는 단기 및 중장기 거래 모두에 적합합니다. 지표를 사용하면 시장 상황을 분석하는 동안 지표가 생성할 잠재적 신호의 수를 설정할 수 있습니다. 표시기 설정에는 이를 위한 특별한 매개변수가 있습니다. 또한 인디케이터는 새로운 신호에 대해 차트의 메시지 형태, 이메일 및 PUSH 알림 형태로 알릴 수 있습니다. 구매 후 저에게 꼭 써주세요! 나는 당신에게 지표와 거래에 대한 나의 추천을 줄 것입니다! 또한 보너스를 받으세요!
This multicurrency indicator is the Lite version of the Cosmic Diviner Reversal Zone Pro indicator. The indicator is based on original formulas for analyzing the volatility and price movement strength. This allows determining the overbought and oversold states of instruments with great flexibility, as well as setting custom levels for opening buy or sell orders when the overbought or oversold values of the instruments reach a user-defined percentage. A huge advantage of Reversal Zone Lite is the
History Pattern Search
Yevhenii Levchenko
표시기는 현재 시세를 작성하여 과거 시세와 비교할 수 있으며 이를 바탕으로 가격 변동을 예측합니다. 표시기에는 원하는 날짜로 빠르게 이동할 수 있는 텍스트 필드가 있습니다. 옵션: 기호 - 표시기가 표시할 기호 선택. SymbolPeriod - 지표가 데이터를 가져올 기간 선택. IndicatorColor - 표시기 색상. HorisontalShift - 지시자가 그린 따옴표를 지정된 막대 수만큼 이동합니다. Inverse - true는 인용 부호를 반대로, false - 원래 보기를 반전합니다. ChartVerticalShiftStep - 차트를 수직으로 이동합니다(키보드의 위/아래 화살표). 다음은 날짜를 입력할 수 있는 텍스트 필드의 설정으로, '엔터'를 누르면 즉시 이동할 수 있습니다.
EZT Trade History This is a great tool to analyze past trades or follow current ongoing trades, especially when you using an EA to manage your transactions. You will see the exact candle where the trade was opened and closed. Collapsible floating panel on the chart, free to move anywhere with your mouse. When you using multiple EA’s with different magic numbers, you have 5 options to separate those trades, so you will know which EA opened specific transactions. You can set the day limits how fa
Scalping Sakurai
Volodymyr Zubov
Scalper indicator designed for accurate entry into trade transactions. Designed for intraday and medium-term trading on any instrument. The indicator does not redraw and does not lag. There is a possibility of visual and sound notification of the appearance of a signal to enter. The indicator also sends signals to digital buffers, which makes it possible to create automated trading systems based on it.
Trend Deviation
VLADISLAV AKINDINOV
Trend indicator with calculation of dynamic levels and signaling their intersection. Description of input parameters: StepTF = true; - Calculation of the indicator by closing the bar (true) or by each tick (false) BarsCount = 300; - Number of settlement bars Price = PRICE_CLOSE; - Type of price used TimeFrame = PERIOD_CURRENT; - Estimated timeframe TrendPeriod = 9; - Trend calculation period TrendDeviations = 4.9; - coefficient of deviation PeriodTrendSmooth = 1; - Trend smoothi
Gann Square of 144
Taras Slobodyanik
5 (5)
The Gann Box (or Gann Square) is a market analysis method based on the "Mathematical formula for market predictions" article by W.D. Gann. This indicator can plot three models of Squares: 90, 52(104), 144. There are six variants of grids and two variants of arcs. You can plot multiple squares on one chart simultaneously. Parameters Square — selection of a square model: 90 — square of 90 (or square of nine); 52 (104) — square of 52 (or 104); 144 — universal square of 144; 144 (full) — "full"
Arrow X
Pieter Gerhardus Van Zyl
항목에 도움이 되는 비다시 그리기 화살표 표시기 추세 시장에서는 더 나은 신호가 제공됩니다. 현재 막대가 닫혀 화살표가 제자리에 고정될 때까지 기다립니다. 헷갈릴만한 설정 없이 차트만 불러오세요 화살표의 색상과 크기를 조정할 수 있습니다 표시기는 외환, 암호화폐 등 모든 쌍이나 기간에 사용할 수 있습니다. 더 큰 기간 추세로 거래하는 것이 더 좋습니다 ------------------------------------- --------- hangmog-e doum-i doeneun bidasi geuligi hwasalpyo pyosigi chuse sijang-eseoneun deo na-eun sinhoga jegongdoebnida. hyeonjae magdaega dadhyeo hwasalpyoga jejalie gojeongdoel ttaekkaji gidalibnida. hesgallilmanhan seoljeong eobs-i chateuman bulleooseyo hw
Matrixs
Andriy Sydoruk
Matrix is a Forex arrow indicator. Displays signals simply and clearly! The arrows show the direction of the transaction, and are colored accordingly, which can be seen in the screenshots. As you can see, trading with such an indicator is easy. I waited for an arrow to appear in the desired direction - I opened a deal. An arrow formed in the opposite direction - closed the deal. The indicator also displays the lines with the help of which the arrow signals are formed, taking into account the int
VN Trade Panel II
Vyacheslav Nekipelov
4 (1)
The new version of the trading panel, which now has the ability to separately close Buy and Sell orders, display targets for all orders on the chart, as well as the ability to use the panel to trade with brokers working on the FIFO rule. Also, the new version adds option buttons for separate management of open orders. It has a convenient visualized interface and intuitive control without a lot of additional tabs to which traders have to be distracted and switch their attention. Thanks to this
Displays the local time with the time difference you set. (It does not correspond to the time difference in 30-minute increments.) It also displays a price line with a good price, such as 100.000 .100 or .200. The standard gridlines are displayed with the time and price by MT4, but they are very confusing as they become the broker's time and are displayed at the halfway point along with the price. It hides them and displays gridlines at user-defined time differences and prices in easy-to-und
Volume Profile Indicator for MT4 Gain a trading edge with the "Volume Profile" indicator for MetaTrader 4 (MT4). This advanced technical analysis tool allows you to precisely identify key support and resistance levels based on transaction volume. Easily visualize market areas of high interest, where trading volumes are highest, and use this information to make more informed trading decisions. Key Features: Clear and detailed visualization : The indicator displays volume histograms directly on th
We present you the indicator "Candle closing counter", which will become your indispensable assistant in the world of trading. That’s why knowing when the candle will close can help: If you like to trade using candle patterns, you will know when the candle will be closed. This indicator will allow you to check if a known pattern has formed and if there is a possibility of trading. The indicator will help you to prepare for market opening and market closure. You can set a timer to create a p
Noize Absorption Index MT4
Ekaterina Saltykova
5 (1)
Noize Absorption Index - is the manual trading system that measures the difference of pressure between bears forces and bulls forces. Green line - is a noize free index that showing curent situation. Zero value of index shows totally choppy/flat market.Values above zero level shows how powerfull bullish wave is and values below zero measures bearish forces.Up arrow appears on bearish market when it's ready to reverse, dn arrow appears on weak bullish market, as a result of reverse expectation. S
CumulativeDeltaBars
Stanislav Korotky
This indicator is a conventional analytical tool for tick volumes changes. It calculates tick volumes for buys and sells separately, and their delta on every bar, and displays volumes by price clusters (cells) within a specified bar (usually the latest one). The algorithm used internally is the same as in the indicator VolumeDelta , but results are shown as cumulative volume delta bars (candlesticks). Analogous indicator for MetaTrader 5 exists - VolumeDeltaBars . This is a limited substitution
Infinity Trend Pro
Yaroslav Varankin
1 (1)
This is a trend indicator without redrawing Developed instead of the binary options strategy (by the color of the Martingale candlestick) Also works well in forex trading When to open trades (binary options) A signal will appear in the place with a candle signaling the current candle It is recommended to open a deal for one candle of the current timeframe M1 and M5 When a blue dot appears, open a deal up When a red dot appears, open a trade down. How to open trades on Forex. When a signal is rec
PZ Chart Overlay
PZ TRADING SLU
5 (1)
Master the market: harness the power of statistical arbitrage This indicator showcases the price action of multiple instruments on a single chart, enabling you to compare the fluctuations of different assets and seamlessly implement statistical arbitrage strategies. Its main usage is to find correlated symbols which are temporarily out of whack. [ Installation Guide | Update Guide | Troubleshooting | FAQ | All Products ] Find overbought or oversold currency pairs easily Plot up to six curr
The Chaikin Oscillator is a technical indicator developed by Marc Chaikin that combines price and volume data to measure the accumulation and distribution of a financial instrument. It aims to identify potential buying and selling opportunities in the market. The Chaikin Oscillator is calculated by subtracting a 10-day exponential moving average of the Accumulation Distribution Line (ADL) from a 3-day exponential moving average of the ADL. Here's how to use the Chaikin Oscillator indicator in tr
PatternMMB
Mikhail Bilan
The PatternMMB trading indicator finds the most common candlestick analysis patterns and provides trading recommendations based on them. The PatternMMB trading indicator is designed to search for candlestick patterns on the price chart and issue trading recommendations depending on the nature of the found candlestick pattern. It is also possible to send sound notifications when all or any of the selected patterns appear, with an explanation of the pattern and its interpretation. In addition, th
A technical indicator that calculates its readings on trading volumes. In the form of a histogram, it shows the accumulation of the strength of the movement of the trading instrument. It has independent calculation systems for bullish and bearish directions. Works on any trading instruments and time frames. Can complement any trading system. The indicator does not redraw its values, the signals appear on the current candle. It is easy to use and does not load the chart, does not require additi
Volume by Price MT4
Brian Collard
4.64 (11)
The Volumebyprice.com Indicator for MetaTrader 4 features Volume Profile and Market Profile TPO (Time Price Opportunity). Volume and TPO histogram bar and line charts. Volume Footprint charts. TPO letter and block marker collapsed and split structure charts. Static, dynamic and flexible range segmentation and compositing methods with relative and absolute visualizations. Session hours filtering and segment concatenation with Market Watch and custom user specifications. Graphical layering, posit
The Supply and Demand Zones indicator is one of the best tools we have ever made. This great tool automatically draws supply and demand zones, the best places for opening and closing positions. It has many advanced features such as multi timeframe zones support, displaying the width of zones, alert notifications for retouched zones, and much more. Because of market fractality, this indicator can be used for any kind of trading. Whether you are a positional, swing, or intraday trader does not ma
Daily FIBO Pro
Mark Thimoty Evangelista
BERG Daily FIBO Pro로 트레이딩 잠재력을 극대화하세요 BERG Daily FIBO Pro 는 MetaTrader 4 (MT4) 플랫폼을 위해 특별히 설계된 강력하고 커스터마이징 가능한 피보나치 되돌림 지표입니다. 숙련된 트레이더든, 초보자든 상관없이 이 지표는 중요한 지지 및 저항 레벨을 식별하고, 시장 분석을 강화하며, 트레이딩 전략을 최적화하는 데 필요한 필수 도구입니다. 왜 BERG Daily FIBO Pro를 선택해야 할까요?   정밀한 피보나치 분석:   전일의 고가와 저가를 기준으로 자동 계산된 피보나치 되돌림 레벨로 시장에서 우위를 점하세요.   BERG Daily FIBO Pro 는 0%, 23.6%, 38.2%, 50%, 61.8%, 78.6%, 100%의 레벨을 그려, 잠재적인 시장 전환점을 쉽게 식별할 수 있도록 도와줍니다.   지능형 알림 시스템:   가격이 피보나치 레벨에 도달하면 사용자 지정 알림으로 기회를 놓치지 않습니다. 시각적
Simply The Best Pro
Szymon Palczynski
5 (1)
This indicator displays the histogram and arrows on chart. When Simple The Best Pro are placed on a chart, they identify the trend.  The color of may be blue or red. The blue color stands for upside moves and the red color stands for downside trends. The indicator offers to set Stop Loss (SL) and  Take Profit (TP)  setting. The default value is ATR. Indicator has automatic optimization. The STB is a unique indicator that shows the tendency (button Bars) of a particular signals. The STB tells us
이 제품의 구매자들이 또한 구매함
Gann Made Easy
Oleg Rodin
4.85 (82)
Gann Made Easy 는 mr.의 이론을 사용하여 최고의 거래 원칙을 기반으로 하는 전문적이고 사용하기 쉬운 Forex 거래 시스템입니다. W.D. 간. 이 표시기는 Stop Loss 및 Take Profit Levels를 포함하여 정확한 BUY 및 SELL 신호를 제공합니다. PUSH 알림을 사용하여 이동 중에도 거래할 수 있습니다. 구매 후 연락주세요! 내 거래 팁과 훌륭한 보너스 지표를 무료로 공유하겠습니다! 아마도 Gann 거래 방법에 대해 이미 여러 번 들었을 것입니다. 일반적으로 Gann의 이론은 초보자 거래자뿐만 아니라 이미 거래 경험이 있는 사람들에게도 매우 복잡한 것입니다. Gann의 거래 방식은 이론적으로 적용하기 쉽지 않기 때문입니다. 나는 그 지식을 연마하고 Forex 지표에 최고의 원칙을 적용하기 위해 몇 년을 보냈습니다. 표시기는 적용하기가 매우 쉽습니다. 차트에 첨부하고 간단한 거래 권장 사항을 따르기만 하면 됩니다. 지표는 지속적으로 시장 분석 작업
TPSpro RFI Levels
Roman Podpora
4.82 (22)
Reversal First Impulse levels (RFI)    INSTRUCTIONS        RUS       -       ENG              R ecommended to use with an indicator   -   TPSpro  TREND PRO -  Version MT5 A key element in trading is zones or levels from which decisions to buy or sell a trading instrument are made. Despite attempts by major players to conceal their presence in the market, they inevitably leave traces. Our task was to learn how to identify these traces and interpret them correctly. Main functions: Displaying activ
Atomic Analyst
Issam Kassas
5 (2)
우선적으로 언급할 점은이 거래 지표가 다시 그리지 않고 지연되지 않으며 이를 통해 수동 및 로봇 거래 모두에 이상적이라는 점입니다. 사용자 매뉴얼: 설정, 입력 및 전략. Atomic Analyst는 가격의 강도와 모멘텀을 활용하여 시장에서 더 나은 이점을 찾는 PA Price Action Indicator입니다. 고급 필터를 장착하여 잡음과 거짓 신호를 제거하고 거래 잠재력을 높이는 데 도움이 됩니다. 복잡한 지표의 다중 레이어를 사용하여 Atomic Analyst는 차트를 스캔하고 복잡한 수학적 계산을 간단한 신호와 색상으로 변환하여 초보 트레이더가 이해하고 일관된 거래 결정을 내릴 수 있도록합니다. "Atomic Analyst"는 새로운 및 경험이 풍부한 트레이더를위한 종합적인 거래 솔루션입니다. 프리미엄 지표와 최고 수준의 기능을 하나의 거래 전략에 결합하여 모든 종류의 트레이더에 대한 다재다능한 선택지가되었습니다. 인트라데이 거래 및 스캘핑 전략 : 빠르고 정확한
Gold Stuff
Vasiliy Strukov
4.89 (238)
Gold Stuff는 금을 위해 특별히 설계된 추세 지표이며 모든 금융 상품에서도 사용할 수 있습니다. 표시기가 다시 그려지지 않고 지연되지 않습니다. 권장 기간 H1. 표시기에서 완전 자동 Expert Advisor EA Gold Stuff를 작동합니다. 내 프로필에서 찾을 수 있습니다. 설정 및 개인 보너스를 받으려면 구매 후 즉시 저에게 연락하십시오!   강력한 지원 및 트렌드 스캐너 표시기의 무료 사본을 받으실 수 있습니다. 메시지를 보내주세요. 나!   설정 화살표 그리기 - 켜기 끄기. 차트에 화살표 그리기. 경고 - 가청 경고를 끕니다. 이메일 알림 - 켜기 끄기. 이메일 알림. Puch-notification - 켜기 끄기. 푸시 알림. 다음으로 색 영역을 조정합니다. Gold Stuff는 금을 위해 특별히 설계된 추세 지표이며 모든 금융 상품에서도 사용할 수 있습니다. 표시기가 다시 그려지지 않고 지연되지 않습니다. 권장 기간 H1. 표시기에서 완
Trend Punch
Mohamed Hassan
4.95 (19)
This indicator is unstoppable when combined with our other indicator called  Support & Resistance . After purchase, send us a message and you will get it   for  FREE as a BONUS! Introducing Trend Punch , the revolutionary forex trend indicator that will transform the way you trade! Trend Punch is uniquely designed to provide precise buy and sell arrows during strong market trends, making your trading decisions clearer and more confident. Whether you're trading major currency pairs or exotic sym
Scalper Inside PRO
Alexey Minkov
4.73 (56)
An exclusive indicator that utilizes an innovative algorithm to swiftly and accurately determine the market trend. The indicator automatically calculates opening, closing, and profit levels, providing detailed trading statistics. With these features, you can choose the most appropriate trading instrument for the current market conditions. Additionally, you can easily integrate your own arrow indicators into Scalper Inside Pro to quickly evaluate their statistics and profitability. Scalper Inside
TPSproTREND PrO
Roman Podpora
4.79 (19)
TPSpro TREND PRO는   시장을 자동으로 분석하여 추세와 각 변화에 대한 정보를 제공할 뿐만 아니라 다시 그리지 않고도 거래에 진입할 수 있는 신호를 제공하는 추세 지표입니다! 지표는 각 양초를 사용하여 개별적으로 분석합니다. 다른 임펄스를 언급합니다 - 업 또는 다운 임펄스. 통화, 암호화폐, 금속, 주식, 지수 거래의 정확한 진입점! 버전 MT5                   표시기에 대한 전체 설명       표시기   와 함께 사용하는 것이 좋습니다   -   RFI LEVELS 주요 기능: 렌더링 없이 정확한 입력 신호! 신호가 나타나면 관련성은 유지됩니다! 이는 신호를 제공한 후 변경하여 예금 자금 손실을 초래할 수 있는 다시 그리기 지표와의 중요한 차이점입니다. 이제 더 큰 확률과 정확도로 시장에 진입할 수 있습니다. 화살표가 나타난 후 목표에 도달(이익실현)하거나 반전 신호가 나타날 때까지 캔들을 색칠하는 기능도 있습니다. STOP LOSS / TAK
FX Power MT4 NG
Daniel Stein
5 (12)
모닝 브리핑 여기 mql5 와 텔레그램에서 FX Power MT4 NG 는 오랫동안 인기 있는 통화 강도 측정기인 FX Power의 차세대 버전입니다. 이 차세대 강도 측정기는 무엇을 제공합니까? 기존 FX Power에서 좋아했던 모든 것 PLUS GOLD/XAU 강도 분석 더욱 정밀한 계산 결과 개별 구성 가능한 분석 기간 더 나은 성능을 위한 사용자 정의 가능한 계산 한도 특별 멀티더 많은 것을보고 싶은 사람들을위한 특별한 다중 인스턴스 설정 모든 차트에서 좋아하는 색상을위한 끝없는 그래픽 설정 수많은 알림 옵션, 중요한 것을 다시는 놓치지 않도록 Windows 11 및 macOS 스타일의 둥근 모서리가 있는 새로운 디자인 마법처럼 움직이는 인디케이터 패널 FX 파워 키 특징 모든 주요 통화의 완전한 강세 이력 모든 시간대에 걸친 통화 강세 이력 모든 브로커 및 차트에서 고유 계산 결과 100% 신뢰할 수있는 실시간100 % 신뢰할 수있는 실시간 계산-> 다시 칠하지 않음
현재 20% 할인 ! 초보자 또는 전문가 트레이더를 위한 최고의 솔루션! 이 대시보드 소프트웨어는 28개의 통화 쌍에서 작동합니다. 2가지 주요 지표(Advanced Currency Strength 28 및 Advanced Currency Impulse)를 기반으로 합니다. 전체 Forex 시장에 대한 훌륭한 개요를 제공합니다. 고급 통화 강도 값, 통화 이동 속도 및 모든(9) 시간대의 28 Forex 쌍에 대한 신호를 보여줍니다. 추세 및/또는 스캘핑 기회를 정확히 파악하기 위해 차트의 단일 지표를 사용하여 전체 시장을 볼 수 있을 때 거래가 어떻게 개선될지 상상해 보십시오! 잠재적인 거래를 식별하고 확인하면서 강력한 통화와 약한 통화를 더욱 쉽게 식별할 수 있도록 이 지표에 기능을 내장했습니다. 이 표시기는 통화의 강세 또는 약세가 증가 또는 감소하는지 여부와 모든 시간대에서 수행되는 방식을 그래픽으로 보여줍니다. 추가된 새로운 기능은 현재 시장 조건 변화에 적
Trend Screener
STE S.S.COMPANY
4.8 (87)
트렌드 표시기, 트렌드 트레이딩 및 필터링을 위한 획기적인 고유 솔루션, 하나의 도구 안에 내장된 모든 중요한 트렌드 기능! Forex, 상품, 암호 화폐, 지수 및 주식과 같은 모든 기호/도구에 사용할 수 있는 100% 다시 칠하지 않는 다중 시간 프레임 및 다중 통화 표시기입니다. 기간 한정 특가: 지원 및 저항 스크리너 지표는 단 100달러에 평생 제공됩니다. (원래 가격 50 달러) (제안 연장) Trend Screener는 차트에 점이 있는 화살표 추세 신호를 제공하는 효율적인 지표 추세 추종 지표입니다. 추세 분석기 표시기에서 사용할 수 있는 기능: 1. 트렌드 스캐너. 2. 최대 이익 분석이 있는 추세선. 3. 추세 통화 강도 측정기. 4. 경고가 있는 추세 반전 점. 5. 경고가 있는 강력한 추세 점. 6. 추세 화살표 Trend Screener Indicator가 있는 일일 분석 예, 일일 신호 성능...등은 여기에서 찾을 수 있습니다.   여기를 클릭하십시오.
FX Volume
Daniel Stein
4.58 (33)
모닝 브리핑을 통해 세부 정보와 스크린샷으로 매일 시장 업데이트를 받으세요 여기 mql5 및 텔레그램에서 FX 거래량은 브로커의 관점에서 시장 심리에 대한 실제 통찰력을 제공하는 최초이자 유일한 거래량 지표입니다. 브로커와 같은 기관 시장 참여자가 외환 시장에서 어떤 포지션을 취하고 있는지에 대한 훌륭한 통찰력을 COT 보고서보다 훨씬 빠르게 제공합니다. 차트에서 이 정보를 직접 확인하는 것은 트레이딩의 진정한 판도를 바꾸고 획기적인 솔루션입니다. 다음과 같은 고유한 시장 데이터 인사이트의 이점 비율 는 통화의 매수/매도 포지션 비율을 백분율로 표시 비율 변화 는 선택한 기간 내 매수 비율과 비율 변화를 표시 총 거래량 는 해당 통화의 총 거래량(롱 및 숏)을 로트 단위로 보여줍니다 Volumes Long 는 해당 통화의 모든 롱 포지션의 거래량을 보여줍니다 Volumes Short 는 해당 통화의 모든 숏 포지션의 거래량을 보여줍니다 Net Long 는 순 롱 포지션의 거래량
- Real price is 80$ - 40% Discount ( It is 49$ now ) Contact me for instruction, add group and any questions! Related EA Product: Bitcoin Expert Introduction The breakout and retest strategy is traded support and resistance levels. it involves price breaking through a previous level.  The break and retest strategy is designed to help traders do two main things, the first is to avoid false breakouts. Many false breakouts start with a candlestick that breaks out of a level but ends with an immedi
Advanced Currency IMPULSE with ALERT
Bernhard Schweigert
4.9 (480)
현재 31% 할인!! 초보자 또는 전문가 트레이더를 위한 최고의 솔루션! 이 지표는 우리가 독점 기능과 비밀 공식을 통합했기 때문에 독특하고 고품질이며 저렴한 거래 도구입니다. 단 하나의 차트로 28개 통화 쌍 모두에 대한 경고를 제공합니다. 새로운 추세 또는 스캘핑 기회의 정확한 트리거 포인트를 정확히 찾아낼 수 있기 때문에 거래가 어떻게 개선될지 상상해 보십시오! 새로운 기본 알고리즘을 기반으로 구축되어 잠재적인 거래를 훨씬 더 쉽게 식별하고 확인할 수 있습니다. 이는 통화의 강세 또는 약세가 가속되는지 여부를 그래픽으로 표시하고 가속 속도를 측정하기 때문입니다. 자동차의 속도계처럼 생각하면 됩니다. 가속화할 때 Forex 시장에서 동일한 일이 분명히 더 빠르게 발생합니다. 즉, 반대 방향으로 가속화되는 통화를 페어링하면 잠재적으로 수익성 있는 거래를 식별한 것입니다. 통화 모멘텀의 수직선과 화살표가 거래를 안내합니다! 역동적인 Market Fibonacci 23
Enigmera
Ivan Stefanov
5 (3)
에니메라: 시장의 핵심 https://www.enigmera.com 소개 이 지표 및 트레이딩 시스템은 금융 시장에 대한 놀라운 접근 방식입니다. 에니메라는 프랙탈 주기를 사용하여 지지선과 저항선을 정확하게 계산합니다. 진정한 축적 단계를 보여주고 방향과 목표를 제시합니다.  추세에 있든 조정에 있든 작동하는 시스템입니다.  어떻게 작동하나요? 에니메라는 지지선/저항선, 목표선, 편차선의 세 가지 라인으로 구성됩니다. 이 시스템은 과거 데이터를 현재와 미래로 추정하는 일반적인 시장 지표와 달리 현재에 대한 완전한 그림을 제공합니다. 지지선 위에 있으면 실제 지지를 의미하고 저항선 위에 있으면 실제 저항을 의미합니다. 레벨이 깨지면 추세의 변화를 나타냅니다. 다시 그리지 않습니다. 시장이 지속적으로 진화함에 따라 에니메라는 평가 도구를 조정하여 전략을 정기적으로 수정합니다.   이를 통해 모든 시나리오를 철저히 평가할 수 있습니다. 이 시장 지표의 고유성은 분명하며 그 기
Trend Cutter
Oleg Rodin
5 (2)
Trend Cutter는 M1 및 M5와 같은 하위 기간을 포함하여 모든 기간에 사용할 수 있는 추세 지표입니다. 이 지표는 일중 거래를 선호하는 트레이더에게 이상적이며 장기 거래를 선호하는 트레이더에게도 도움이 될 것입니다. 이 지표를 거래 시스템의 기초로 사용하거나 독립형 거래 솔루션으로 사용할 수 있습니다. 표시기는 PUSH 알림을 포함한 모든 유형의 경고를 제공합니다. 표시기는 사용하기 매우 쉽습니다. 신호를 따라가기만 하면 됩니다. 또한 이 지표의 모든 사용자에게 추가 지표를 무료로 제공할 예정이며, 이는 귀하가 이 방법을 최대한 효율적으로 사용하는 데 도움이 될 것입니다. 거래 팁과 큰 보너스를 얻으려면 구매 후 저에게 연락하십시오! 관심을 가져주셔서 감사합니다! 귀하의 거래에서 큰 성공을 기원합니다!
PRO Renko System
Oleg Rodin
5 (25)
PRO Renko System 은 RENKO 차트 거래를 위해 특별히 고안된 매우 정확한 거래 시스템입니다. 이것은 다양한 거래 상품에 적용될 수있는 보편적 인 시스템입니다. 체계는 효과적으로 당신에게 정확한 반전 신호에 접근을 주는 소위 시장 소음을 중화합니다. 이 표시기는 사용하기가 매우 쉽고 신호 생성을 담당하는 매개 변수가 하나만 있습니다. 당신은 쉽게 당신의 선택의 어떤 무역 계기에 공구를 적응시킬 수 있고 renko 막대기의 크기. 나는 항상 당신이 내 소프트웨어로 수익성있게 거래 할 수 있도록 추가 지원을 제공 할 준비가되어 있습니다! 나는 당신에게 행복하고 수익성있는 거래를 기원합니다! 구매 후 저에게 연락하십시오! 내 렌코 차트 생성기를 보내드립니다. 또한 내 개인 권장 사항 및 시스템의 다른 모듈을 무료로 공유 할 것입니다!
Advanced Currency Strength28 Indicator
Bernhard Schweigert
4.9 (649)
현재 26% 할인 초보자 또는 전문가 트레이더를 위한 최고의 솔루션! 이 지표는 우리가 독점 기능과 새로운 공식을 통합했기 때문에 독특하고 고품질이며 저렴한 거래 도구입니다. 단 하나의 차트로 28 Forex 쌍의 통화 강도를 읽을 수 있습니다! 새로운 추세 또는 스캘핑 기회의 정확한 트리거 포인트를 정확히 찾아낼 수 있기 때문에 거래가 어떻게 개선될지 상상해 보십시오. 사용 설명서: 여기를 클릭  https://www.mql5.com/en/blogs/post/697384 그것이 첫 번째, 원본입니다! 쓸모없는 지망생 클론을 사지 마십시오. 더 스페셜  강력한 통화 모멘텀을 보여주는 하위 창의 화살표 GAP가 거래를 안내합니다! 기본 또는 호가 통화가 과매도/과매도 영역(외부 시장 피보나치 수준)에 있을 때 개별 차트의 기본 창에 경고 표시가 나타납니다. 통화 강도가 외부 범위에서 떨어질 때 풀백/반전 경고. 교차 패턴의 특별 경고 추세를 빠르게 볼 수 있는
Market Reversal Alerts
LEE SAMSON
4.19 (113)
가격이 역전되고 후퇴함에 따라 시장 구조가 변경됩니다. 시장 구조 반전 경고 표시기는 추세 또는 가격 움직임이 고갈에 가까워지고 반전할 준비가 되었음을 식별합니다. 일반적으로 반전이나 큰 하락이 일어나려고 할 때 발생하는 시장 구조의 변화를 알려줍니다. 지표는 가능한 고갈 지점 근처에서 새로운 고점 또는 저점이 형성될 때마다 초기에 돌파와 가격 모멘텀을 식별합니다. 표시기는 반대쪽에 있는 마지막 촛불에 직사각형을 그립니다. 그런 다음 현재의 단기 추세에서 계속 움직이기 때문에 가격과 함께 직사각형을 따라갈 것입니다. 가격이 사각형 위나 아래로 다시 닫힐 정도로 약해지면 시장 구조에 잠재적인 변화가 일어나고 있음을 나타냅니다. 그런 다음 표시기는 방향의 잠재적인 이동과 추세 또는 주요 하락의 가능한 반전 시작에 대해 경고합니다. 작동 방식을 보려면 아래의 작동 표시기를 참조하십시오! 여기에서 모든 쌍 및 기간을 모니터링하기 위한 선택적 대시보드 추가 기능: https://
TakePropips Donchian Trend Pro
Eric John Pajarillaga Aldana
4.44 (16)
TakePropips Donchian Trend Pro   (MT4)는 Donchian 채널을 사용하여 추세의 방향을 자동으로 감지하고 진입 및 퇴장 거래 신호를 제공하는 강력하고 효과적인 도구입니다! 이 다기능 지표에는 추세 스캐너, 거래 신호, 통계 패널, 스크리너, 거래 세션 및 경고 내역 대시보드가 포함됩니다. 거래 신호를 제공하고 차트 분석 시간을 절약하도록 설계되었습니다! 다음 블로그 게시물에서 사용자 설명서 및 설치 가이드를 다운로드할 수 있습니다.   https://www.mql5.com/en/blogs/post/751368 오늘 50% 할인을 받으세요! 가격이 $98에서 $49로 인하되었습니다! 전략 테스터에서 이 지표를 테스트할 수 있습니다(비주얼 모드 활성화).  자세한 내용은 설명 아래에 비디오 자습서도 제공됩니다. 질문이 있거나 도움이 필요하면 저에게 연락하십시오. TakePropips Donchian Trend Pro 지표는 모든 Forex 쌍, 금속
차트에 지지 및 저항 수준과 추진 캔들 갭을 자동으로 그려주므로 다음 가격 방향 및/또는 잠재적 반전 가능성을 확인할 수 있습니다. 이 보조지표는 제 웹사이트(시장 구조 트레이더)에서 가르치는 포지션 트레이딩 방법론의 일부로 사용하도록 설계되었으며 타겟팅 및 잠재적 진입을 위한 주요 정보를 표시합니다. 이 보조지표에는 2가지 핵심 기능과 4가지 추가 기능이 있습니다: 핵심 기능 1 - 일일, 주간 및 월간 시간대의 자동 지지선 및 저항선 이 인디케이터는 지난 2일에서 최대 6주 및 몇 달 전의 가장 최근 지원 및 저항 수준을 자동으로 가져옵니다. 이러한 레벨의 모양을 원하는 대로 완전히 사용자 지정하고 표시되는 레벨 수를 표시할 수 있습니다. 이러한 주요 레벨은 종종 가격이 하락하거나 반전되는 주요 지지 및 저항 구간으로 작용합니다. 또한 가격이 향할 목표가 되기도 하므로 가격이 전환되기 전에 거래할 수 있는 잠재적 거리를 빠르게 확인할 수 있습니다. 핵심 기능 2 -
Currency Strength Wizard
Oleg Rodin
4.93 (44)
통화 강도 마법사는 성공적인 거래를 위한 올인원 솔루션을 제공하는 매우 강력한 지표입니다. 표시기는 여러 시간 프레임의 모든 통화 데이터를 사용하여 이 또는 해당 외환 쌍의 힘을 계산합니다. 이 데이터는 특정 통화의 힘을 확인하는 데 사용할 수 있는 사용하기 쉬운 통화 지수 및 통화 전력선의 형태로 표시됩니다. 필요한 것은 거래하려는 차트에 표시기를 부착하는 것뿐입니다. 표시기는 거래하는 통화의 실제 강세를 보여줍니다. 지표는 또한 추세와 거래할 때 유리하게 사용할 수 있는 구매 및 판매 거래량 압력의 극한값을 보여줍니다. 지표는 또한 피보나치에 기반한 가능한 대상을 보여줍니다. 표시기는 PUSH 알림을 포함한 모든 유형의 알림을 제공합니다. 구매 후 연락주세요. 나는 당신과 거래 팁을 공유하고 당신에게 무료로 훌륭한 보너스 지표를 줄 것입니다! 나는 당신에게 행복하고 유익한 거래를 기원합니다!
IX Power MT4
Daniel Stein
5 (5)
IX Power는 마침내 FX Power의 탁월한 정밀도를 외환이 아닌 기호에도 적용했습니다. 좋아하는 지수, 주식, 원자재, ETF, 심지어 암호화폐까지 단기, 중기, 장기 추세의 강도를 정확하게 파악할 수 있습니다. 단말기가 제공하는 모든 것을 분석할 수 있습니다. 사용해 보고 트레이딩 타이밍이 크게 향상되는 것을 경험해 보세요. IX Power 주요 특징 단말기에서 사용 가능한 모든 거래 심볼에 대해 100% 정확한 비재도장 계산 결과 제공 사전 구성 및 추가적으로 개별 구성 가능한 강도 분석 기간의 드롭다운 선택 가능 이메일, 메시지, 모바일 알림을 통한 다양한 알림 옵션 제공 EA 요청을 위한 액세스 가능한 버퍼 더 나은 성능을 위한 사용자 지정 가능한 계산 한도 더 많은 것을 보고 싶은 사용자를 위한 특별 다중 인스턴스 설정 모든 차트에서 좋아하는 색상을 위한 무한한 그래픽 설정 가능 Windows 11 및 macOS 스타일의 둥근 모서리를 가
ADR Reversal Indicator
LEE SAMSON
4.15 (13)
ADR 반전 표시기는 가격이 정상적인 일일 평균 범위와 관련하여 현재 거래되고 있는 위치를 한 눈에 보여줍니다. 가격이 평균 범위를 초과하고 선택한 수준보다 높을 때 팝업, 이메일 또는 푸시를 통해 즉각적인 알림을 받을 수 있으므로 신속하게 철회 및 반전에 뛰어들 수 있습니다. 지표는 평균 일일 범위 극단에서 차트에 수평선을 그리고 가격이 초과하는 수학적 확률이 첨부된 수준 위의 확장을 그립니다. 자세한 내용은 아래에서... 표시기를 보완하고 모든 쌍을 모니터링하기 위한 ADR 경고 대시보드: https://www.mql5.com/en/market/product/62756 MT5 버전도 여기에서 사용 가능: https://www.mql5.com/en/market/product/64477/ 시간의 약 60%는 가격이 정상적인 일일 평균 범위(ADR) 내에서 거래되고 이 수준 이상으로 상승하면 일반적으로 급격한 가격 변동의 지표이며 일반적으로 이에 따라 후퇴(이익 차감) 움
Trend Pulse
Mohamed Hassan
5 (4)
Please contact me after purchase to immediately get your PDF strategy + documentation for Trend Pulse !  Introducing Trend Pulse , a unique and robust indicator capable of detecting bullish, bearish, and even ranging trends! Trend Pulse uses a special algorithm to filter out market noise with real precision. If the current symbol is moving sideways, Trend Pulse will send you a ranging signal, letting you know that it's not a good time to enter a trade. This excellent system makes Trend Pulse
RSI / TDI 알림 대시보드를 사용하면 거래하는 모든 주요 쌍에서 RSI를 한 번에(귀하가 선택 가능) 모니터링할 수 있습니다. 두 가지 방법으로 사용할 수 있습니다. 1. 여러 시간 프레임을 선택하면 일반적인 거래 조건을 넘어 확장된 여러 시간 프레임이 있을 때 대시가 표시됩니다. 가격이 여러 기간에 걸쳐 과매수 또는 과매도 수준에 도달하여 최근에 가격이 크게 밀리고 있으므로 곧 철회 또는 반전이 예정되어 있음을 나타내는 훌륭한 지표입니다. 2. 하나의 기간(당신이 가장 선호하는 거래)과 여러 RSI 수준을 사용하여 해당 기간에 RSI 확장의 강도를 보여줍니다. 이것은 가격이 너무 오랫동안 한 방향으로 매우 세게 밀렸고 시장이 차익실현을 해야 할 때 평균 회귀 거래를 취하기 위한 훌륭한 전략입니다. 예시 스크린샷에서 H4 RSI가 25레벨을 넘어 2쌍으로 확장된 것을 볼 수 있습니다. 이는 일반적인 가격 조치보다 훨씬 더 멀리 있기 때문에 매수할 좋은 기회입니다
Stratos Pali
Michela Russo
Stratos Pali Indicator   is a revolutionary tool designed to enhance your trading strategy by accurately identifying market trends. This sophisticated indicator uses a unique algorithm to generate a complete histogram, which records when the trend is Long or Short. When a trend reversal occurs, an arrow appears, indicating the new direction of the trend. Important Information Revealed Leave a review and contact me via mql5 message to receive My Top 5 set files for Stratos Pali at no cost! D
Gold Channel XAUUSD
Paulo Rocha
5 (2)
Gold Channel is a volatility-based indicator, developed with a specific timing algorithm for the XAUUSD pair, which consists of finding possible corrections in the market. This indicator shows two outer lines, an inner line (retracement line) and an arrow sign, where the theory of the channel is to help identify overbought and oversold conditions in the market. The market price will generally fall between the boundaries of the channel. If prices touch or move outside the channel it is a tra
M1 Arrow
Oleg Rodin
4.73 (15)
시장의 두 가지 기본 원칙에 기반한 일중 전략. 알고리즘은 추가 필터를 사용하여 거래량 및 가격 파동 분석을 기반으로 합니다. 지표의 지능형 알고리즘은 두 가지 시장 요인이 하나로 결합될 때만 신호를 제공합니다. 지표는 더 높은 시간 프레임의 데이터를 사용하여 M1 차트에서 특정 범위의 파도를 계산합니다. 그리고 파동을 확인하기 위해 지표는 볼륨 분석을 사용합니다. 이 표시기는 준비된 거래 시스템입니다. 트레이더가 필요로 하는 모든 것은 신호를 따르는 것입니다. 또한 지표는 자신의 거래 시스템의 기초가 될 수 있습니다. 거래는 분 차트에서만 수행됩니다. 지표가 MTF 원리를 사용한다는 사실에도 불구하고 지표 알고리즘은 가능한 한 안정적입니다. 구매 후 반드시 저에게 편지를 보내주세요! 내 거래 설정 및 권장 사항을 공유하겠습니다!
Bomb Bank Signal
Igor Pereira Calil
5 (1)
폭탄 은행 신호: MetaTrader 4의 신뢰도 지표 Bomb Bank Signal은 금융 시장에서 가장 관련성이 높은 추세를 식별하도록 설계된 MetaTrader 4의 강력한 지표입니다. 움직임을 정확하게 예측하는 도구를 찾고 있다면 Bomb Bank가 바로 여러분에게 필요한 동맹입니다. 작동 방식: 이 지표는 거래량 분석, 양초 종가, 대칭 추세 등 세 가지 방법을 결합하여 매수 및 매도 기회를 감지하고 신호를 보냅니다. Bomb Bank는 매수 기회를 포착할 때는 '폭탄'과 같고, 매도 신호를 감지할 때에는 '해골'과 같습니다. 폭탄 은행은 왜 다른가요? 완전한 신뢰성: 폭탄 은행 신호는 신호를 제거하지 않습니다. 일단 신호가 발행되면 그 신호는 계속 유지되므로 기회를 절대 놓치지 않습니다. 극도의 정확성: Bomb Bank는 잘못된 신호를 보내지 않습니다. 시장이 발전함에 따라 조정하면서 실시간으로 업데이트하지만 이전 신호의 투명성은 유지합니다. 실시간
Advanced Supply Demand
Bernhard Schweigert
4.91 (294)
현재 33% 할인! 초보자나 전문 트레이더를 위한 최고의 솔루션! 이 보조지표는 우리가 다수의 독창적 기능과 새로운 공식을 통합한 독특하고 고품질이며 저렴한 거래 도구입니다. 이 업데이트를 통해 이중 시간대를 표시할 수 있습니다. 더 높은 TF를 표시할 수 있을 뿐만 아니라 차트 TF와 더 높은 TF 모두를 표시할 수 있습니다: 중첩 영역 표시. 모든 Supply Demand 트레이더들이 좋아할 것입니다. :) 중요한 정보 공개 Advanced Supply Demand의 잠재력을 극대화하려면 다음을 방문하십시오. https://www.mql5.com/ko/blogs/post/720245   진입 또는 목표의 명확한 트리거 포인트를 정확히 찾아냄으로 해서 거래가 어떻게 개선될지 상상해 보십시오. 새로운 알고리즘을 기반으로 매수자와 매도자 간의 잠재적인 불균형을 훨씬 더 쉽게 분간할 수 있습니다. 왜냐하면 가장 강한 공급영역과 가장 강한 수요 영역과 과거에 어떻게 진행 되었는지를(이
제작자의 제품 더 보기
Trade Assistant 38 in 1
Makarii Gubaydullin
4.89 (18)
다기능 도구: 로트 계산기, 가격 조치, R/R 비율, 무역 관리자, 공급 및 수요 영역을 포함한 65개 이상의 기능 데모 버전   |   사용자 매뉴얼   |   MT5 버전 이 유틸리티는 전략 테스터에서 작동하지 않습니다.   여기에서 데모   버전을 다운로드하여 제품을 테스트할 수 있습니다. Contact me   질문/개선 아이디어가 있는 경우/버그가 발견된 경우   저에게 연락 하십시오. 거래 프로세스를 간소화, 가속화 및 자동화하십시오. 이 대시보드로 표준 터미널 기능을 확장하십시오. 유틸리티는 외환, 주식, 지수, 암호화폐 등 모든 거래 수단에서 작동합니다. 1. 새로운 거래 열기 : 로트/리스크/RR 계산: 1. Lot 계산기 (리스크 규모에 따른 거래량 계산) 2. 리스크 계산기 (로트 규모에 따른 리스크 금액) 3. 위험/보상 비율(RR) 4. 주문에 대한 활성화 트리거 + StopLimit 구매 / StopLimit 판매 5. 가상 SL / TP 레벨
Trade Assistant Pro 36 in 1
Makarii Gubaydullin
4.95 (19)
다기능 도구: 로트 계산기, 가격 조치, R/R 비율, 무역 관리자, 공급 및 수요 영역을 포함한 65개 이상의 기능 데모 버전   |   사용자 매뉴얼   |   MT5 버전 이 유틸리티는 전략 테스터에서 작동하지 않습니다. 여기에서 데모 버전을 다운로드하여 제품을 테스트할 수 있습니다. Contact me   질문/개선 아이디어가 있는 경우/버그가 발견된 경우 저에게 연락 하십시오. 거래 프로세스를 간소화, 가속화 및 자동화하십시오. 이 대시보드로 표준 터미널 기능을 확장하십시오. 유틸리티는 외환, 주식, 지수, 암호화폐 등 모든 거래 수단에서 작동합니다. 1. 새로운 거래 열기 : 로트/리스크/RR 계산: 1. Lot 계산기 (리스크 규모에 따른 거래량 계산) 2. 리스크 계산기 (로트 규모에 따른 리스크 금액) 3. 위험/보상 비율(RR) 4. 주문에 대한 활성화 트리거 + StopLimit 구매 / StopLimit 판매 5. 가상 SL / TP 레벨 (숨겨진 SL
Lines of risk
Makarii Gubaydullin
The indicator displays the   specified Risk Level   on the chart, for long and short positions. My   #1 Utility : includes 65+ functions  |   Contact me  if you have any questions It may be useful when setting the Stop Loss level, the value of which is visible on the right price axis. To calculate the level of risk, a   Fixed  / or   Last used   lot size is used. Imput Settings: Last traded lot:  set " true " to make the calculation for your last used   trading lot; Lot Size: set the value of t
Swap and Spread
Makarii Gubaydullin
초당 업데이트와 함께 현재 시장 정보를 표시합니다. 확산 크기; 스왑 크기:짧은 위치와 긴 위치의 경우; 현지 시간(선택 사항); 내#1 조수: 38+기능을 포함| 당신은 질문이있는 경우 저에게 연락 표시기의 설정에서 구성 할 수 있습니다: 글자크기; 텍스트 색상; 위치 선택:차트의 왼쪽/오른쪽 모서리; 현지 시간:온/오프; 프로그램 파일은"표시기"디렉토리에 배치해야합니다. .......................................................................................................................................
FREE
Volume Profile Pro
Makarii Gubaydullin
5 (1)
Visualization of the trade deals, distributed by price levels. You can set any period for calculation: between 2 vertical lines, or set a fixed time interval. The histogram levels are relative: a wider bar means more trading volume. Distribution extremes can be used as a support and resistance levels. All styles, sizes and colors are customizable. My  #1 Utility : includes 65+ functions  |   Contact me  if you have any questions  |  MT4 version In the settings of the indicator, you can config
Informer for calculating the results of open trades. My   #1 Utility : includes 65+ functions  |   Contact me  if you have any questions The information panel groups open orders into 2 categories: Buys Sells For each category, the symbol and the current number of pips are displayed. The total result for all open trades is shown below. Notifications can be enabled or disabled by simply clicking on the button: When the notification is enabled, you will know when the profit on any symbol has excee
Timer Countdown
Makarii Gubaydullin
5 (2)
Countdown timer till the bar closure, + % Progress status:  My   #1 Utility :   includes 65+ functions  |   Contact me  if you have any questions In the settings of the indicator, you can configure: Timeframe for Calulculation; true / false:   Higher TimeFrame option (next from the currently used: M15->M30, H4->D1...) Position: 1 = Bottom Left corner; 2 = Bottom Right corner; 3 = Top Left corner; 4 = Top Right corner; Font Size; Color; Font Style;
FREE
The indicator displays the levels that are extremes for the specified time frames. Resistance level is the maximum price of the last closed bar; Support level is the minimum price of the last closed bar; My   #1 Utility : includes 65+ functions  |   Contact me  if you have any questions 2 operating modes: Real bodies:  Open and Close prices will be used; Extremes:  High and Low prices will be used; This indicator: Helps to see potential reversal levels; Patterns formed near the levels have mo
Spread and Swap
Makarii Gubaydullin
5 (1)
초당 업데이트와 함께 현재 시장 정보를 표시합니다. 확산 크기; 스왑 크기:짧은 위치와 긴 위치의 경우; 현지 시간(선택 사항); 내#1 조수: 38+기능을 포함| 당신은 질문이있는 경우 저에게 연락 표시기의 설정에서 구성 할 수 있습니다: 글자크기; 텍스트 색상; 위치 선택:차트의 왼쪽/오른쪽 모서리; 현지 시간:온/오프; 프로그램 파일은"표시기"디렉토리에 배치해야합니다. .......................................................................................................................................
FREE
Countdown timer till the bar closure, + % Progress status:  My   #1 Utility :   includes 65+ functions  |   Contact me  if you have any questions In the settings of the indicator, you can configure: Timeframe for Calulculation; true / false: Higher TimeFrame option (next from the currently used: M15->M30, H4->D1...) Position: 1 = Bottom Left corner; 2 = Bottom Right corner; 3 = Top Left corner; 4 = Top Right corner; Font Size; Color; Font Style;
FREE
Lot Size Calc
Makarii Gubaydullin
Quickly find the lot size  directly in the terminal , to comply with risk management. My   #1 Utility : includes 65+ functions  |   Contact me  if you have any questions it works on any trading instruments: Forex, Stocks, Futures, Indices, CFD, Bonds, Cryptocurrencies; interface minimization function; flexibility of use; money management; It is especially useful for short-term traders, when they need to act  quickly . For calculation it is necessary to specify 2 parameters: The size of the ris
Price Action Pro
Makarii Gubaydullin
The indicator displays the most important Price Action Patterns that indicate a potential reversal / continuation of the trend. My   #1 Utility : includes 65+ functions  |   Contact me  if you have any questions Avaliable Patterns: Pin bar; Engulfing; Inside bar (Harami); Morning star; Evening star; Dark Cloud Cover; Piercing Line; Features: You can   select patterns   to display and disable unnecessary patterns; Notifications : alerts in the terminal, Email and Push-notifications (to the mobil
Fibonacci Auto Drawing
Makarii Gubaydullin
Automatically draws Fibonacci levels, basen on the last closed bar of the specified time frame. My   #1 Utility : includes 65+ functions  |   Contact me  if you have any questions helps to see potential reversal levels; patterns formed near the levels have more potential; significantly saves time spent on manual level plotting; Adjustable parameters: The time frame used to plot the levels; Personalization of Fibonacci levels: main correction levels + extension levels; Line color, line width an
The indicator shows the operating time of the world exchanges. Help you to see which markets are currently most active. My   #1 Utility : includes 65+ functions  |   Contact me  if you have any questions Helps to select the most volatile instruments at the moment; Especially useful for an intraday traders; 1) When using on time frames 1H and below: the lines will correspond to the actual location of the bars on the chart, and when moving the chart, the lines of the trading sessions will move
Shows the direction of the bars on all major timeframes. My #1 Utility : 65+ functions   |   Version for MT5 The meaning of the visual signals ( squares): Red : Close price is  lower  than the Open price: Close < Open;  Green : Close price is  higher  than the Open price: Close > Open; Blue : Close price is  equal  to the Open price: Close = Open; You can set the Shift of the calculated bar, relative to the current bar: Shift = 0: the direction of the currenttly open (floating) bars, Shift
Indicators 14 in 1
Makarii Gubaydullin
5 (1)
14 Indicators and auxiliary tools for convenient trading This utility contains 14 additional tools that can be useful for certain actions of the trader,   thereby simplifying and speeding up the trading process. My   #1 Utility : includes 65+ functions  |   Contact me  if you have any questions Due to the different monitor resolutions, some users may encounter the fact that the labels will be displayed with an overlay or be too small. If you encounter such a problem, you can adjust the font size
Daily Pips Target
Makarii Gubaydullin
Informer for tracking daily trading results. My   #1 Utility : includes 65+ functions  |   Contact me  if you have any questions In the upper part of the panel, you set the daily profit target (in pips): Manually entering a value; Using the + and - buttons (the change step can be configured in the settings); The dashboard then groups trades into 2 categories: Current floating result; Summing up closed trades; The final result is displayed at the bottom: achievement or non-achievement of your da
Gap indicator
Makarii Gubaydullin
Displays the appearance of a gap on the chart (when the closing price of the previous bar differs from the opening price of the new bar). My   #1 Utility:  includes 65+ functions  |   Contact me  if you have any questions In the initial settings you can configure: The size of the gap (in points): only gaps that exceed this value will be displayed. Arrow color : separate for up and down gaps. When you hover the mouse over the gap arrows on the chart, their size will be displayed ; I recommend ch
Market information and detailed statistics: analysis of volatility and price bars. My   #1 Utility : includes 65+ functions  |   Contact me  if you have any questions Specify any currency pair/trading instrument to get information: Market information: Current spread; Swap for long positions (buys); Swap for short positions (sells); Select a time frame and number of periods to analyze price changes: Average volatility; Maximum volatility; Minimum volatility; Maximum price; Minimum price; Numb
Market watch list
Makarii Gubaydullin
Monitor your favorite Symbols My   #1 Utility:  includes 65+ functions, including this tool  |   Contact me  if you have any questions This tool opens in a separate window: it can be moved (drag anywhere), and minimized [v]. You can adjust the Watchlist on the panel: Click [edit list] to add / remove the Symbols from the Watchlist. Calculated value: it may either be the last [closed bar], or the current [floating bar]. Select the [timeframe] for calculation. There are 2 types of the value sorti
Multi Timeframe
Makarii Gubaydullin
The indicator helps you analyze 3 different Time Intervals on a single screen to see the overall price action. My   #1 Utility : includes 65+ functions  |   Contact me  if you have any questions In the initial settings you can configure: TimeFrame 1; TimeFrame 2; TimeFrame 3; The number of bars to be shown; Colors of bullish and bearish bars; My other products: Indicators: 14 in  1
Trade statistics
Makarii Gubaydullin
Detailed statistics of your trading for the selected period My   #1 Utility : includes 65+ functions  |   Contact me  if you have any questions Statistics display modes: For the  selected   currency pair/trading instrument Statistics for  all trades   (" ALL ") You can select the period for which you want to get statistics: 1 day 1 week 1 month 2   months 3   months 6   months 1 year 2 years All trading history Displayed information:  Gross profit Gross loss Total profit/loss Number of trade
Alert Levels PRO
Makarii Gubaydullin
Utility for setting notifications when a given price level is reached. My   #1 Utility : includes 65+ functions  |   Contact me  if you have any questions The alert can be set in three ways: Manual entry of the price level; Setting the price change: in percent / in pips / in market points; By moving the level with the mouse: there is also a magnet function, when activated, the level will snap to the nearest OHLC values; Optionally, you can enable / disable each type of alert: Notifications in t
Manage trades
Makarii Gubaydullin
Management of active and pending orders: automatic breakeven, TP/SL changes, partial / full closing, visual display of levels on the chart My   #1 Utility : includes 54+ functions  |   Contact me  if you have any questions Ex4  file must be located in the "Experts" directory! Auto Trading   must be activated ! 1) Main window: to manage orders, you can set a specific symbol [Symbol], or select all symbols [ALL] Close all active positions [ALL] Close all profitable trades [profits] Close all loos
Detailed statistics of your trading for the selected period My   #1 Utility : includes 65+ functions  |   Contact me  if you have any questions The utility includes 2 separate tools: Trade Statistics WeekDays Analyzer Statistics display modes: For the selected  currency pair/trading instrument Statistics for all trades   (" ALL ") You can select the period for which you want to get statistics: 1 day 1 week 1 month 2   months 3   months 6   months 1 year 2 years All trading history 1. Trade Stat
Future bar
Makarii Gubaydullin
The indicator shows the currently forming candle of the selected time frame My   #1 Utility : includes 65+ functions  |   Contact me  if you have any questions Due to the different monitor resolutions, some users may encounter the fact that the Countdown label will be too small/big. If you encounter such a problem, you can  adjust the font size:  the 4th parameter in the input variables. 1) In the settings, when activating the indicator, s elect the timeframe   that will be used to display the f
Profit/loss statistics for each day of the week on which the trade was opened My   #1 Utility : includes 65+ functions  |   Contact me  if you have any questions Statistics display modes: For the    selected   currency pair/trading instrument Statistics for    all trades   (" ALL ") You can select the period for which you want to get statistics: 1 day 1 week 1 month 2   months 3   months 6   months 1 year 2 years All trading history Displayed information:  You will see statistics for each day of
Multi TF Charts
Makarii Gubaydullin
Analyze up to 3 additional charts of other timeframes , without switching the main chart. My   #1 Utility : includes 65+ functions  |   Contact me  if you have any questions The indicator opens in a  separate window: The window   can be moved   to any place on the chart (using the   [<M>]   button). The window can also be minimized to save space ( [ <^>]  button) In the window that appears, you can configure: The period   of the 1st chart (left); The period   of the 2nd chart (center); The peri
Money Meter
Makarii Gubaydullin
The indicator displays the levels of potential profit/loss for each direction (buy and sell). My   #1 Utility : includes 65+ functions  |   Contact me  if you have any questions You can set:  Lot size (there is also an option to auto-set the last used lot); Grid step : percentage / amount of money (green switch); Number of levels for each direction; Risk calculation for the current account balance / or for the free margin; In the initial settings of the indicator, you can select: Color of lines
EurUsd Scalper PRO
Makarii Gubaydullin
Short-term scalper Currency pair: EURUSD; Timeframe: 5 minutes. My   #1 Utility : includes 65+ functions  |   Contact me  if you have any questions Since the EA works on a low timeframe, it is important to use a broker where the typical spread on EURUSD does not exceed 2 . A higher spread can significantly affect the results. The strategy is based on the idea of long-term stability. The results attached in the screenshots are a backtest from 1999.
필터:
리뷰 없음
리뷰 답변
버전 1.20 2021.06.13
Added the option to receive an alert when the desired bar occurs;

Added the option to select a color to indicate the size of the bars;