Impulse Angle MT5
- 지표
- 버전: 9.300
- 업데이트됨: 30 9월 2020
- 활성화: 5

Description
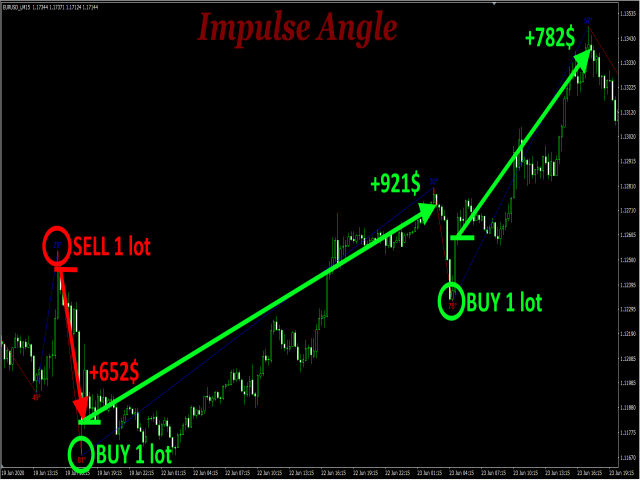
Range Detector is an indicator that identifies impulses in the market and displays their slope angles on the chart.
Recommendations
You can use this indicator to determine a trend and, accordingly, to determine the direction of opening a position or closing an opposite position.
Parameters
===== _INDICATOR_SETTINGS_ ===== - indicator settings
Maximum History Bars - maximum number of history bars for calculating the indicator. Average True Range Period - ATR indicator period (used to calculate the difference between moving averages). Fast Moving Period - period of the fast moving average. Slow Moving Period - period of the slow moving average.
===== _GRAPHICS_SETTINGS_ ===== - graphics settings
Up-Impulse Lines Color - color of up-impulse lines.
Down-Impulse Lines Color - color of down-impulse lines.
Impulse Lines Width - width of impulse lines.
Impulse Lines Style - style of impulse lines.
===== _NOTIFICATIONS_SETTINGS_ ===== - notifications settings
Push Notification - allow push notification.
E-Mail Notification - allow e-mail notification.
Notification Minimum Angle - minimum angle for notification.