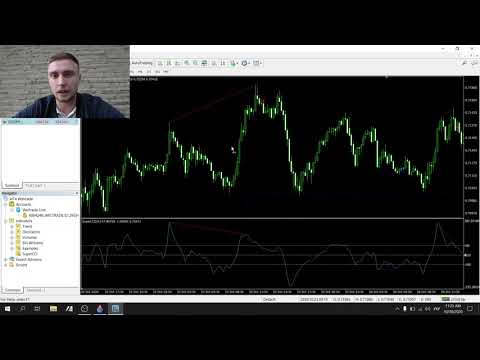
SuperCCI MT5
- 지표
- 버전: 12.30
- 업데이트됨: 3 12월 2020
- 활성화: 5

Description
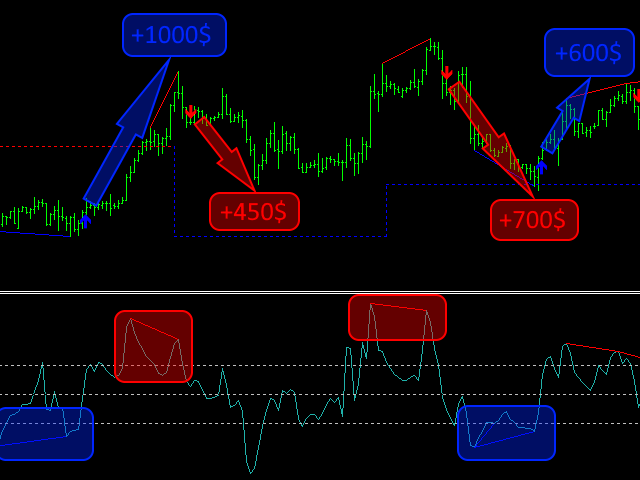
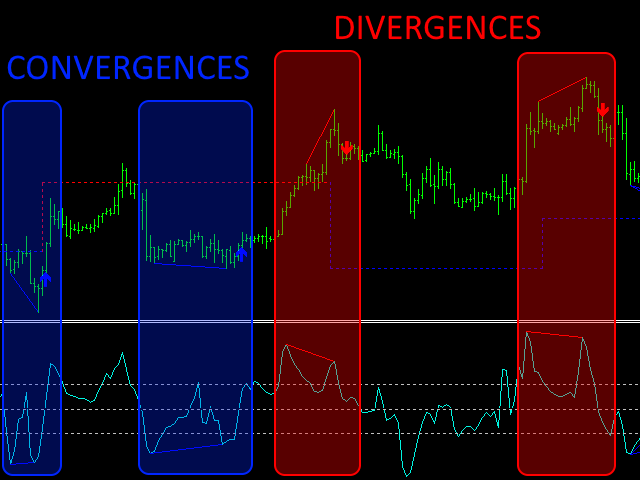
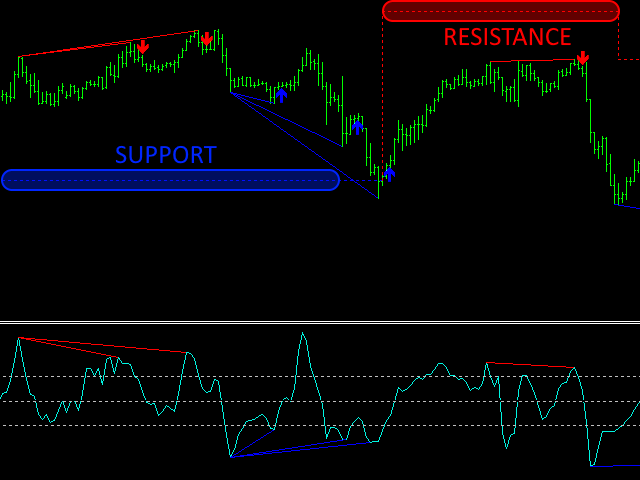
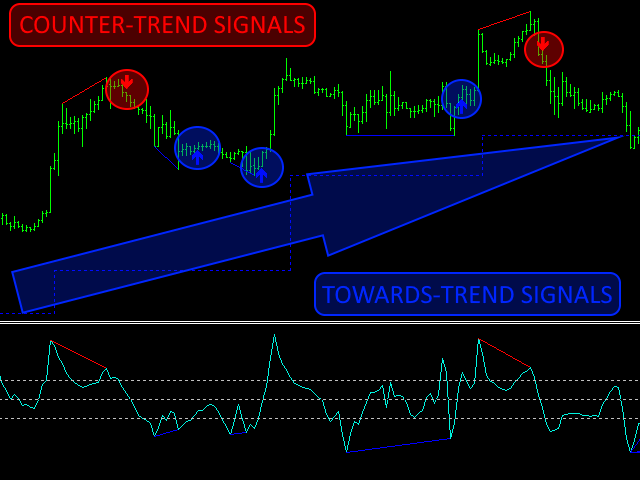
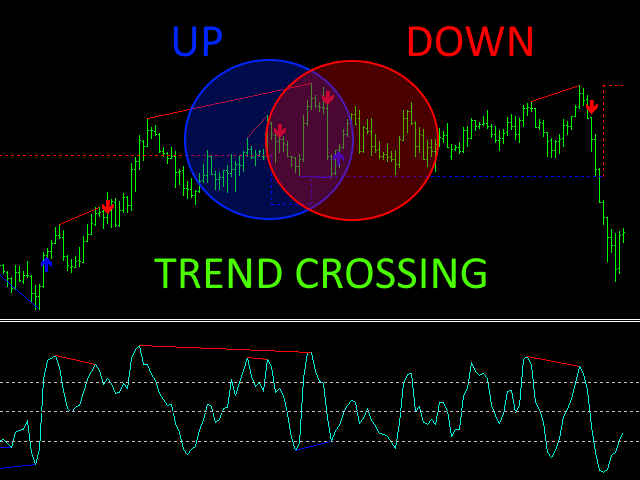
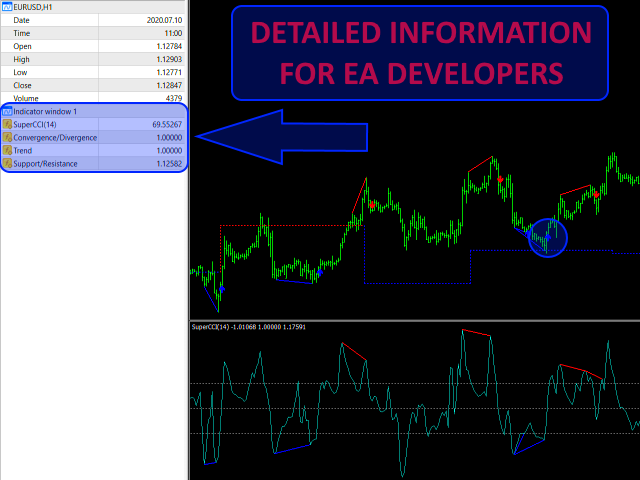
SuperCCI is an indicator based on the standard CCI indicator. It identifies and displays convergences/divergences in the market and forms the corresponding entry points. Also, using the trading channel index, it determines the direction of the trend and displays the levels of support and resistance.
Features
- Not repaint.
- Shows entry points.
- Shows the direction of the current trend and support/resistance levels.
- Has notifications.
Recommendations
Use convergence/divergence to identify market entry points and support/resistance levels to identify trend and profit/loss fixing points.
Parameters
_INDICATOR_SETTINGS_ - indicator settings. Maximum History Bars - maximum count of history bars to calculate.
CCI Period - period of CCI indicator.
CCI Convergence/Divergence +-Levels - levels of convergence/divergence.
CCI Support/Resistance Level - level of support/resistance.
CCI Impulse Level - level of impulse.
CCI Correction Level - level of correction.
Impulse/Correction Ratio - ration between impulse and correction.
_GRAPHICS_SETTINGS_ - graphics settings.
Convergence Lines Color - color of convergence lines.
Divergence Lines Color - color of divergence lines.
Convergence/Divergence Lines Width - width of convergence/divergence lines.
Convergence/Divergence Lines Style - style of convergence/divergence lines.
Support Lines Color - color of support lines.
Resistance Lines Color - color of resistance lines.
Support/Resistance Lines Width - with of support/resistance lines.
Support/Resistance Lines Style - style of support/resistance lines.
_NOTIFICATIONS_SETTINGS_ - notifications settings.
Alert Notification - allow alert notifications.
Push Notification - allow push notifications.
E-Mail Notification - allow e-mail notifications.