Intelligent Moving MT4
- 지표
- 버전: 2.2
- 업데이트됨: 9 10월 2024
- 활성화: 5

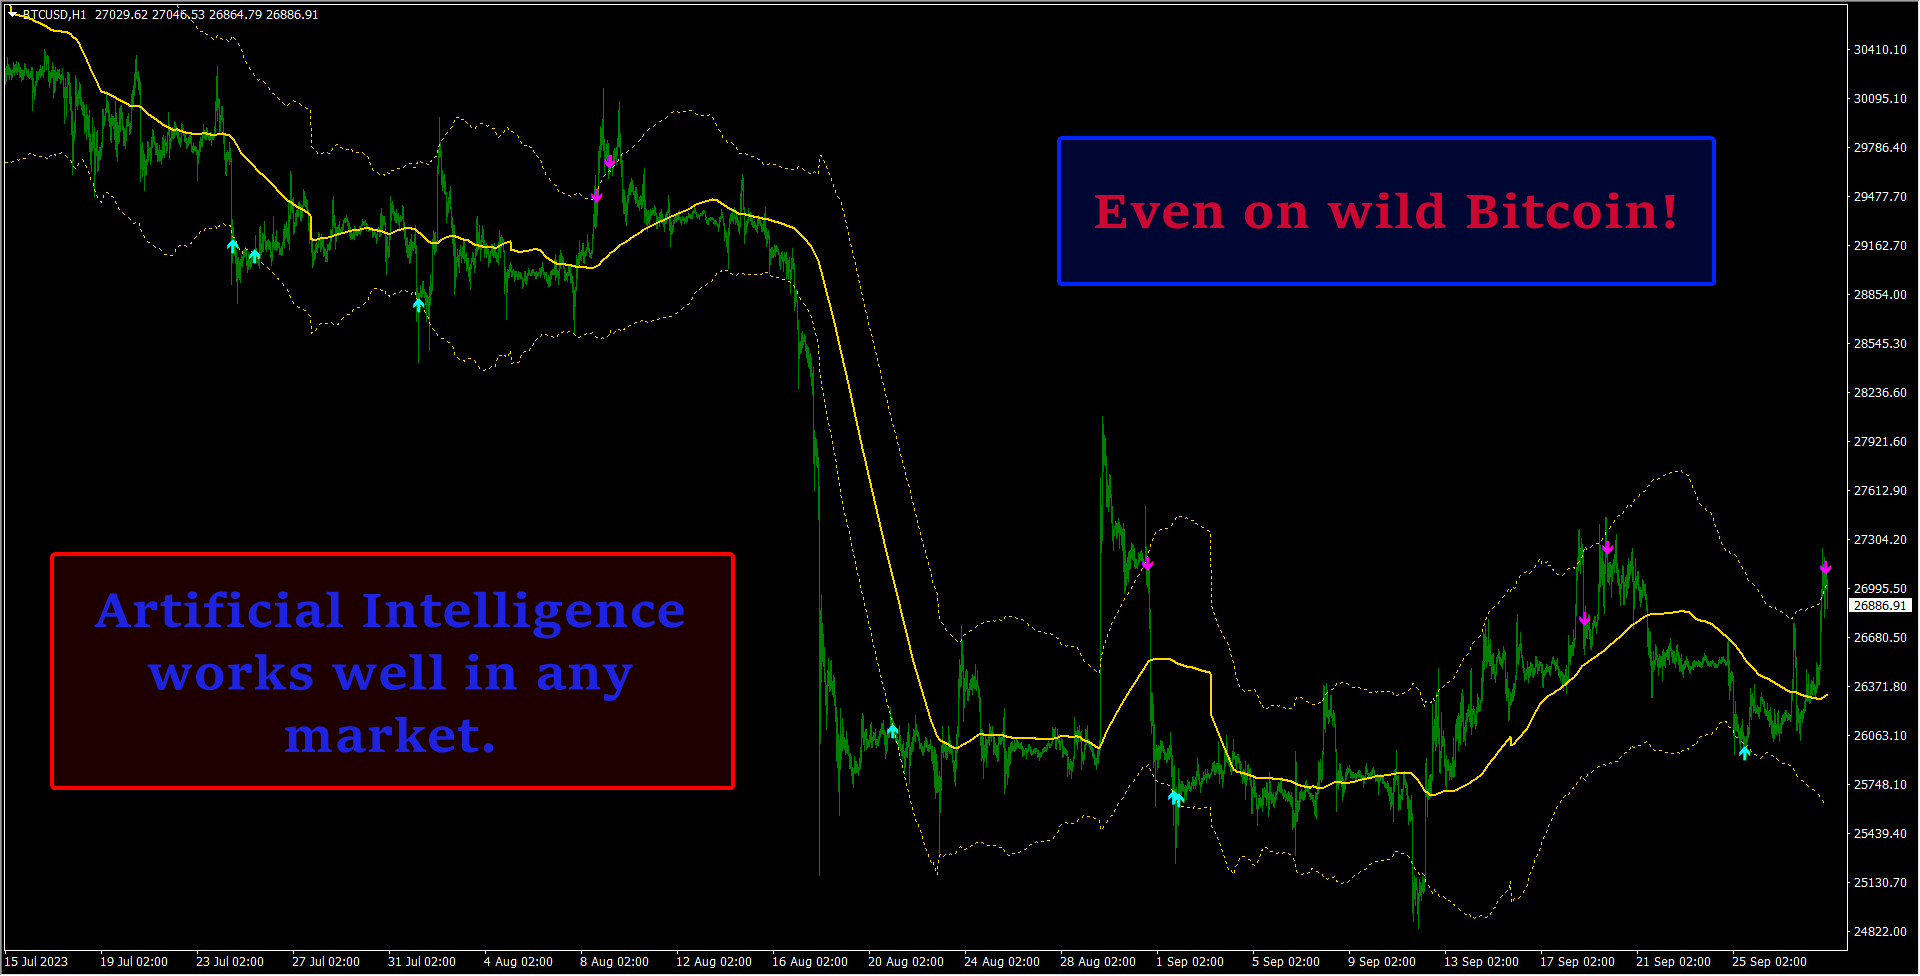
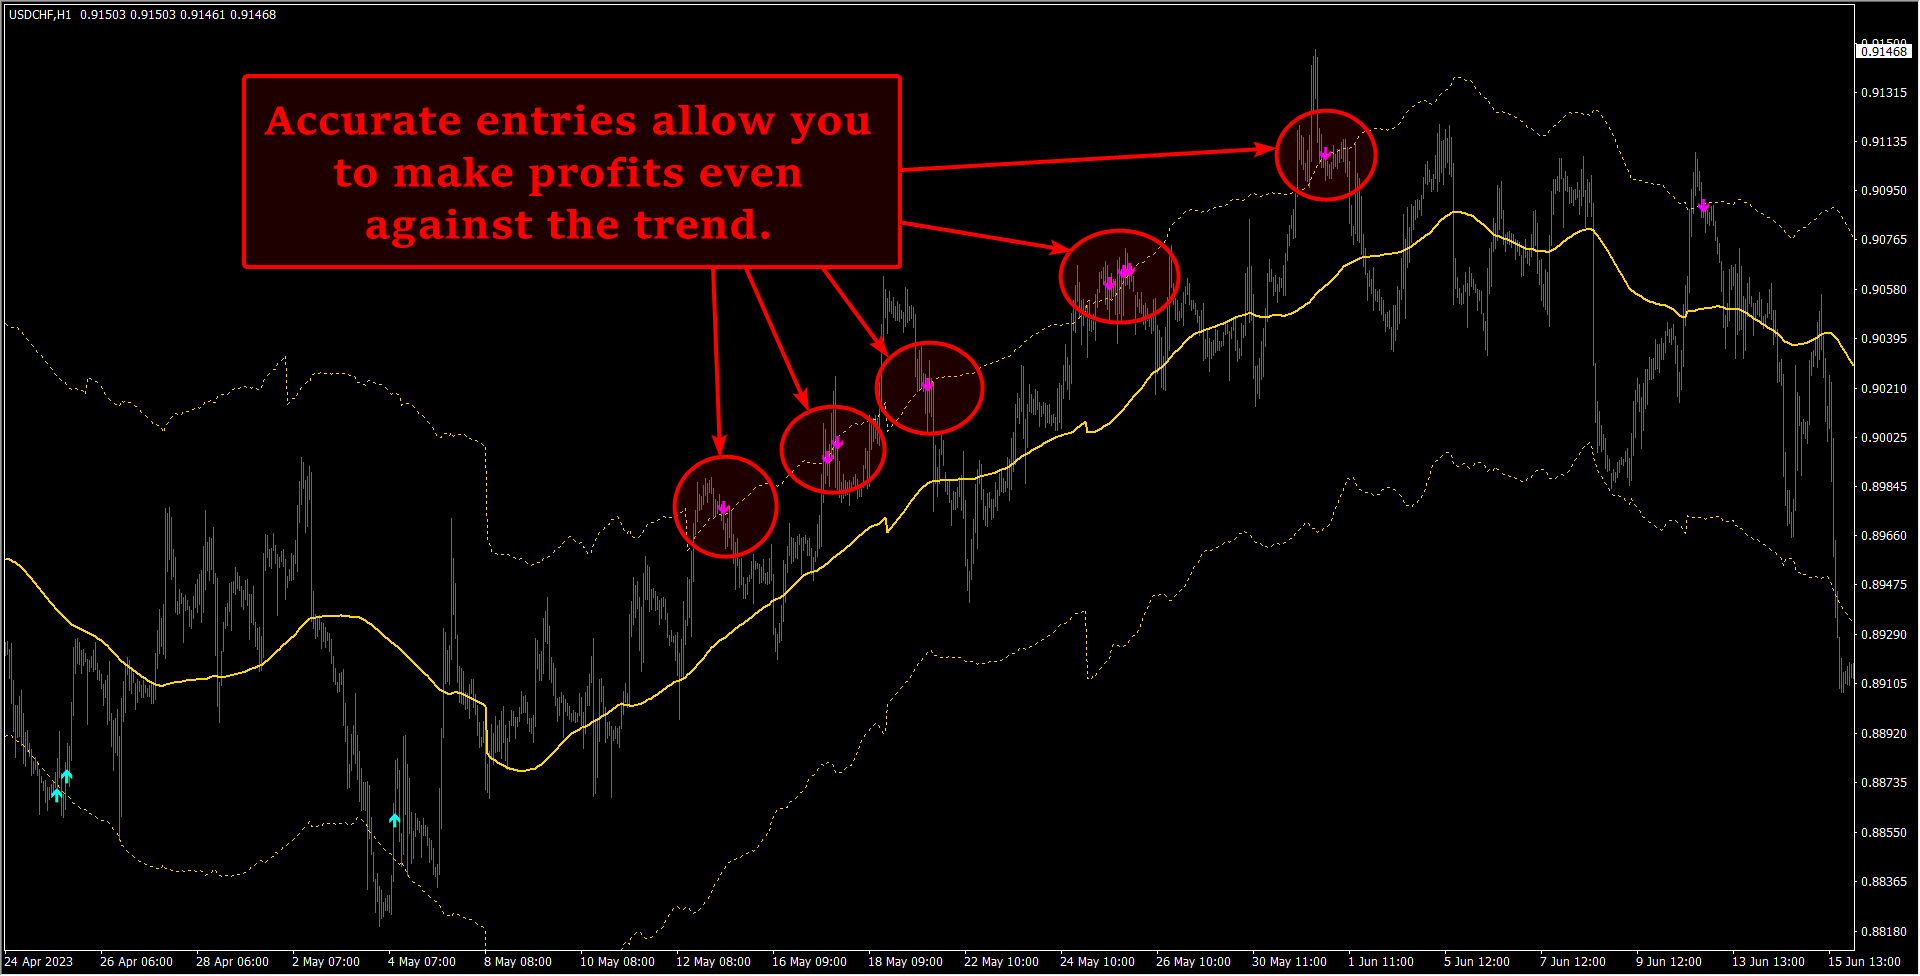
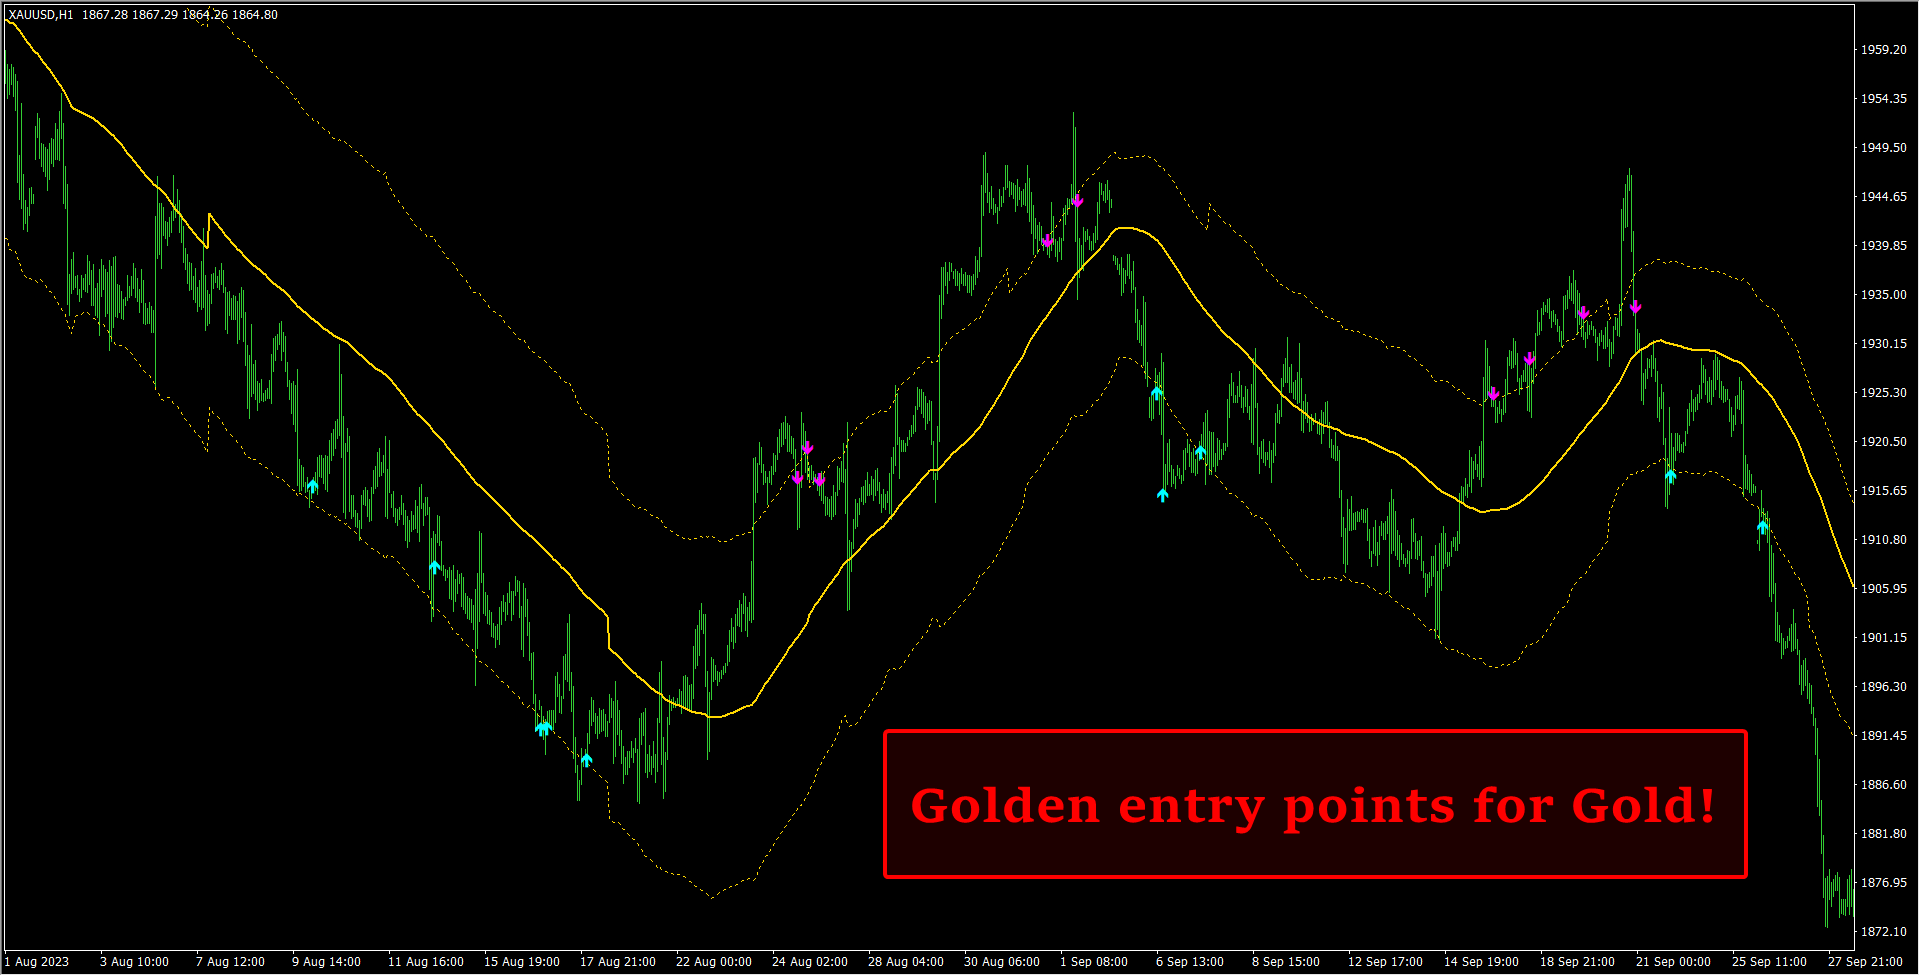
Let us introduce you to a new era of neural indicators for financial markets! Intelligent Moving is a unique indicator that trains its neural network in real time! You no longer need to look for the optimal indicator parameters for each specific situation. No more late signals. The artificial intelligence is able to adapt itself and predict any market movements.
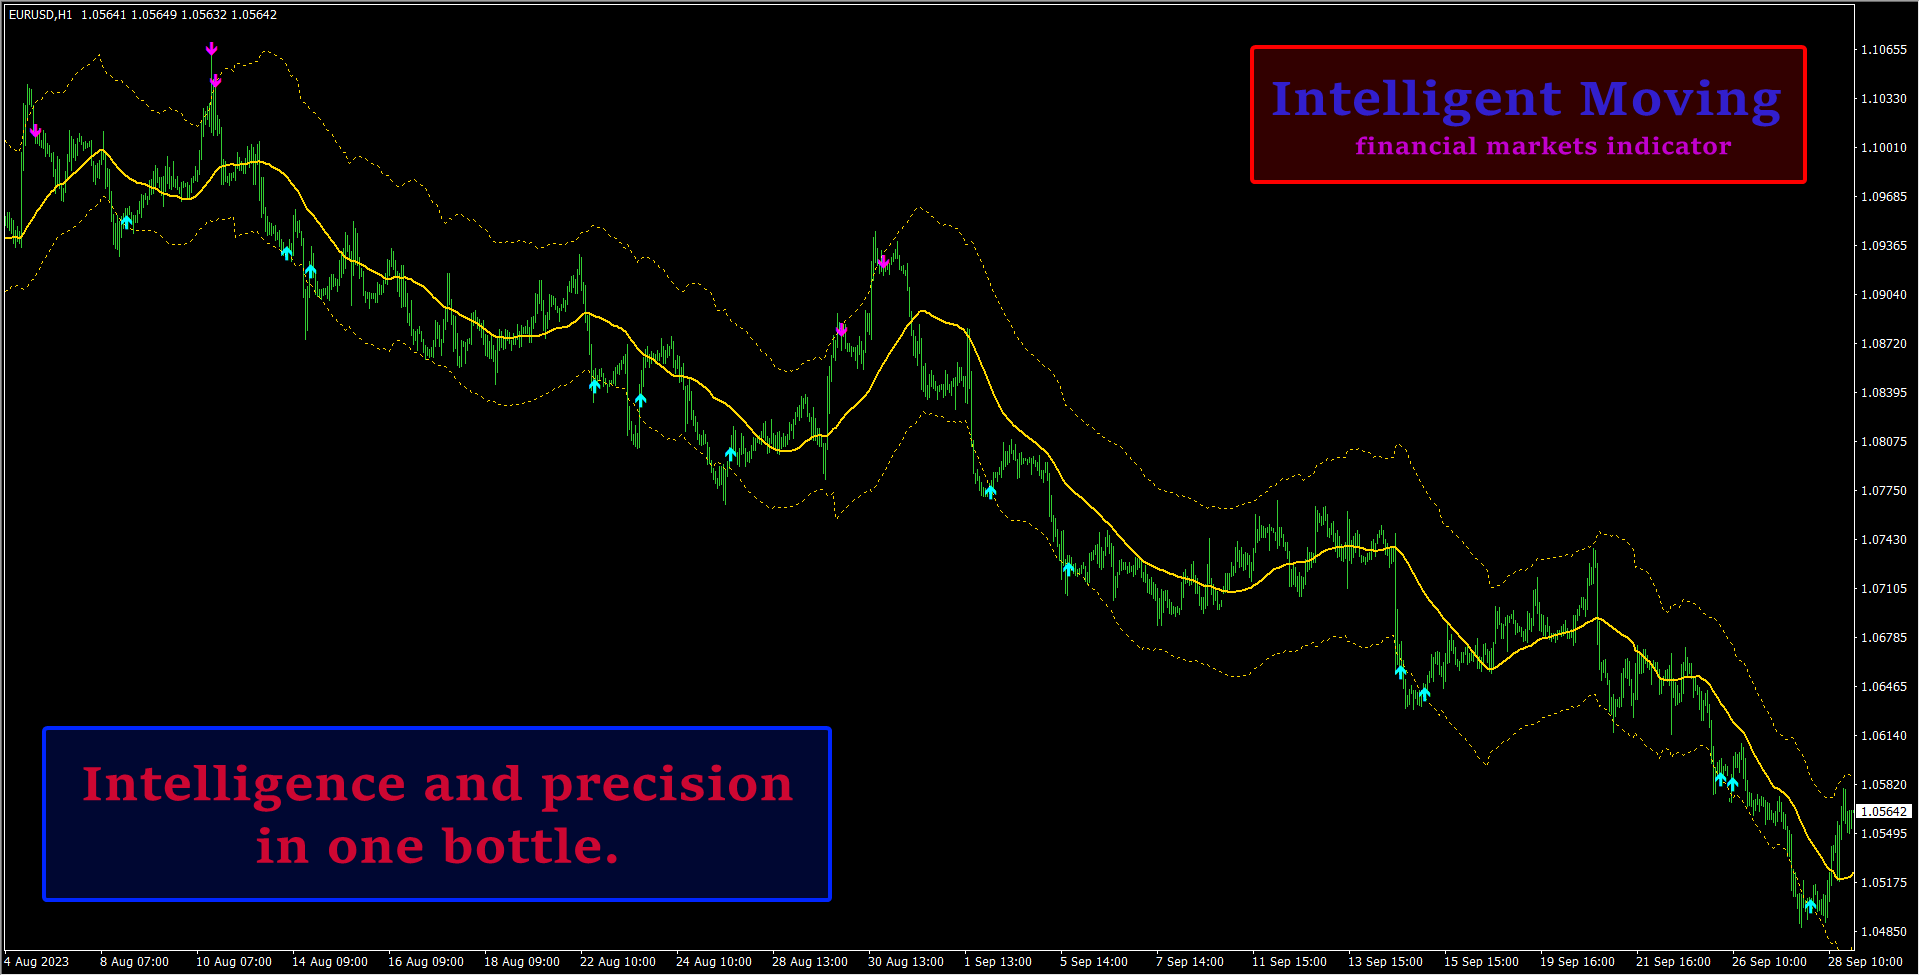
Visually, the indicator is drawn as a main solid moving average line, two dotted lines of standard deviations and signal arrows. For analysis and prediction, it uses a single-layer feed-forward neural network built into its code. Moving average periods and mean square deviation values are used as training parameters. The artificial intelligence learns in real time to determine the best points for opening positions at extremes, which are formed when the price goes beyond the deviations and returns to the average.
Attention! At the first launch on the chart, the indicator neural network performs initial collection of historical data and general training. Due to this, the MetaTrader terminal may work slowly for some time. It all depends on the computing power of your processor and the the configured input settings.
=== RATES HISTORY CALCULATIONS === - Calculation of historical bars settings.
Calculate History From Bar Shift - History bar number from which the indicator calculation begins.
Calculate History From Bar DateTime - Date/time of the history bar from which the indicator calculation begins.
=== IM NEUROLEARNING PERIODS === - Settings for moving average periods for neurolearning.
Neurolearning Periods Type - Search type for the next best moving average period: NEUROLEARNING_PERIODS_BASE - relative to the base period (set in the Neurolearning Periods Base parameter), NEUROLEARNING_PERIODS_LAST - relative to the last selected best period.
Neurolearning Periods Base - The base value of the moving average period from which neurolearning and selection of the next best periods will be carried out.
Neurolearning Periods Step - Minimum step to find the next best moving average period in neurolearning.
Neurolearning Periods Passes - Number of passes to find the next best moving average period relative to the previous one.
=== IM NEUROLEARNING DEVIATIONS === - Settings for standard deviations of moving averages for neurolearning.
Neurolearning Deviations Type - Search type for the next best standard deviation of the moving average: NEUROLEARNING_PERIODS_BASE - relative to the base deviation (set in the Neurolearning Deviations Base parameter), NEUROLEARNING_DEVIATIONS_LAST - relative to the last selected best deviation.
Neurolearning Deviations Base - The base value of the standard deviation of the moving average, from which the next best deviations will be trained and selected.
Neurolearning Deviations Step - Minimum step to find the next best standard deviation of the moving average in neurolearning.
Neurolearning Periods Passes - Number of passes to find the next best standard deviation of the moving average relative to the previous one.
=== IM NEUROLEARNING RATES === - Rates settings for neurolearning.
Neurolearning Rates Depth (bars) - Depth of historical data (number of bars) for the neurolearning test sample.
Neurolearning Rates Interval (bars) - Interval (number of bars) with which the neural network will be retrained.
Neurolearning Rates Spread (pips) - Virtual price spread for maximum adjustment of neurolearning parameters to market conditions.
=== IM NOTIFICATIONS === - Notification settings.
Send Alert - Notifications in a terminal.
Send Push Notification - Push notifications to a mobile terminal.
Send E-Mail - Alerts by email.