Range Detector
- 지표
- 버전: 7.30
- 활성화: 5

Description
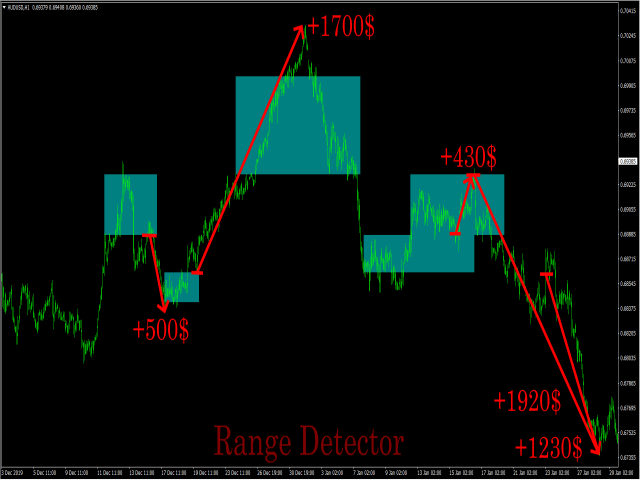
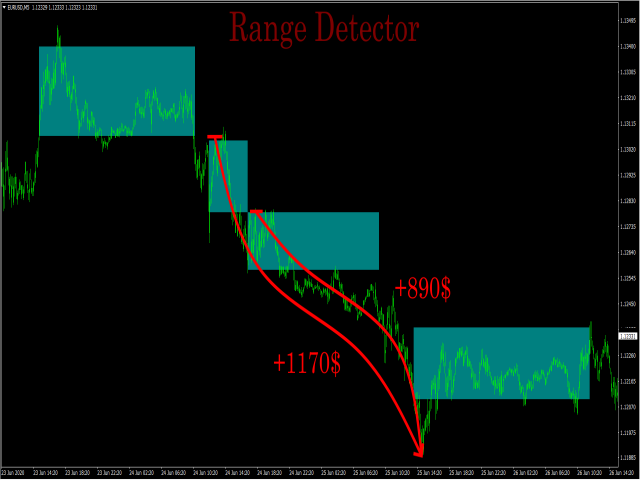
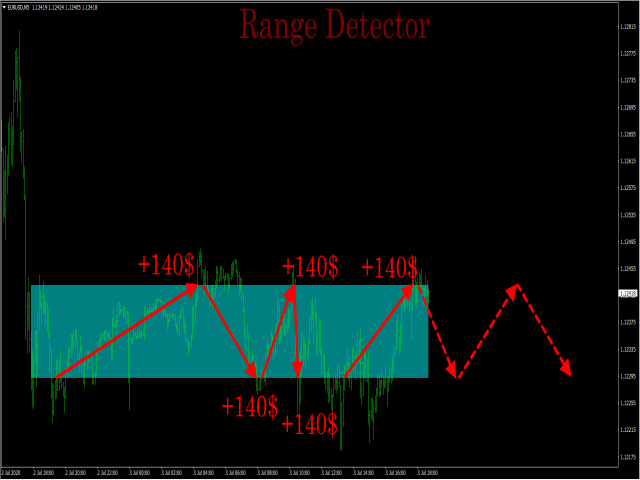
Range Detector is an indicator that identifies ranges in the market and displays their presence on the price chart.
Recommendations
You can use this indicator to determine the flet and, accordingly, to determine the direction of opening a position or closing an opposite position.
Parameters
Maximum History Bars - maximum number of history bars for calculating the indicator.
Average True Range Period - ATR indicator period (used to calculate the difference between moving averages).
Fast Moving Period - period of the fast moving average.
Slow Moving Period - period of the slow moving average.
Movings Difference - minimum difference between moving averages (for searching impulses) expressed in the number of ATR-values.
Ranges Color - color of ranges.