AIS Optimal Duration Transaction
- 유틸리티
- 버전: 1.0

This script is designed so that the trader can determine the average duration of trade transactions, at which the ratio of possible profits and losses will be optimal.
First, let's look at the general approach to determining the optimal duration of trade transactions. We introduce the following variables:
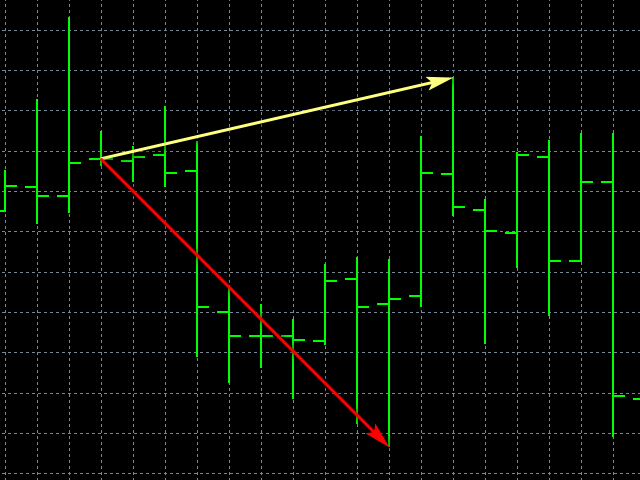
R - the result of the transaction;T - the time during which the transaction was open;W - the time between the closing of the previous transaction and the opening of the next one.
Every trader strives to get the maximum profit in the shortest possible time. This desire can be described by the following simple expression:
R/(T+W)→max.
It is obvious that the variables T and W depend both on the total duration of the trade and on the number of transactions made. Let ATD is the average duration of the transaction, and N is the total number of transactions. Then the average duration of the transaction should grow in proportion to the square root of their total, that is:
ATD~√N.
However, there are well-founded questions that appear - is any transaction duration equivalent to others and how can the duration of transactions affect the results of trading operations? To get answers to the questions raised, we will conduct a small study of the price behavior for historical data.
Let's proceed as follows. We divide the historical data into series consisting of a certain number of bars, corresponding to the average duration of the transaction. In each such series, we calculate the maximum price movement, with the greater deviation we will refer to StopLoss, and the smaller - to TakeProfit.
After that, we will calculate the average ratio of the price range throughout the entire history, and see how it changes depending on the number of bars determining the length of the series.
Script Parameters:
- MTD - the maximum duration of the series;
- OCD - if set to true, then only optimal series sizes will be displayed.
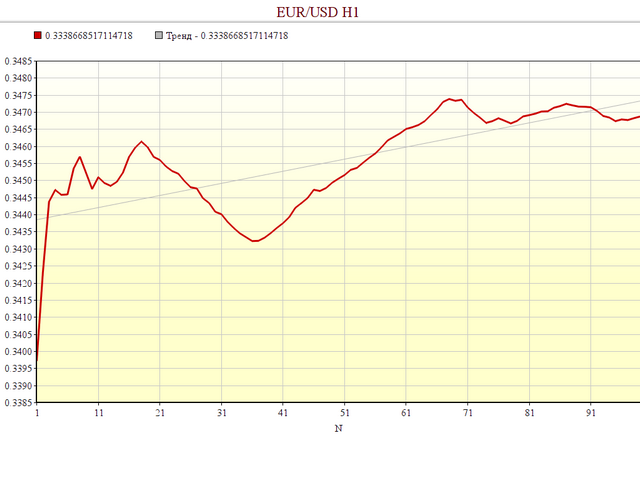
Run the script on the currency pair of interest and the desired time frame, and wait for the completion message. The result of the calculations is saved in the file "AIS-ODT.csv". The first column indicates the length of the series, expressed in bars. The second column displays the average ratio of possible profits and losses for a given currency pair and a given time frame.
From the point of view of trading, the greatest interest is represented by such series lengths at which the ratio of profits to losses reaches a local maximum. If, when developing a trading strategy, a trader will be guided by such duration of trade deals, then he will be able to achieve at least a small advantage.
사용자가 평가에 대한 코멘트를 남기지 않았습니다