Minibull gold vs indices shift ratio edge
- 지표
-
Yusuf Levent Aksun
 플랫폼 엔지니어 & AWS 공인 전문가. 소프트웨어 개발, 클라우드 아키텍처, DevOps 전환 분야에서
20년 이상의 경험 보유.
현재 런던 World Wide Technology에서 플랫폼 엔지니어링 이니셔티브를 주도하며,
확장 가능한 인프라 솔루션을 구축하고 개발팀이 더 빠르고 안정적으로 제품을 출시할 수 있도록 지원.
🔹 AWS Certified Solutions Architect – Professional
🔹 AWS Certified DevOps Engineer – Professional - 버전: 19.0
- 업데이트됨: 20 2월 2026
- 활성화: 5
BullBOP13 — 밸런스 오브 파워 | 금 vs 미국 지수
BullBOP13은 금(XAUUSD)과 3개 미국 주가지수(NAS100, US500, US30) 간의 일시적 괴리를 감지합니다. 4개 자산 중 3개가 같은 방향으로 움직이고 1개가 반대로 움직이면, 해당 이상치는 반전 경향이 있는 "가짜 움직임"을 경험하고 있습니다.
작동 원리 — 4단계 신호 필터:
1. 페이즈 필터 — D1 타임프레임 시장 체제 분석 (정렬 / 발산 / 강한 발산)
2. 가짜 움직임 감지 — 3대1 규칙: 3개 자산 일치, 1개 이탈 = 신호 발생
3. 비율 반전 — 금/지수 비율의 EMA + 표준편차 밴드로 괴리 전환 확인
4. 가격 확인 — 가짜 무버의 MA 이탈도가 감소 중이어야 함
4단계 모두 동시에 일치할 때만 신호 생성.
기능:
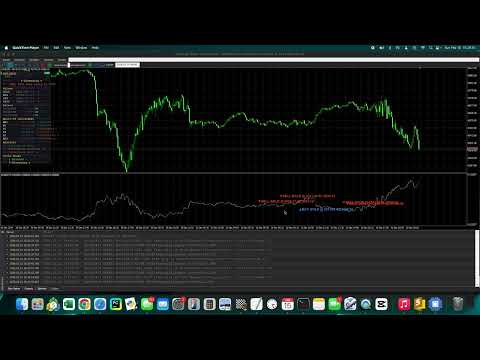
• 서브윈도우 비율 차트 (EMA 및 ±1/±2 SD 볼린저 밴드, 색상 코딩)
• 4개 조건 모두 충족 시 BUY/SELL 화살표
• 인터랙티브 패널: 가격, MA 편차, 비율 SD 수준, 6타임프레임 페이즈 분석 (MN1→M30)
• 비율 선택기: 금/NDX, 금/SPX, 금/US30 뷰
• 자동 시장 코멘터리 (거시 / 중기 / 단기)
• 접이식 패널 — 전체 대시보드 또는 컴팩트 모드
• 7단계 브로커 범용 심볼 감지 — 모든 명명 규칙 호환
• 우아한 저하 — 심볼 누락 시에도 충돌 없음
• 푸시 + 이메일 알림
• 리페인팅 없음 — 모든 4개 조건은 마감된 봉에서만 평가 (shift=1)
신호 품질 (동반 EA 백테스트로 검증):
• 포워드 테스트 (2025.09→2026.02): M5 승률 61.5%, H1 56.3%
• BUY 신호가 SELL보다 우수 (67% vs 55% 승률)
• 급격한 변위 시 최고 성능
요구사항:
• 브로커가 XAUUSD + NAS100 + US500 + US30 제공 필수
• 모든 차트/타임프레임에서 작동