Display Stochastic System

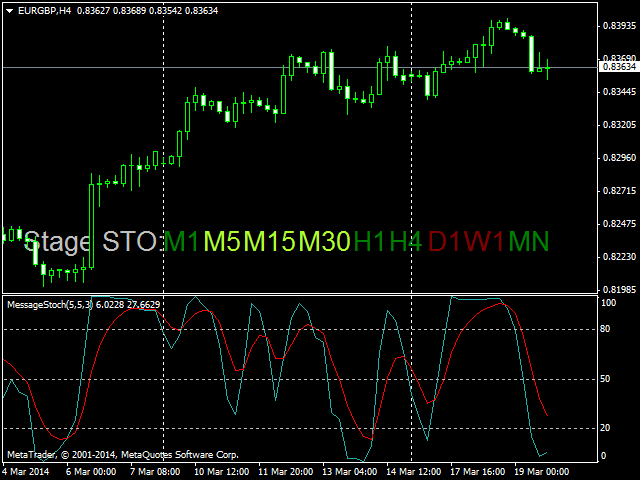
The Display Stochastic System indicator for the MetaTrader 4 trading platform (see description (in Russian)) is compactly sized for a chart window, while displaying Stochastic indicator results for all time frames in a single window. Parameters for each time frame are set separately. Font size, corner and color can be set according to your preferences. By default, a buy signal is green and a sell signal is red. The overbought market is dark red (prepare to sell -> wait for the red color). The oversold market is dark green (prepare to buy -> wait for the green color). It should best be used together with the Display ADX System indicator because when the ADX is trending, it is recommended to ignore Stochastic signals.

Good luck in trading!

추천 제품
Alpha Trend sign has been a very popular trading tool in our company for a long time. It can verify our trading system and clearly indicate trading signals, and the signals will not drift. Main functions: Based on the market display of active areas, indicators can be used to intuitively determine whether the current market trend belongs to a trend market or a volatile market. And enter the market according to the indicator arrows, with green arrows indicating buy and red arrows indicating se
Auto Fibo Pro m
DMITRII GRIDASOV
"Auto FIBO Pro" Crypto_Forex 지표 - 거래에 유용한 보조 도구입니다! - 지표는 자동으로 Fibo 수준과 로컬 추세선(빨간색)을 계산하여 차트에 배치합니다. - Fibonacci 수준은 가격이 반전될 수 있는 주요 영역을 나타냅니다. - 가장 중요한 수준은 23.6%, 38.2%, 50%, 61.8%입니다. - 역전 스캘핑이나 존 그리드 거래에 사용할 수 있습니다. - Auto FIBO Pro 지표를 사용하여 현재 시스템을 개선할 수 있는 기회도 많습니다. - Info Spread Swap Display가 있습니다. 현재 Spread와 Swap이 부착된 외환 쌍을 표시합니다. - 디스플레이에는 계정 잔액, 자본 및 마진도 표시됩니다. - 차트의 어느 모서리에서나 Info Spread Swap Display를 찾을 수 있습니다. 0 - 왼쪽 상단 모서리, 1 - 오른쪽 상단, 2 - 왼쪽 하단, 3 - 오른쪽 하단. 여기를 클릭하여 고품질 트레이딩 로봇과
PABT Pattern Indicator - it's classical system one of the signal patterns. Indicator logic - the Hi & Lo of the bar is fully within the range of the preceding bar, look to trade them as pullback in trend. In the way if indicator found PABT pattern it's drawing two lines and arrow what showing trend way.  - First line - it's entry point and drawing at: 1. On the high of signal bar or on middle of the signal bar (depending from indicator mode) for buy; 2. On the low of signal bar or on middle of t
Rainbow Price Visualizer
Vincent Jose Proenca
Rainbow Price Visualizer v1.21 See where the market really breathes. Turns your MT4 chart into an ultra-precise heatmap that highlights price zones favored by big players. Why it matters 300 price levels at 0.2‑pip resolution — microscopic detail. 8 visual themes (Rainbow, Fire, Ocean…) for instant readibility. Smart opacity: low noise fades, real zones pop. Lightweight rendering with automatic cleanup. Fully customizable: saturation, opacity, resolution, history depth. Bands project into the f
MACD Divergence
Sergey Deev
2.5 (2)
The indicator detects divergence signals - the divergences between the price peaks and the MACD oscillator values. The signals are displayed as arrows in the additional window and are maintained by the messages in a pop-up window, e-mails and push-notifications. The conditions which formed the signal are displayed by lines on the chart and in the indicator window. Indicator Parameters MacdFast - fast MACD line period MacdSlow - slow MACD line period MacdSignal - MACD signal line period MacdPric
VR Cub
Vladimir Pastushak
VR Cub 은 고품질 진입점을 얻는 지표입니다. 이 지표는 수학적 계산을 용이하게 하고 포지션 진입점 검색을 단순화하기 위해 개발되었습니다. 지표가 작성된 거래 전략은 수년 동안 그 효율성을 입증해 왔습니다. 거래 전략의 단순성은 초보 거래자라도 성공적으로 거래할 수 있다는 큰 장점입니다. VR Cub은 포지션 개시 지점과 이익 실현 및 손절매 목표 수준을 계산하여 효율성과 사용 편의성을 크게 높입니다. 간단한 거래 규칙을 이해하려면 아래 전략을 사용한 거래 스크린샷을 살펴보세요. 설정, 세트 파일, 데모 버전, 지침, 문제 해결 등은 다음에서 얻을 수 있습니다. [블로그] 다음에서 리뷰를 읽거나 작성할 수 있습니다. [링크] 버전 [MetaTrader 5] 진입점 계산 규칙 포지션 개설 진입점을 계산하려면 VR Cub 도구를 마지막 최고점에서 마지막 최저점까지 늘려야 합니다. 첫 번째 지점이 두 번째 지점보다 빠른 경우, 거래자는 막대가 중간선 위에서 마감될 때까지 기다립니다
Crypto_Forex 지표 HTF Ichimoku for MT4. - Ichimoku 지표는 가장 강력한 트렌드 지표 중 하나입니다. HTF는 - Higher Time Frame을 의미합니다. - 이 지표는 트렌드 트레이더와 가격 액션 항목과의 조합에 탁월합니다. - HTF Ichimoku 지표를 사용하면 더 높은 타임프레임의 Ichimoku를 현재 차트에 첨부할 수 있습니다. - 상승 추세 - 파란색 선 위에 빨간색 선(두 선 모두 클라우드 위에 있음) / 하락 추세 - 파란색 선 아래에 빨간색 선(두 선 모두 클라우드 아래에 있음). - 가격이 Ichimoku 클라우드 상단 테두리를 돌파했을 때만 BUY 주문을 엽니다. - 가격이 Ichimoku 클라우드 하단 테두리를 돌파했을 때만 SELL 주문을 엽니다. - HTF Ichimoku 지표는 큰 트렌드를 포착할 수 있는 기회를 제공합니다. 여기를 클릭하여 고품질 트레이딩 로봇과 지표를 확인하세요! 이 MQL5 웹사이트에서만
Laser Trend
Nicolas Zouein
The trend is your friend! This is what this indicator is all about. Follow this famous saying and be safe. Characteristics: Buy/Sell signals fixed on the close of a bar. Works on all symbols and all timeframes. Clear visual market trend laser line, Buy/Sell signal arrows, market strength meter, TP1 & TP2 boxes. Visual signals when to enter, when to exit the market. No repainting. Compatible with Flexible EA for trading automation. (Ask for a free set file optimized to perform 2010-2018) Parame
Trendiness Index
Libertas LLC
5 (3)
"The trend is your friend" is one of the best known sayings in investing, because capturing large trendy price movements can be extremely profitable. However, trading with the trend is often easier said than done, because many indicators are based on price reversals not trends. These aren't very effective at identifying trendy periods, or predicting whether trends will continue. We developed the Trendiness Index to help address this problem by indicating the strength and direction of price trend
The indicator detects and displays 3 Drives harmonic pattern (see the screenshot). The pattern is plotted by the extreme values of the ZigZag indicator (included in the resources, no need to install). After detecting the pattern, the indicator notifies of that by a pop-up window, a mobile notification and an email. The indicator highlights the process of the pattern formation and not just the complete pattern. In the former case, it is displayed in the contour triangles. After the pattern is com
Wave Wolf MT4
Andrei Salanevich
거래 단말기의 현재 창에 늑대 파도를 검색하여 표시하도록 설계되었습니다. 거래에 늑대 파도를 사용하는 상인을위한 훌륭한 지표. 거래 전략에서의 적용은 효율성과 수익성을 크게 증가시킬 것입니다. 표시기에 대한 정보 다른 늑대 웨이브 지표와는 달리,웨이브 고원지 외환 지표는 크게 그 효과를 증가 기능을 가지고 있습니다: 첫 번째는 열린 창 5 점 매개 변수(진정한 값)정보 지원을 제공합니다,즉 늑대 파도가 나타난 차트의 창을 확장합니다. 예를 들어,유로화 차트가 열려 있고 각각에 웨이브 월드 표시기가 설치되어있는 경우 유로화 모델이 감지되면 해당 차트가 자동으로 다른 차트의 맨 위에 포 그라운드로 가져 오므로 많은 상품을 거래 할 때 매우 편리합니다.  두 번째 기능은 맥 디에 내장 된 발산 분석,사용자가 자신을 선택할 수있는 매개 변수(기본 설정(12,26,9))입니다. 그런데 일반적인 오실레이터의 값은 작업 창에 표시되지 않으며 점을 형성 할 때 가격 라벨의 색상에만 반영됩니다
RenkoMaStoch
Sergey Deev
1 (1)
The indicator displays renko bars on a chart, uses them to plot the fast and slow moving average and Stochastic, as well as it provides buy/sell signals: a buy signal is generated when the fast moving is above the slow one, and the signal line of Stochastic crosses the lower level from bottom up; a sell signal is generated when the fast moving is below the slow one, and the signal line of Stochastic crosses the upper level from top to bottom; Renko is a non-trivial price display method. Instead
Trend PA
Mikhail Nazarenko
5 (3)
The Trend PA indicator uses   Price Action   and its own filtering algorithm to determine the trend. This approach helps to accurately determine entry points and the current trend on any timeframe. The indicator uses its own algorithm for analyzing price changes and Price Action. Which gives you the advantage of recognizing, without delay, a new nascent trend with fewer false positives. Trend filtering conditions can be selected in the settings individually for your trading style. The indicator
Infinity Trend Pro
Yaroslav Varankin
1 (1)
This is a trend indicator without redrawing Developed instead of the binary options strategy (by the color of the Martingale candlestick) Also works well in forex trading When to open trades (binary options) A signal will appear in the place with a candle signaling the current candle It is recommended to open a deal for one candle of the current timeframe M1 and M5 When a blue dot appears, open a deal up When a red dot appears, open a trade down. How to open trades on Forex. When a signal is rec
FreqoMeterForecast
Stanislav Korotky
The main idea of this indicator is rates analysis and prediction by Fourier transform. Indicator decomposes exchange rates into main harmonics and calculates their product in future. You may use the indicator as a standalone product, but for better prediction accuracy there is another related indicator - FreqoMaster - which uses FreqoMeterForecast as a backend engine and combines several instances of FreqoMeterForecast for different frequency bands. Parameters: iPeriod - number of bars in the ma
Trade with Gann on your side!! MASTER CIRCLE 360 CIRCLE CHART, originally created by Gann admitted that this is “The Mother of all charts”. It is one of the last studies that this great trader left for us. The numeric tab le is apparently quite simple like all the tables and is based on square numbers, the SQUARE OF 12 and is by evolution, one of the most important square numbers. Here we can find CYCLE, PRICE AND TIME thanks to angles and grades, to show past and future support and resistance.
Distinctive
Tatiana Savkevych
Distinctive is a forex trending arrow indicator for identifying potential entry points. I like it, first of all, because it has a simple mechanism of work, adaptation to all time periods and trading tactics. Created on the basis of a regression channel with filters. Plotting the Lawrence indicator signals on a price function chart using a mathematical approach. How it works - when the price breaks out in the overbought / oversold zone (channel levels), a buy or sell signal is generated. Everyt
Delta Fusion Pro
Francesco Secchi
5 (2)
Delta Fusion Pro – 인트라데이 트레이딩을 위한 고급 주문 흐름 분석 Delta Fusion Pro는 MetaTrader 4용 전문 지표로, 공격적인 주문 흐름을 드러내고 기관 압력의 강도와 방향을 실시간으로 보여줍니다. 기존의 거래량 지표와 달리, Ask와 Bid 거래량 간의 델타를 분석하여 반전 예측, 추세 확인 및 전문 관심 영역을 식별합니다. 주요 특징 지능형 자동 조정 시스템 다음 조건에 따라 모든 매개변수를 자동으로 조정합니다: 상품 유형 (외환, 암호화폐, 지수, 원자재, 주식) 운영 타임프레임 시장 변동성 (ATR) 최근 평균 거래량 초보 트레이더를 위한 수동 설정 없음 – 지표가 자동으로 보정됩니다! 기능 NetDelta 및 누적 델타 Ask/Bid 공격적 거래량 차이 계산, 사용자 지정 EMA 스무딩 실시간 방향 압력 시각화 히스토그램 색상 사용자 지정 (매수/매도) 가격/거래량 다이버전스 일반 및 숨겨진 다이버전스 자동 감지 강도 분류: 강/중/
Simple to read and powerful, no fancy lines and drawings to clutter your chart or distract you. The trend probability oscillator estimates how likely a trend will continue in a certain period. The cummulator period controls how many bars in the past to use and is a proxy for the timescale the trend probability should hold. The use of a Max Line improves this further by indicating when a trend is likely to reverse. In most cases a trend must lose momentum before reversing. Hence, a trend probabil
Line Magnit
Aleksey Trenin
The LineMagnit Indicator for MT4 is a highly precise tool that builds support and resistance levels which magnetically attract prices. This feature allows traders to easily determine the most probable entry and exit points in the market, as well as identify the market's directional forces, as levels are based on capital inflows into the instrument. Equipped with an intuitively understandable graphical interface, the LineMagnit Indicator enables users to quickly locate and analyze support and res
Nice Trade Point
Muhammed Emin Ugur
This    Nice Trade Point     indicator is designed for signal trading. This indicator generates trend signals. It uses many algorithms and indicators to generate this signal. It tries to generate a signal from the points with the highest trend potential. This indicator is a complete trading product. This indicator does not need any additional indicators. The indicator certainly does not repaint. The point at which the signal is given does not change.     Features and Suggestions Time Frame
The   Trendlines Oscillator   helps traders identify trends and momentum based on the normalized distances between the current price and the most recently detected bullish and bearish trend lines. The indicator features bullish and bearish momentum, a signal line with crossings, and multiple smoothing options. USAGE The   Trendlines Oscillator   works by systematically: Identifying pivot highs and lows. Connecting pivots to form bullish (support) and bearish (resistance) trendlines. Measuring
Insider Scalper Binary This tool is designed to trade binary options. for short temporary spends. to make a deal is worth the moment of receiving the signal and only 1 candle if it is m1 then only for a minute and so in accordance with the timeframe. for better results, you need to select well-volatile charts.... recommended currency pairs eur | usd, usd | jpy .... the indicator is already configured, you just have to add it to the chart and trade .... The indicator signals the next candle.
MT4용 Crypto_Forex 지표 "동적 과매수/과매수 구간을 포함하는 CCI" (재도색 불필요) - 상품 채널 지수(CCI)는 추세 방향으로의 모멘텀 트레이딩에 매우 유용합니다. - 동적인 과매수 구간에서 매도 진입을, 동적인 과매도 구간에서 매수 진입을 주요 추세 방향으로 유도하는 데 매우 유용합니다. - 이 지표는 가격 움직임 진입과도 결합하면 매우 유용합니다. - 동적인 과매수 구간 - 노란색 선 위. - 동적인 과매도 구간 - 파란색 선 아래. - CCI 오실레이터는 현재 가격과 과거 평균 가격의 차이를 측정합니다. - PC 및 모바일 알림 기능 제공. Click here to see high quality Trading Robots and Indicators! MQL5 웹사이트에서만 제공되는 오리지널 상품입니다.
NexusSignal Scalping
Vincent Jose Proenca
기술 설명 Nexus Signal System은 MT4용 인디케이터로, 12개의 기술적 기준을 결합하여 거래 신호를 생성합니다. 이 시스템은 신호를 확인하기 전에 여러 요소(추세, 모멘텀, 거래량, 지지/저항 구간)의 컨플루언스를 분석하여, 단일 기준만 사용하는 인디케이터보다 잘못된 신호 발생을 줄입니다. 분석 기준 (점수 0–15): 패턴 감지 (핀바, 엔골핑) 다중 타임프레임 분석 (상위 타임프레임 추세 확인) ADX 시장 상태 (추세 없는 시장 회피) 지지/저항 구간 (자동 스윙 포인트) 이동평균선 20/50/200 (추세 정렬) RSI 14 기간 (모멘텀) 상대 거래량 (기관 확인) ATR (변동성) 기능: 투명한 품질 점수 표시 신호 (0–15) 자동 감지된 지지/저항 구간 차트 표시 예비 신호(현재 캔들) 및 확정 신호(종가 캔들) ATR 기반 손절매(Stop Loss) 및 이익실현(Take Profit) 실시간 시장 정보 대시보드 8가지 색상 테마로 시각적 맞춤 설정 가
Trend Oscillator mw
DMITRII GRIDASOV
Trend Oscillator - 고급 맞춤형 Crypto_Forex 지표, 효율적인 거래 도구입니다! - 고급 새로운 계산 방법 사용 - 매개변수 "계산 가격"에 대한 20가지 옵션. - 지금까지 개발된 가장 매끄러운 오실레이터. - 상승 추세는 녹색, 하락 추세는 빨간색. - 과매도 값: 5 미만, 과매도 값: 95 이상. - 이 지표로 표준 전략도 업그레이드할 수 있는 기회가 많습니다. - PC 및 모바일 알림. ................................................................................................................................................ 여기를 클릭하여 고품질 트레이딩 로봇과 지표를 확인하세요! 이 MQL5 웹사이트에서만 제공되는 오리지널 제품입니다.
Naturu MT4
Ivan Stefanov
“Naturu”는 자연의 대칭성을 알고리즘으로 활용하는 수동 인디케이터입니다. 간단한 전략과 숨겨진 지혜로 시장을 제패하세요! 인디케이터를 로드하면 위(Top)와 아래(Bottom) 두 개의 라인이 표시됩니다. 라인을 한 번 클릭해 활성화한 후, 이동하고 싶은 캔들 위를 클릭하면 그 위치로 이동합니다. 사용자가 고점과 저점을 지정하면, 인디케이터가 자동으로 계산합니다: 마젠타 색 영역: 상승(불) 세력과 하락(곰) 세력의 관심이 가장 가까워져서 지지/저항이 될 가능성이 큰 구간 회색 영역: 다음 관심 구간 아쿠아 색 실선: 상승 세력의 목표가 골드 색 실선: 하락 세력의 목표가 수동 인디케이터는 실시간 시장 상황과 개인의 직관에 따라 레벨을 자유롭게 조정할 수 있는 완전한 제어력과 유연성을 제공합니다. 직접 가격 움직임을 분석함으로써 지지·저항과 패턴 형성을 본질적으로 이해할 수 있습니다. 인간의 판단을 통해 자동 시스템이 놓치거나 오해하기 쉬운 ‘노이즈’를 걸러내어 잘못된 신호를
Arriator
Nadiya Mirosh
The Arriator forex indicator algorithm allows you to quickly determine the current trend in the market. The Elephant indicator accompanies long-term trends and can be used without restrictions on instruments or timeframes. This indicator not only helps predict future values, but also generates buy and sell signals. It tracks market trends, ignoring wild swings and market noise around the average price. The indicator implements a type of technical analysis based on the idea of ​​market cyclicalit
Fractal Zig Zag
Mikhail Nazarenko
A   professional version of the ZigZag indicator for visualizing the structure of price movements by fractals. Fractal ZigZag fixes the flaws of the standard version of the ZigZag indicator MT4. It uses Price action and a unique filtering algorithm to determine fractals. Suitable for all types of trading. Ideal for trading according to the WM pattern "Sniper" strategy !!! Features Marks the place of price reversal during the formation of a new fractal with specified parameters. Suitable for al
Price Magnets
Ivan Simonika
Price Magnet — Price Density and Attraction Levels Indicator Price Magnet is a professional analytical tool designed to identify key support and resistance levels based on statistical Price Density. The indicator analyzes a specified historical period and detects price levels where the market spent the most time. These zones act as “magnets,” attracting price action or forming a structural base for potential reversals. Unlike traditional Volume Profile tools, Price Magnet focuses on price-time d
이 제품의 구매자들이 또한 구매함
Gann Made Easy
Oleg Rodin
4.83 (159)
Gann Made Easy 는 mr.의 이론을 사용하여 최고의 거래 원칙을 기반으로 하는 전문적이고 사용하기 쉬운 Forex 거래 시스템입니다. W.D. 간. 이 표시기는 Stop Loss 및 Take Profit Levels를 포함하여 정확한 BUY 및 SELL 신호를 제공합니다. PUSH 알림을 사용하여 이동 중에도 거래할 수 있습니다. 구매 후 거래 방법 안내 및 유용한 추가 지표를 무료로 받으시려면 저에게 연락주세요! 아마도 Gann 거래 방법에 대해 이미 여러 번 들었을 것입니다. 일반적으로 Gann의 이론은 초보자 거래자뿐만 아니라 이미 거래 경험이 있는 사람들에게도 매우 복잡한 것입니다. Gann의 거래 방식은 이론적으로 적용하기 쉽지 않기 때문입니다. 나는 그 지식을 연마하고 Forex 지표에 최고의 원칙을 적용하기 위해 몇 년을 보냈습니다. 표시기는 적용하기가 매우 쉽습니다. 차트에 첨부하고 간단한 거래 권장 사항을 따르기만 하면 됩니다. 지표는 지속적으로 시장 분석
Market Makers
Mohamed Hassan
5 (3)
After purchase, contact me privately to receive 1 month of free testing with EA Forex Proton! This advanced MT4 trading robot automatically executes signals from any MT4 indicator, including Market Makers. The latest version also includes AI integration, allowing each trade signal to be analyzed using Artificial Intelligence. Live Signal with EA Forex Proton: Click here Market Makers is a powerful price action trading system designed to identify high-probability Buy and Sell opportunities based
Scalper Inside PRO
Alexey Minkov
4.74 (69)
12% OFF EASTER SALE An exclusive indicator that utilizes an innovative algorithm to swiftly and accurately determine the market trend. The indicator automatically calculates opening, closing, and profit levels, providing detailed trading statistics. With these features, you can choose the most appropriate trading instrument for the current market conditions. Additionally, you can easily integrate your own arrow indicators into Scalper Inside Pro to quickly evaluate their statistics and profitabi
PRO Renko System
Oleg Rodin
5 (30)
PRO Renko System 은 RENKO 차트 거래를 위해 특별히 고안된 매우 정확한 거래 시스템입니다. 이것은 다양한 거래 상품에 적용될 수있는 보편적 인 시스템입니다. 체계는 효과적으로 당신에게 정확한 반전 신호에 접근을 주는 소위 시장 소음을 중화합니다. 이 표시기는 사용하기가 매우 쉽고 신호 생성을 담당하는 매개 변수가 하나만 있습니다. 당신은 쉽게 당신의 선택의 어떤 무역 계기에 공구를 적응시킬 수 있고 renko 막대기의 크기. 나는 항상 당신이 내 소프트웨어로 수익성있게 거래 할 수 있도록 추가 지원을 제공 할 준비가되어 있습니다! 나는 당신에게 행복하고 수익성있는 거래를 기원합니다! 구매 후 저에게 연락하십시오! 내 렌코 차트 생성기를 보내드립니다. 또한 내 개인 권장 사항 및 시스템의 다른 모듈을 무료로 공유 할 것입니다!
M1 Sniper
Oleg Rodin
5 (20)
M1 SNIPER 는 사용하기 쉬운 거래 지표 시스템입니다. M1 시간대에 맞춰 설계된 화살표 지표입니다. 이 지표는 M1 시간대 스캘핑을 위한 단독 시스템으로 사용할 수 있으며, 기존 거래 시스템의 일부로도 사용할 수 있습니다. 이 거래 시스템은 M1 시간대 거래용으로 특별히 설계되었지만, 다른 시간대에도 사용할 수 있습니다. 원래는 XAUUSD와 BTCUSD 거래를 위해 이 방법을 설계했지만, 다른 시장 거래에도 유용하다는 것을 알게 되었습니다. 이 지표의 신호는 추세 방향과 반대로 거래될 수 있습니다. 저는 지표의 신호를 활용하여 양방향으로 거래할 수 있도록 돕는 특별한 거래 기법을 알려드립니다. 이 방법은 특별한 동적 지지선과 저항선 가격 영역을 활용하는 것을 기반으로 합니다. 구매하시면 M1 SNIPER 화살표 지표를 바로 다운로드하실 수 있습니다. 또한, 아래 스크린샷에 표시된 Apollo Dynamic SR 지표는 M1 SNIPER 도구를 사용하는 모든 사용자에게 무료로
Advanced Supply Demand
Bernhard Schweigert
4.91 (299)
현재 40% 할인! 초보자나 전문 트레이더를 위한 최고의 솔루션! 이 보조지표는 우리가 다수의 독창적 기능과 새로운 공식을 통합한 독특하고 고품질이며 저렴한 거래 도구입니다. 이 업데이트를 통해 이중 시간대를 표시할 수 있습니다. 더 높은 TF를 표시할 수 있을 뿐만 아니라 차트 TF와 더 높은 TF 모두를 표시할 수 있습니다: 중첩 영역 표시. 모든 Supply Demand 트레이더들이 좋아할 것입니다. :) 중요한 정보 공개 Advanced Supply Demand의 잠재력을 극대화하려면 다음을 방문하십시오. https://www.mql5.com/ko/blogs/post/720245   진입 또는 목표의 명확한 트리거 포인트를 정확히 찾아냄으로 해서 거래가 어떻게 개선될지 상상해 보십시오. 새로운 알고리즘을 기반으로 매수자와 매도자 간의 잠재적인 불균형을 훨씬 더 쉽게 분간할 수 있습니다. 왜냐하면 가장 강한 공급영역과 가장 강한 수요 영역과 과거에 어떻게 진행 되었는지를(이전
Volatility Trend System - a trading system that gives signals for entries. The volatility system gives linear and point signals in the direction of the trend, as well as signals to exit it, without redrawing and delays. The trend indicator monitors the direction of the medium-term trend, shows the direction and its change. The signal indicator is based on changes in volatility and shows market entries. The indicator is equipped with several types of alerts. Can be applied to various trading ins
Atomic Analyst
Issam Kassas
5 (4)
우선적으로 언급할 점은이 거래 지표가 다시 그리지 않고 지연되지 않으며 이를 통해 수동 및 로봇 거래 모두에 이상적이라는 점입니다. 사용자 매뉴얼: 설정, 입력 및 전략. Atomic Analyst는 가격의 강도와 모멘텀을 활용하여 시장에서 더 나은 이점을 찾는 PA Price Action Indicator입니다. 고급 필터를 장착하여 잡음과 거짓 신호를 제거하고 거래 잠재력을 높이는 데 도움이 됩니다. 복잡한 지표의 다중 레이어를 사용하여 Atomic Analyst는 차트를 스캔하고 복잡한 수학적 계산을 간단한 신호와 색상으로 변환하여 초보 트레이더가 이해하고 일관된 거래 결정을 내릴 수 있도록합니다. "Atomic Analyst"는 새로운 및 경험이 풍부한 트레이더를위한 종합적인 거래 솔루션입니다. 프리미엄 지표와 최고 수준의 기능을 하나의 거래 전략에 결합하여 모든 종류의 트레이더에 대한 다재다능한 선택지가되었습니다. 인트라데이 거래 및 스캘핑 전략 : 빠르고 정확한 일일
Trend Screener
STE S.S.COMPANY
4.79 (95)
트렌드 표시기, 트렌드 트레이딩 및 필터링을 위한 획기적인 고유 솔루션, 하나의 도구 안에 내장된 모든 중요한 트렌드 기능! Forex, 상품, 암호 화폐, 지수 및 주식과 같은 모든 기호/도구에 사용할 수 있는 100% 다시 칠하지 않는 다중 시간 프레임 및 다중 통화 표시기입니다. 기간 한정 특가: 지원 및 저항 스크리너 지표는 단 100달러에 평생 제공됩니다. (원래 가격 50 달러) (제안 연장) Trend Screener는 차트에 점이 있는 화살표 추세 신호를 제공하는 효율적인 지표 추세 추종 지표입니다. 추세 분석기 표시기에서 사용할 수 있는 기능: 1. 트렌드 스캐너. 2. 최대 이익 분석이 있는 추세선. 3. 추세 통화 강도 측정기. 4. 경고가 있는 추세 반전 점. 5. 경고가 있는 강력한 추세 점. 6. 추세 화살표 Trend Screener Indicator가 있는 일일 분석 예, 일일 신호 성능...등은 여기에서 찾을 수 있습니다.   여기를 클릭하십시오. L
Ultimate Sniper Dashboard
Hispraise Chinedum Abraham
4.82 (22)
299달러로 할인! 추후 가격이 인상될 수 있습니다! 아래 설명을 읽어보세요! Ultimate Sniper Dashboard를 위한 최고의 엔트리 시스템: ULTIMATE DYNAMIC LEVELS. (내 제품을 확인하십시오) Ultimate Sniper Dashboard는 MT4 다중 통화 테스트 제한으로 인해 라이브 시장에서만 작동합니다. Ultimate-Sniper 대시보드를 소개합니다! HA-Sniper와 MA-Sniper를 모두 포함하는 최고의 제품입니다. 그리고 많은 특수 모드. Ultimate Sniper Dashboard는 절대 야수입니다! 초보자 또는 전문가 트레이더를 위한 최고의 솔루션! 다시 움직임을 놓치지 마세요! 단순함과 핍을 좋아하는 트레이더를 위해 특별한 제품을 준비했습니다. 본질적으로 단순한 대시보드는 여러 사용자 지정 알고리즘을 기반으로 28개의 통화 쌍을 살펴보는 모든 작업을 수행합니다. 단 하나의 차트로 전문가처럼 시장을 읽을 수 있습니다. 움직이기
Dynamic Scalper System
Vitalyi Belyh
5 (1)
" Dynamic Scalper System " 지표는 추세 파동 내에서 스캘핑 방식으로 거래하도록 설계되었습니다. 주요 통화쌍 및 금에서 테스트되었으며, 다른 거래 상품과의 호환성이 가능합니다. 추가적인 가격 변동 지원을 통해 추세에 따라 단기 포지션 진입 신호를 제공합니다. 지표의 원리 큰 화살표는 추세 방향을 결정합니다. 작은 화살표 형태의 스캘핑 신호를 생성하는 알고리즘은 추세 파동 내에서 작동합니다. 빨간색 화살표는 상승 방향을, 파란색 화살표는 하락 방향을 나타냅니다. 민감한 가격 변동선은 추세 방향으로 그려지며, 작은 화살표의 신호와 함께 작용합니다. 신호는 다음과 같이 작동합니다. 적절한 시점에 선이 나타나면 진입 신호가 형성되고, 선이 있는 동안 미결제 포지션을 유지하며, 완료되면 거래를 종료합니다. 권장되는 작업 시간대는 M1~H4입니다. 화살표는 현재 캔들에 형성되며, 다음 캔들이 이미 시작되었더라도 이전 캔들의 화살표는 다시 그려지지 않습니다. 입력 매개
Quantum Breakout Indicator PRO
Bogdan Ion Puscasu
4.96 (26)
소개       Quantum Breakout PRO   , 브레이크아웃 존 거래 방식을 변화시키는 획기적인 MQL5 지표! 13년 이상의 거래 경험을 가진 숙련된 트레이더 팀이 개발한   Quantum Breakout PRO는   혁신적이고 역동적인 브레이크아웃 영역 전략으로 거래 여정을 새로운 차원으로 끌어올리도록 설계되었습니다. Quantum Breakout Indicator는 5개의 이익 목표 영역이 있는 브레이크아웃 영역의 신호 화살표와 브레이크아웃 상자를 기반으로 한 손절 제안을 제공합니다. 초보자 거래자와 전문 거래자 모두에게 적합합니다. Quantum EA 채널:       여기를 클릭하세요 MT5 버전 :   여기를 클릭하세요 중요한! 구매 후 설치 매뉴얼을 받으려면 개인 메시지를 보내주십시오. 추천: 기간: M15 통화쌍: GBPJPY, EURJPY, USDJPY,NZDUSD, XAUUSD 계정 유형: 스프레드가 매우 낮은 ECN, Raw 또는 Razo
Scalper Vault
Oleg Rodin
5 (36)
Scalper Vault 는 성공적인 스캘핑에 필요한 모든 것을 제공하는 전문 스캘핑 시스템입니다. 이 표시기는 외환 및 바이너리 옵션 거래자가 사용할 수 있는 완전한 거래 시스템입니다. 권장 시간 프레임은 M5입니다. 시스템은 추세 방향으로 정확한 화살표 신호를 제공합니다. 또한 상단 및 하단 신호와 Gann 시장 수준을 제공합니다.  이 시스템은 사용하기가 매우 쉽습니다. 원하는 시장 지역의 화살표만 따라가면 됩니다. 엑시트는 가격이 적정 수준에 도달하거나 시장의 고점 또는 저점 신호가 나타날 때 수행됩니다.  표시기는 PUSH 알림을 포함한 모든 유형의 경고를 제공합니다. 인디케이터 구매 후 연락주세요. 내 개인 거래 권장 사항과 훌륭한 보너스 지표를 무료로 공유합니다! 나는 당신에게 행복하고 유익한 거래를 기원합니다!
Trend indicator AI
Ramil Minniakhmetov
4.53 (83)
트렌드 인공 지능 지표는 실행 가능한 진입 점 및 반전 경고와 추세 식별을 결합하여 상인의 시장 분석을 향상시킬 훌륭한 도구입니다. 이 표시기는 사용자가 자신감과 정밀도로 외환 시장의 복잡성을 탐색 할 수 있도록 지원합니다 기본 신호 외에도 트렌드 인공 지능 지표는 풀백 또는 되돌림 중에 발생하는 2 차 진입 점을 식별하여 거래자가 기존 트렌드 내에서 가격 수정을 활용할 수 있도록합니다. 중요한 장점: ·작동 4 및 5 *명확한 구매 또는 판매 신호 *다시 칠하지 않습니다 *모든 자산에서 작동 나는 전보 사기에 개 또는 세트를 판매하지 않도록주의. 모든 설정은 블로그에 여기에 무료.  중요! 지침 및 보너스를 얻기 위해 구입 후 즉시 저에게 연락! 진짜 가동 감시는 뿐 아니라 나의 다른 제품 여기에서 찾아낼 수 있습니다: https://www.mql5.com/en/users/mechanic/seller&nbsp ; 설정 및 입력: 모든 자산에 대해 기본 설정을 권
Currency Strength Exotics
Bernhard Schweigert
4.88 (33)
현재 20% 할인! 초보자 또는 전문가 트레이더를 위한 최고의 솔루션! 이 표시기는 Exotic Pairs Commodities, Indexes 또는 Futures와 같은 기호에 대한 통화 강도를 표시하는 데 특화되어 있습니다. 금, 은, 석유, DAX, US30, MXN, TRY, CNH 등의 진정한 통화 강도를 보여주기 위해 9번째 줄에 모든 기호를 추가할 수 있습니다. 이것은 독특하고 고품질이며 저렴한 거래 도구입니다. 우리는 많은 독점 기능과 새로운 공식을 통합했습니다. 새로운 추세 또는 스캘핑 기회의 정확한 트리거 포인트를 정확히 찾아낼 수 있기 때문에 거래가 어떻게 개선될지 상상해 보십시오. 사용 설명서: 여기를 클릭 https://www.mql5.com/en/blogs/post/708876 모든 시간대에 작동합니다. TREND를 빠르게 확인할 수 있습니다! 새로운 기본 알고리즘을 기반으로 설계되어 잠재적인 거래를 더욱 쉽게 식별하고 확인할 수 있습니다. 8개의
Route Lines Prices - 은 가격 방향을 찾는 데 사용되는 지표입니다. 간단한 인터페이스에는 가격 움직임 및 미래 방향 계산을 위한 다양한 알고리즘이 포함되어 있습니다. 이러한 알고리즘에는 사용된 시간대에 따른 변동성 계산 및 가격 평활화 기능이 있습니다. 이 지표는 " Calculating price values " 값을 변경하는 단일 매개변수를 제공합니다. 기본값인 1은 균형 잡힌 자동 계산을 제공하며, 별도의 설정 없이 바로 사용할 수 있습니다. 2에서 500 사이의 값을 수동으로 변경하여 자신만의 거래 시스템에 맞게 지표를 맞춤 설정할 수 있습니다. 이 지표는 M1부터 H4까지의 시간대에서 사용을 권장합니다. 모든 거래 상품에 적용 가능합니다. 신호 화살표는 캔들 종가에 생성되며, 과거 차트에는 다시 그려지지 않습니다. 메인 차트에 동일한 화살표가 표시됩니다. 다양한 유형의 알림을 사용할 수 있으며, 내장된 라인 궤적 카운터는 종가를 기반으로 작동합니다. 이는
현재 40% 할인 ! 초보자 또는 전문가 트레이더를 위한 최고의 솔루션! 이 대시보드 소프트웨어는 28개의 통화 쌍에서 작동합니다. 2가지 주요 지표(Advanced Currency Strength 28 및 Advanced Currency Impulse)를 기반으로 합니다. 전체 Forex 시장에 대한 훌륭한 개요를 제공합니다. 고급 통화 강도 값, 통화 이동 속도 및 모든(9) 시간대의 28 Forex 쌍에 대한 신호를 보여줍니다. 추세 및/또는 스캘핑 기회를 정확히 파악하기 위해 차트의 단일 지표를 사용하여 전체 시장을 볼 수 있을 때 거래가 어떻게 개선될지 상상해 보십시오! 잠재적인 거래를 식별하고 확인하면서 강력한 통화와 약한 통화를 더욱 쉽게 식별할 수 있도록 이 지표에 기능을 내장했습니다. 이 표시기는 통화의 강세 또는 약세가 증가 또는 감소하는지 여부와 모든 시간대에서 수행되는 방식을 그래픽으로 보여줍니다. 추가된 새로운 기능은 현재 시장 조건 변화에 적응하는
Support Resistance screnner
STE S.S.COMPANY
4.95 (37)
Support And Resistance Screener는 하나의 지표 안에 여러 도구를 제공하는 MetaTrader에 대한 하나의 레벨 지표입니다. 사용 가능한 도구는 다음과 같습니다. 1. 시장 구조 스크리너. 2. 완고한 후퇴 영역. 3. 약세 후퇴 영역. 4. 일일 피벗 포인트 5. 주간 피벗 포인트 6. 월간 피벗 포인트 7. 고조파 패턴과 볼륨에 기반한 강력한 지지와 저항. 8. 은행 수준 구역. LIMITED TIME OFFER : HV 지원 및 저항 표시기는 50 $ 및 평생 동안만 사용할 수 있습니다. ( 원래 가격 125$ ) 메타트레이더 백테스터 제한 없이 인디케이터를 사용하시겠습니까? 데모 버전을 다운로드하려면 여기를 클릭하십시오. 주요 특징들 고조파 및 볼륨 알고리즘을 기반으로 하는 강력한 지원 및 저항 영역. Harmonic 및 Volume 알고리즘을 기반으로 한 강세 및 약세 풀백 영역. 시장 구조 스크리너 일간, 주간 및 월간 피벗 포인트. 문서 모
Trend Lines PRO
Roman Podpora
5 (1)
트렌드 라인즈 프로       이 지표는 시장이 실제로 어떤 방향으로 전환되는지 파악하는 데 도움이 됩니다. 실제 추세 반전 지점과 주요 시장 참여자들이 다시 진입하는 지점을 보여줍니다. 보시다시피       BOS 라인       복잡한 설정이나 불필요한 노이즈 없이 더 높은 시간대의 추세 변화와 주요 레벨을 확인할 수 있습니다. 신호는 차트에 다시 그려지지 않고 캔들이 마감된 후에도 계속 표시됩니다. VERSION MT 5   -   RFI LEVELS PRO   표시기   와 결합할 때 최대 잠재력을 발휘합니다. 지표가 보여주는 내용: 실제 변화       추세(BOS 라인) 한 번 신호가 나타나면 그 신호는 계속 유효합니다! 이는 신호를 발생시킨 후 변경될 수 있는 리페인팅 방식의 지표와 중요한 차이점입니다. 리페인팅 방식의 지표는 잠재적으로 자금 손실로 이어질 수 있습니다. 이제 더욱 높은 확률과 정확도로 시장에 진입할 수 있습니다. 또한 화살표가 나타난 후 목표가(익절)
- Real price is 80$ - 40% Discount (It is 49$ now) Contact me for instruction, add group and any questions! - Non-repaint - I just sell my products in Elif Kaya profile, any other websites are stolen old versions, So no any new updates or support. - Lifetime update free Related product:   Bitcoin Expert Introduction The breakout and retest strategy is traded support and resistance levels. it involves price breaking through a previous level.  The break and retest strategy is designed to help tr
Reversal Master
Alexey Minkov
4.8 (15)
12% OFF EASTER SALE The Reversal Master is an indicator for determining the current direction of price movement and reversal points. The indicator will be useful for those who want to see the current market situation better. The indicator can be used as an add-on for ready-made trading systems, or as an independent tool, or to develop your own trading systems. The Reversal Master indicator, to determine the reversal points,  analyzes a lot of conditions since the combined analysis gives a more a
BlueDigitsFx Easy 1 2 3 System
Ziggy Janssen
4.87 (299)
MT5 버전은 여기에서 이용 가능합니다: https://www.mql5.com/en/market/product/50048 텔레그램 채널 & 그룹: https://t.me/bluedigitsfx V.I.P 그룹 접속: 유료 제품 구매 증빙을 메시지로 보내주세요 추천 브로커: https://bit.ly/BlueDigitsFxStarTrader BlueDigitsFx Easy 123 System — MT4용 강력한 반전 및 돌파 감지 시스템 초보자와 전문가 모두를 위한, 시장 구조 변화, 돌파 및 추세 반전을 쉽고 명확하게 감지할 수 있는 올인원 논리 재도색 방지(Non-Repaint) 인디케이터입니다. 이 인디케이터는 "123" 패턴을 따릅니다: 1단계: 잠재적 과매수/과매도 지점에서 큰 화살표로 새로운 고점 또는 저점을 식별 2단계: 구조가 깨졌음을 신호로 보내 추세 반전 가능성을 확인 3단계: 작은 화살표와 지지/저항 점으로 진입 신호를 확정 참고: 큰 화살표는 봉이 종료될
Auto Optimized MFI
Davit Beridze
5 (1)
Auto Optimized MFI 는 자동으로 조정되는 인디케이터로, 과거 데이터를 기반으로 실제 거래 시뮬레이션을 수행하여 시장과 시간 프레임에 가장 적합한 MFI 매수/매도 레벨을 찾아냅니다. 고정된 80/20 기준을 사용하는 기존 MFI와 달리, 실제 가격과 거래량의 움직임에 따라 유연하게 반응합니다. 작동 방식 사용자가 설정한 범위 내의 과거 캔들을 분석하고, MFI 신호를 기반으로 진입 및 청산 시뮬레이션을 실행합니다. 승률, 최대 낙폭(Drawdown), 손절/이익실현 결과 등을 기록하여, 그 데이터를 바탕으로 최적의 MFI 레벨을 일간, 주간 또는 월간 단위로 자동 업데이트합니다. 주요 기능 설정 가능한 MFI 기간 (기본값: 14) 최적화 범위(캔들 수) 조절 가능 매수/매도 레벨 범위 사용자 정의 가능 세밀한 조정을 위한 스텝 크기 설정 최소 수익 목표 설정으로 비효율 전략 필터링 MFI 선 및 신호 화살표의 스타일 사용자 지정 가능 고정된 규칙에 의존하지 않고, 시
이 지표를 구매하면 제 프로페셔널 트레이드 매니저를 무료로 드립니다. 우선 이 거래 시스템이 리페인팅, 리드로잉 및 레이그 인디케이터가 아니라는 점을 강조하는 것이 중요합니다. 이는 수동 및 로봇 거래 모두에 이상적인 것으로 만듭니다. 온라인 강좌, 설명서 및 프리셋 다운로드. "스마트 트렌드 트레이딩 시스템 MT5"은 새로운 및 경험이 풍부한 트레이더를 위해 맞춤형으로 제작된 종합적인 거래 솔루션입니다. 10개 이상의 프리미엄 인디케이터를 결합하고 7개 이상의 견고한 거래 전략을 특징으로 하여 다양한 시장 조건에 대한 다목적 선택이 가능합니다. 트렌드 추종 전략: 효과적인 트렌드 추이를 타기 위한 정확한 진입 및 손절 관리를 제공합니다. 반전 전략: 잠재적인 트렌드 반전을 식별하여 트레이더가 범위 시장을 활용할 수 있게 합니다. 스캘핑 전략: 빠르고 정확한 데이 트레이딩 및 단기 거래를 위해 설계되었습니다. 안정성: 모든 인디케이터가 리페인팅, 리드로잉 및 레이그가 아니므로 신뢰
Dynamic Forex28 Navigator
Bernhard Schweigert
4.43 (7)
Dynamic Forex28 Navigator - 차세대 외환 거래 도구. 현재 49% 할인. Dynamic Forex28 Navigator는 오랫동안 인기 있는 지표의 진화형으로, 세 가지의 힘을 하나로 결합했습니다. 고급 통화 Strength28 지표(695개 리뷰) + 고급 통화 IMPULSE with ALERT(520개 리뷰) + CS28 콤보 신호(보너스). 지표에 대한 자세한 정보 https://www.mql5.com/en/blogs/post/758844 차세대 Strength 지표는 무엇을 제공합니까?  원래 지표에서 좋아했던 모든 것이 새로운 기능과 더 높은 정확도로 강화되었습니다. 주요 기능: 독점적인 통화 Strength 공식.  모든 시간대에 걸쳐 부드럽고 정확한 강도선. 추세와 정확한 진입을 식별하는 데 이상적입니다. 역동적인 시장 피보나치 수준(시장 피보나치).  이 지표에만 있는 고유한 기능. 가격 차트가 아닌 통화 강도에 피보나치가 적용됩니다.
Pips Generator
Oleg Rodin
4.6 (10)
Apollo Pips Generator 는 추세의 방향으로 신호를 제공하는 지표입니다. 표시기는 여러 진입점을 제공하므로 항상 이익을 얻을 수 있는 거래 기회를 찾을 수 있습니다. 스크린샷에 주의하세요. 스크린샷은 상단과 하단을 나타내는 별 신호가 있는 채널로 표시되는 다른 도구와 함께 Pips Generator 도구를 보여줍니다. 이 조합은 시스템을 적용할 수 있는 여러 방법을 제공합니다. 구매 후 두 번째 표시기를 무료로 받으려면 저에게 연락하십시오. 스크린샷에 나와 있는 것과 완전히 동일한 시스템을 갖게 될 것입니다. 또한 최상의 결과를 얻기 위해 이 시스템을 사용하는 방법에 대한 지침도 제공합니다. 두 도구 모두 PUSH 알림을 포함한 모든 유형의 경고를 제공합니다. 나는 당신에게 행복한 거래를 기원합니다!
GOLD Impulse with Alert
Bernhard Schweigert
4.67 (12)
이 지표는 Advanced Currency IMPULSE with ALERT  +   Currency Strength Exotics  의 2가지 제품의 슈퍼 조합입니다. 그것은 모든 시간 프레임에 대해 작동하며 8개의 주요 통화와 하나의 기호에 대한 강약의 충동을 그래픽으로 보여줍니다! 이 표시기는 금, 이국적인 쌍, 상품, 지수 또는 선물과 같은 기호에 대한 통화 강도 가속을 표시하는 데 특화되어 있습니다. 금, 은, 오일, DAX, US30, MXN, TRY, CNH 등의 진정한 통화 강도 가속(충동 또는 속도)을 표시하기 위해 9번째 줄에 모든 기호를 추가할 수 있습니다. 새로운 기본 알고리즘을 기반으로 구축되어 잠재적인 거래를 훨씬 더 쉽게 식별하고 확인할 수 있습니다. 이는 통화의 강세 또는 약세가 가속되는지 여부를 그래픽으로 표시하고 가속 속도를 측정하기 때문입니다. 자동차의 속도계처럼 생각하면 됩니다. 가속화할 때 Forex 시장에서 동일한 일이 분명히 더 빠르
Currency Strength Matrix
Raymond Gilmour
4.5 (26)
THE ONLY CURRENCY STRENGTH INDICATOR THAT IS BASED ON PRICE ACTION. DESIGNED FOR TREND, MOMENTUM & REVERSAL TRADERS This indicator  reads price action to confirm trend and strength . Advanced multi-currency and multi-time frame indicator that shows you simply by looking at one chart, every currency pair that is trending and the strongest and weakest currencies driving those trends. For full details on how to use this indicator, and also how to get a FREE chart tool, please see user manual HERE
Wave Cycle Counter
Eric Evert Ouweneel
Wave and Cycle counter to give an immediate indication how far the ongoing trend has progressed. Low numbers: trend has just started, ride the trend. Higher numbers: trend is 'older', watch for reversals This indicator is 100% compatible with the fantastic TopDog trading strategy. (I will NOT give any details about this Top Dog strategy) The trend direction is determined by a SMA value (or any other MA) you can set. Waves and cycles numbers and letters are derived from a SlowStoch setting. Wave
KT Gaussian Trend Filter MT4
KEENBASE SOFTWARE SOLUTIONS
KT Gaussian Trend Filter는 가우시안 필터링과 선형 회귀 기반 스무딩을 결합하여 명확하고 정밀한 추세 분석을 제공합니다. 간단한 매수 및 매도 신호를 생성하며, 시장의 장기적 방향성을 효과적으로 강조합니다. 기능 완전한 사용자 설정이 가능한 가우시안 필터: 필터의 길이와 극값을 조절하여 스무딩 강도와 추세 선명도를 세밀하게 조정할 수 있습니다. 선형 회귀 보정 기능: 가우시안 필터링 결과를 추가적으로 보정하여 시장 변동성에 따른 오탐지 신호를 최소화합니다. 다중 시간대 스캐너: 여러 시간대에서 가우시안 추세 방향을 자동으로 감지하고 직관적인 대시보드에 표시합니다. 트레일링 밴드 기능: 기존 추세 내에서 깊은 되돌림 구간의 진입 타이밍을 쉽게 파악할 수 있습니다. 색상 설정 사용자화: 트레이딩 스타일과 차트 레이아웃에 맞춰 인디케이터의 색상을 자유롭게 변경할 수 있습니다. 내장 알림 기능: 팝업, 이메일, 푸시 알림, 사운드 등을 통한 즉각적인 알림 수신이 가능합니
제작자의 제품 더 보기
MACD Message
Dmitriy Moshnin
MACD Message is an analogue of the MACD Alert for the MetaTrader 4 terminal with more advanced functionality: Parameters 'Averaging Method' and 'Price Type' ( MA method and Apply to ) are displayed in the settings window. It gives an advantage of monitoring convergence/divergence of all types of Moving Average (Simple Averaging, Exponential, Smoothed and Linear Weighted) and by any price (Closing Price, Opening Price, the Maximum Price for the Period, the Minimum Price for the Period, Median Pri
Symbol Profit
Dmitriy Moshnin
This is an indicator for MetaTrader 4. It is small, nice and compactly sized for a chart window, while conveniently displaying all the necessary information: open position volumes and total profit on them. Font size, corner and color can be set according to your preferences. By default, a positive position is displayed in green and a negative one is shown in red. Happy Trading. Indicator Parameters Symbol - name of the current symbol in the window: Show – display, Hide – do not display; Profit
Unlike the standard indicator, Stochastic Oscillator Message ( please see the description and video ) features an alert system that informs you of changes in the market situation using twenty signals: the Main line and Signal line cross in the area above/below the levels of extremum (below 20%; above 80%); the Main line and Signal line cross within the range of 20% to 80%; the Main line crosses the levels of extremum; the Main line crosses the 50-level; divergence on the last bar. Parameters of
RSI TrendLine Divergency Message is an indicator for the MetaTrader 4 trading platform. Unlike the original indicator, this three in one version has a system of alerts that inform on market situation changes. It consists of the following signals: when the Main line crosses the levels of extreme zones and 50% level; when the Main line crosses the Trend line in the indicator window; divergence on the last bar. Parameters of levels of extremum, 50-level and divergence are adjustable. Parameters La
MACD Color
Dmitriy Moshnin
MACD Color ( please see the description and video ) is an indicator for the MetaTrader 4 trading platform that is similar to MACD Message . Unlike the standard indicator, it changes the bar edge color when there is a change in the market situation - a change in the trend strength or a change in the inclination of the main EMA which represents the zero level - it changes the color of the zero level (this parameter can be disabled in the settings). Take a look at how the indicator can be used in a
The Four Moving Averages indicator ( please see the description and video ), a version of Four Moving Averages Message , concurrently displays four Moving Averages with default settings in the main chart window: Green and Red ones represent a short-term trend, Red and Blue ones - mid-term trend, while Blue and Yellow ones - long-term trend. You can change the moving average settings and colors. However, these parameters have been configured so that to allow trading on all time frames. Take a loo
The Four Moving Averages Message indicator ( please see the description and video ), a version of Four Moving Averages , concurrently displays four Moving Averages with default settings in the main chart window: Green and Red ones represent a short-term trend, Red and Blue ones - mid-term trend, while Blue and Yellow ones - long-term trend. You can change the moving average settings and colors. However, these parameters have been configured so that to allow trading on all time frames. The built-
The Display ADX System indicator for the MetaTrader 4 trading platform ( see description (in Russian) ) is compactly sized for a chart window, while displaying ADX indicator results for all time frames in a single window. Parameters for each time frame are set separately. Font size, corner and color can be set according to your preferences. By default, colors of time frame names are as follows: no trend - white, bullish trend - green, bearish trend - red. If the ADX is rising on the last three b
The Level Moving Averages indicator ( see the description and video ) does not draw the Moving Average line in the chart window but marks the Moving Average level on all time frames in accordance with the specified parameters. The level move frequency corresponds to the TimeFrame parameter value specified. The advantage of this indicator lies in the fact that it offers the possibility of monitoring the interaction between the price and the MA of a higher time frame on a lower one (e.g., the MA l
The Level S Moving Averages indicator ( see the description and video ) does not draw the Moving Average line in the chart window but marks multiple levels (such as close, highs and lows of any bar on the time frames from M1 to D1, W1, MN - strong levels) of the Moving Average on all time frames in accordance with the specified parameters. The level move frequency corresponds to the TimeFrame parameter value specified. The advantage of this indicator lies in the fact that it offers the possibili
The Level Moving Averages Message indicator ( see the description and video ) does not draw the Moving Average line in the chart window but marks the Moving Average level on all time frames in accordance with the specified parameters. The level move frequency corresponds to the TimeFrame parameter value specified. The advantage of this indicator lies in the fact that it offers the possibility of monitoring the interaction between the price and the MA of a higher time frame on a lower one (e.g.,
Lot Calculation
Dmitriy Moshnin
Lot size calculator ( see the description ) calculates the lot size based on percent of free margin, as well as profit, loss and P/L ratio for a planned position by moving horizontal levels in the chart window. More advanced analog of Lot Calculation is Profit Factor indicator.
The Display Trend Moving Averages System indicator ( see its description ) shows information about direction of trends H1, H4, D1, W1, MN on all timeframes in one window, so that you can track changes in the average price before the oldest bar closes. A trend unit is a Moving Average with period "1" of the close of the oldest bar (H1, H4, D1,  W1, MN). The indicator recalculates values of older bars for internal bars and draws a trend slope in the chart window as colored names of time intervals:
ADX Message
Dmitriy Moshnin
Отличается от стандартного индикатора дополнительным набором настроек и встроенной системой оповещений. Индикатор может подавать сигналы в виде алерта ( Alert ), комментария в левый верхний угол главного окна графика ( Comment ), уведомления на мобильную версию терминала ( Mobile МТ4 ), электронный почтовый ящик ( Gmail ).  Параметры индикатора Period — период расчета индикатора; Method — выбор метода усреднения: простой, экспоненциальный, сглаженный, линейно-взвешенный; Apply to — выбор использ
The Two Moving Averages indicator concurrently displays two Moving Averages with default settings in the main chart window: Green and Red lines that represent a short-term trend. You can change the moving average settings and colors. However, these parameters have been configured so that to allow trading on all timeframes. Take a look at how the Moving Averages lines can be used in a profitable multi-currency Trading Strategy on all time frames, that is also suitable for trading in your mobile t
The Three Moving Averages indicator concurrently displays three Moving Averages with default settings in the main chart window: Green and Red lines represent a short-term trend, Red and Blue lines - long-term trend. You can change the moving average settings and colors. However, these parameters have been configured so that to allow trading on all timeframes. Take a look at how the Moving Averages lines can be used in a profitable multi-currency Trading Strategy on all time frames, that is also
The alerting system for the MetaTrader 4 platform 'Two Moving Average Message' consists of two moving average lines with individual parameters. The indicator can generate alerts ( AlertMessage )б display a comment in the upper left corner of the main chart window ( CommentMessage ), send notifications to the mobile terminal version ( MobileMessage ), send emails ( GmailMessage ) and play two different sounds at the intersection of lines upwards or downwards. Parameters Language – choose language
Three Moving Averages Message is a notification system for the MetaTrader 4 platform. It consists of three moving averages which have their own adjustable parameters. Slow and Long lines determine long-term trend, while Fast and Slow lines - short-term. If the lines Fast and Slow are crossed during a trend, the indicator displays a recommendation for buying (selling). If the lines Slow and Long are crossed, the indicator notifies of the start of a up/down trend. Concerning other types of crossin
Profit Factor
Dmitriy Moshnin
The Profit Factor indicator calculates one of the three parameters: 1 - market entry level (in the 'Calculate the' parameter - Market Open Trade), 2 - the Stop Loss level (Calculate the - Market Price Loss), 3 - the Take Profit level (Calculate the - Market Price Profit) - with a desired profit/loss ratio (Profit Factor), as well as the lot size (trade volume) according to the value of the risk percentage of available funds specified in the settings (a simpler analog is the Lot Calculation indic
MACD Converter
Dmitriy Moshnin
MACD Converter is an analogue of the MACD Message with more advanced functionality: It has two signal lines: Signal Line 1 and Line 2, bar outlines are colored according to Line 1, it also triggers the trend notifications. MACD Converter converts the parameters of Fast MA, Slow MA and Signal Line 1 and Line 2 lines from the interval specified in the settings (Convert Time Frame) to smaller timeframes. This allows receiving a signal for making a decision within the specified (Convert Time Frame)
LTT Range System
Dmitriy Moshnin
Индикатор Форекс LTT Range System показывает на графике средние диапазоны движения рыночной цены за периоды M 15, H 1, H 4, D 1, W 1, MN 1.  Верхняя и нижняя границы диапазонов рассчитываются от цены открытия бара. Пивот – середина между ценой открытия бара и границей диапазона: если рыночная цена находится выше цены открытия бара – метка пивота располагается между ценой открытия бара и верхней меткой диапазона, если рыночная цена находится ниже цены открытия бара – метка пивота располагается ме
Parabolic Converter is and analogue of the Parabolic indicator for МТ4 which can automatically recalculate parameters of Time Frame specified in settings for lower time periods. It has a Notification System which triggers when the price movement direction is changed. For example: if we set Time Frame 1 Hour to H1 and M30, M15, M5 and M1 contained therein, we can see the indicator's readings corresponding to H1 (fig.). At that, if we add one more Parabolic on the same chart (of several charts) wi
RSI Converter
Dmitriy Moshnin
Relative Strength Index with advanced functionality recalculates (converts) the averaging period in accordance with the value of parameter Time Frame for lower chart time intervals (Multi-TimeFrame (MTF)). Unlike the standard indicator, RSI converter includes an alert system that notifies about changes in market situation, it consists of the following signals: Main line crosses levels of extreme zones (30%, 70%) and the level of 50%; The main line crosses one or two trendlines in the indicator w
Commodity Channel Index Message is an indicator for the MetaTrader 4 trading platform. Unlike the original indicator, this three in one version has a system of alerts that inform on market situation changes. It consists of the following signals: when the Main line crosses the levels of extreme zones and 50% level; when the Main line crosses the Trend line in the indicator window; Divergence on the last bar. Values of the middle and extreme levels and divergence zones are customizable. Parameter
MACD TrendMA
Dmitriy Moshnin
The MACD TrendMA indicator is a trading system developed on the basis of the MACD indicator popular among many traders, and which is based on measuring the inclination (trend) angle of the moving averages, while measuring the ratio (convergence/divergence) between them. The signal for entering/exiting the market is the frame of the bars colors and color of the MACD TrendMA histogram according to the trend, which can be customized in the properties window of the indicator - in case the inclinatio
MACD Temp
Dmitriy Moshnin
MACD Temp is a system of two oscillators, which allows to track the price changes of the Fast and Slow periods in case of their convergence/divergence. The bar border is colored in accordance with the MACD trend, while the color of the histogram changes when the values of the Momentum indicators cross the level of 100, for respective periods: Fast Moving Average (Fast Momentum), Slow Moving Average (Slow Momentum), selectively or for both values (the mode is to be chosen in the indicator propert
MACD CloseBars
Dmitriy Moshnin
The MACD CloseBars indicator is a trading system based on the MACD indicator popular among many traders, which is built on the principle of bars closing above the moving averages selected in the indicator settings. The signal for entering/exiting the market is the frame of the bars colors according to the trend: in case the bars in the main window of the chart are closed above/below the Fast Moving Average, Slow Moving Average individually or both together. Indicator Parameters Fast Moving Aver
MACD ColorBars
Dmitriy Moshnin
MACD ColorBars paints bar frames according to a trend, as well as changes the histogram color when MACD bars are rising or falling (if Color Bars is enabled in the inputs window). The growth of bars indicates a divergence between the fast and slow moving averages, while the decrease indicates their convergence. Parameters Fast Moving Average - period of the fast moving average; Slow Moving Average - period of the slow moving average; MA method - moving average smoothing method (simple, exponent
MACD Volume
Dmitriy Moshnin
The MACDVolume indicator is a trading system based on the increase in tick volumes in bars, which match the trend. Indicator Parameters Fast Moving Average - period of the fast moving average; Slow Moving Average - period of the slow moving average; MA method - averaging method of the moving averages (simple averaging, exponential, smoothed and linear-weighted); Apply to - applied price of the moving averages (Close, Open, High for the period, Low for the period, Median, Typical and Linear-Weig
MACD BBands
Dmitriy Moshnin
MACD BBands is a trading system based on MACD and Bollinger Bands placed in a single window. The indicator shows moving average slope angle (trend) change, compares their ratio (convergence/divergence) and allows sorting out signals using Bollinger Bands. The indicators are calibrated in such a way that the middle Bollinger Bands line is the zero level of the MACD indicator. Parameters Period - Bollinger Bands period; Deviations - number of standard deviations; Shift - shift relative to price;
필터:
sunnychow
9044
sunnychow 2018.12.16 09:07 
 

사용자가 평가에 대한 코멘트를 남기지 않았습니다

Tim Eubanks
5763
Tim Eubanks 2018.03.20 04:11 
 

사용자가 평가에 대한 코멘트를 남기지 않았습니다

Maksym Mudrakov
30050
Maksym Mudrakov 2016.08.31 13:39 
 

사용자가 평가에 대한 코멘트를 남기지 않았습니다

Vadim Strelkov
7710
Vadim Strelkov 2014.05.06 15:20 
 

사용자가 평가에 대한 코멘트를 남기지 않았습니다

리뷰 답변