MACD Color
- 지표
-
Dmitriy Moshnin
 Торговать нужно так, чтобы не было мучительно больно за бесцельно вложенные деньги...
 - 버전: 1.2
- 업데이트됨: 24 3월 2020
- 활성화: 5
MACD Color (please see the description and video) is an indicator for the MetaTrader 4 trading platform that is similar to MACD Message. Unlike the standard indicator, it changes the bar edge color when there is a change in the market situation - a change in the trend strength or a change in the inclination of the main EMA which represents the zero level - it changes the color of the zero level (this parameter can be disabled in the settings). Take a look at how the indicator can be used in a profitable multi-currency Trading Strategy on all time frames, that is also suitable for trading in your mobile terminal.
Good luck in trading!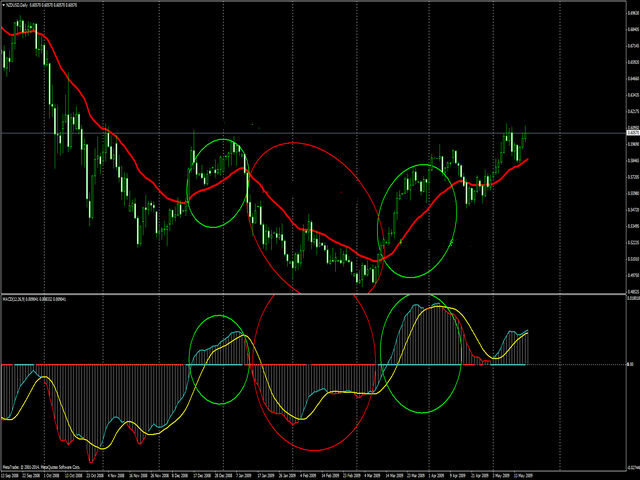


사용자가 평가에 대한 코멘트를 남기지 않았습니다