Three Moving Averages Message

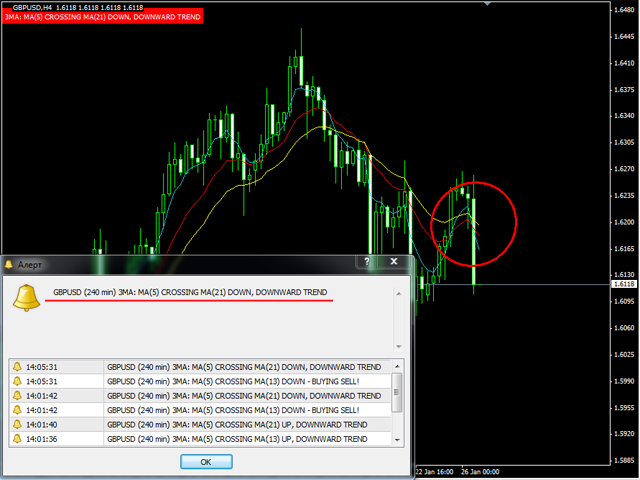
Three Moving Averages Message is a notification system for the MetaTrader 4 platform. It consists of three moving averages which have their own adjustable parameters. Slow and Long lines determine long-term trend, while Fast and Slow lines - short-term. If the lines Fast and Slow are crossed during a trend, the indicator displays a recommendation for buying (selling). If the lines Slow and Long are crossed, the indicator notifies of the start of a up/down trend. Concerning other types of crossing, the indicator just informs about them. It can be done using alerts (AlertMessage), comment displayed in the top left conner of the chart (Comments), mobile notifications (MobileMessage) and email (GmailMessage).

Parameters

  • Language – select English or Russian language;
  • Fast(Slow, Long) Period – period of the moving average;
  • Fast(Slow, Long) Shift – shift of the moving average relative to the price chart;
  • Fast(Slow, Long) Mode – select a method of averaging for the moving average: simple, exponential, smoothed, linear-weighted;
  • Fast(Slow, Long) Price – select a type of price used: close, open, high, low, median, typical, linear-wighted.

Wish you successful trading!

추천 제품
Auto Fibo Pro m
DMITRII GRIDASOV
"Auto FIBO Pro" Crypto_Forex 지표 - 거래에 유용한 보조 도구입니다! - 지표는 자동으로 Fibo 수준과 로컬 추세선(빨간색)을 계산하여 차트에 배치합니다. - Fibonacci 수준은 가격이 반전될 수 있는 주요 영역을 나타냅니다. - 가장 중요한 수준은 23.6%, 38.2%, 50%, 61.8%입니다. - 역전 스캘핑이나 존 그리드 거래에 사용할 수 있습니다. - Auto FIBO Pro 지표를 사용하여 현재 시스템을 개선할 수 있는 기회도 많습니다. - Info Spread Swap Display가 있습니다. 현재 Spread와 Swap이 부착된 외환 쌍을 표시합니다. - 디스플레이에는 계정 잔액, 자본 및 마진도 표시됩니다. - 차트의 어느 모서리에서나 Info Spread Swap Display를 찾을 수 있습니다. 0 - 왼쪽 상단 모서리, 1 - 오른쪽 상단, 2 - 왼쪽 하단, 3 - 오른쪽 하단. 여기를 클릭하여 고품질 트레이딩 로봇과
Trend PA
Mikhail Nazarenko
5 (3)
The Trend PA indicator uses   Price Action   and its own filtering algorithm to determine the trend. This approach helps to accurately determine entry points and the current trend on any timeframe. The indicator uses its own algorithm for analyzing price changes and Price Action. Which gives you the advantage of recognizing, without delay, a new nascent trend with fewer false positives. Trend filtering conditions can be selected in the settings individually for your trading style. The indicator
VR Cub
Vladimir Pastushak
VR Cub 은 고품질 진입점을 얻는 지표입니다. 이 지표는 수학적 계산을 용이하게 하고 포지션 진입점 검색을 단순화하기 위해 개발되었습니다. 지표가 작성된 거래 전략은 수년 동안 그 효율성을 입증해 왔습니다. 거래 전략의 단순성은 초보 거래자라도 성공적으로 거래할 수 있다는 큰 장점입니다. VR Cub은 포지션 개시 지점과 이익 실현 및 손절매 목표 수준을 계산하여 효율성과 사용 편의성을 크게 높입니다. 간단한 거래 규칙을 이해하려면 아래 전략을 사용한 거래 스크린샷을 살펴보세요. 설정, 세트 파일, 데모 버전, 지침, 문제 해결 등은 다음에서 얻을 수 있습니다. [블로그] 다음에서 리뷰를 읽거나 작성할 수 있습니다. [링크] 버전 [MetaTrader 5] 진입점 계산 규칙 포지션 개설 진입점을 계산하려면 VR Cub 도구를 마지막 최고점에서 마지막 최저점까지 늘려야 합니다. 첫 번째 지점이 두 번째 지점보다 빠른 경우, 거래자는 막대가 중간선 위에서 마감될 때까지 기다립니다
Owl smart levels
Sergey Ermolov
4.24 (37)
MT5 버전  |   FAQ Owl Smart Levels Indicator 는   Bill Williams 의 고급 프랙탈, 시장의 올바른 파동 구조를 구축하는 Valable ZigZag, 정확한 진입 수준을 표시하는 피보나치 수준과 같은 인기 있는 시장 분석 도구를 포함하는 하나의 지표 내에서 완전한 거래 시스템입니다. 시장과 이익을 취하는 장소로. 전략에 대한 자세한 설명 표시기 작업에 대한 지침 고문-거래 올빼미 도우미의 조수 개인 사용자 채팅 ->구입 후 나에게 쓰기,나는 개인 채팅에 당신을 추가하고 거기에 모든 보너스를 다운로드 할 수 있습니다 힘은 단순함에 있습니다! Owl Smart Levels   거래 시스템은 사용하기 매우 쉽기 때문에 전문가와 이제 막 시장을 연구하고 스스로 거래 전략을 선택하기 시작한 사람들 모두에게 적합합니다. 전략 및 지표에는 눈에 보이지 않는 비밀 공식 및 계산 방법이 없으며 모든 전략 지표는 공개되어 있습니다. Owl Smart Leve
Indicador Taurus All4
Fabio Oliveira Magalhaes
Taurus All4 Taurus All4 is a high-performance indicator, it will tell you the strength of the trend, and you will be able to observe the strength of the candle. Our indicator has more than 4 trend confirmations. It is very simple and easy to use. Confirmation Modes Candle Trend Confirmations: When the candle switches to light green the trend is high. When the candle switches to light red the trend is reverting down. When the candle changes to dark red the trend is low. Trendline Trend Confirm
Trend Ray
Andriy Sydoruk
The indicator shows the potential trend direction by cyclical-wave dependence. Thus, all the rays of the intersection will be optimal rays, in the direction of which the price is expected to move, taking into account the indicator period. Rays can be used as a direction for potential market movement. But we must not forget that the approach must be comprehensive, the indicator signals require additional information to enter the market.
Trendiness Index
Libertas LLC
5 (3)
"The trend is your friend" is one of the best known sayings in investing, because capturing large trendy price movements can be extremely profitable. However, trading with the trend is often easier said than done, because many indicators are based on price reversals not trends. These aren't very effective at identifying trendy periods, or predicting whether trends will continue. We developed the Trendiness Index to help address this problem by indicating the strength and direction of price trend
New, more accurate version of the Xmaster indicator. More than 200 traders from around the world have conducted more than 15,000 tests of different combinations of this indicator on their PCs in order to get the most effective and accurate formula. And here we present to you the "Xmaster formula indicator forex no repaint" indicator, which shows accurate signals and does not repaint. This indicator also sends signals to the trader by email and push. With the arrival of each new tick, it constan
The   Trendlines Oscillator   helps traders identify trends and momentum based on the normalized distances between the current price and the most recently detected bullish and bearish trend lines. The indicator features bullish and bearish momentum, a signal line with crossings, and multiple smoothing options. USAGE The   Trendlines Oscillator   works by systematically: Identifying pivot highs and lows. Connecting pivots to form bullish (support) and bearish (resistance) trendlines. Measuring
History Pattern Search
Yevhenii Levchenko
표시기는 현재 시세를 작성하여 과거 시세와 비교할 수 있으며 이를 바탕으로 가격 변동을 예측합니다. 표시기에는 원하는 날짜로 빠르게 이동할 수 있는 텍스트 필드가 있습니다. 옵션: 기호 - 표시기가 표시할 기호 선택. SymbolPeriod - 지표가 데이터를 가져올 기간 선택. IndicatorColor - 표시기 색상. HorisontalShift - 지시자가 그린 따옴표를 지정된 막대 수만큼 이동합니다. Inverse - true는 인용 부호를 반대로, false - 원래 보기를 반전합니다. ChartVerticalShiftStep - 차트를 수직으로 이동합니다(키보드의 위/아래 화살표). 다음은 날짜를 입력할 수 있는 텍스트 필드의 설정으로, '엔터'를 누르면 즉시 이동할 수 있습니다.
Alpha Trend sign has been a very popular trading tool in our company for a long time. It can verify our trading system and clearly indicate trading signals, and the signals will not drift. Main functions: Based on the market display of active areas, indicators can be used to intuitively determine whether the current market trend belongs to a trend market or a volatile market. And enter the market according to the indicator arrows, with green arrows indicating buy and red arrows indicating se
Crypto_Forex 지표 HTF Ichimoku for MT4. - Ichimoku 지표는 가장 강력한 트렌드 지표 중 하나입니다. HTF는 - Higher Time Frame을 의미합니다. - 이 지표는 트렌드 트레이더와 가격 액션 항목과의 조합에 탁월합니다. - HTF Ichimoku 지표를 사용하면 더 높은 타임프레임의 Ichimoku를 현재 차트에 첨부할 수 있습니다. - 상승 추세 - 파란색 선 위에 빨간색 선(두 선 모두 클라우드 위에 있음) / 하락 추세 - 파란색 선 아래에 빨간색 선(두 선 모두 클라우드 아래에 있음). - 가격이 Ichimoku 클라우드 상단 테두리를 돌파했을 때만 BUY 주문을 엽니다. - 가격이 Ichimoku 클라우드 하단 테두리를 돌파했을 때만 SELL 주문을 엽니다. - HTF Ichimoku 지표는 큰 트렌드를 포착할 수 있는 기회를 제공합니다. 여기를 클릭하여 고품질 트레이딩 로봇과 지표를 확인하세요! 이 MQL5 웹사이트에서만
Rainbow Price Visualizer
Vincent Jose Proenca
Rainbow Price Visualizer v1.21 See where the market really breathes. Turns your MT4 chart into an ultra-precise heatmap that highlights price zones favored by big players. Why it matters 300 price levels at 0.2‑pip resolution — microscopic detail. 8 visual themes (Rainbow, Fire, Ocean…) for instant readibility. Smart opacity: low noise fades, real zones pop. Lightweight rendering with automatic cleanup. Fully customizable: saturation, opacity, resolution, history depth. Bands project into the f
Robot scalper for M5 timeframe. Trades on the GBPUSD currency pair. This robot has been specially developed by a company of professional traders for trading in the pound sterling. The robot approximately opens 5 to 15 trades every day. It is best to trade with brokers that have a low spread on GBPUSD up to 10 pips. The recommended minimum deposit to start is $500 or more. Advantages: does not use martingale. not a net. every trade has a stop loss. professional bot specifically for the GBPUSD p
Delta Fusion Pro
Francesco Secchi
5 (2)
Delta Fusion Pro – 인트라데이 트레이딩을 위한 고급 주문 흐름 분석 Delta Fusion Pro는 MetaTrader 4용 전문 지표로, 공격적인 주문 흐름을 드러내고 기관 압력의 강도와 방향을 실시간으로 보여줍니다. 기존의 거래량 지표와 달리, Ask와 Bid 거래량 간의 델타를 분석하여 반전 예측, 추세 확인 및 전문 관심 영역을 식별합니다. 주요 특징 지능형 자동 조정 시스템 다음 조건에 따라 모든 매개변수를 자동으로 조정합니다: 상품 유형 (외환, 암호화폐, 지수, 원자재, 주식) 운영 타임프레임 시장 변동성 (ATR) 최근 평균 거래량 초보 트레이더를 위한 수동 설정 없음 – 지표가 자동으로 보정됩니다! 기능 NetDelta 및 누적 델타 Ask/Bid 공격적 거래량 차이 계산, 사용자 지정 EMA 스무딩 실시간 방향 압력 시각화 히스토그램 색상 사용자 지정 (매수/매도) 가격/거래량 다이버전스 일반 및 숨겨진 다이버전스 자동 감지 강도 분류: 강/중/
앞뒤로 스윙 기반 거래 고문입니다. 단일 주문에 거래. 보이지 않는 스톱플로스가 있고 가져갑니다.이익. 설정에서 설정된 수익에 도달하면 주문이 닫히고 초기 주문에서 다시 시작됩니다. 순서가 플러스로 마감되었지만 잔액(잔액+이익)에 도달하지 못하면 다음 순서는 (이익 인 경우,다음 감소)-설정에서,이 이익에 삭감 나올 때까지! 만약 가격이 추세에 반하는 경우,정지 손실이 발생하고,증가된 롯을 가진 반대 주문이 열립니다. 롯은 마팅게일(케이 _마틴)과 산술(에이 _어레펫트)곱셈 또는 덧셈으로 증가할 수 있습니다. 또한 이익을 캡처 후행 정지를 활성화 할 수 있습니다. 후행 정지는 정지 손실에 관계없이 긍정적 인 이익으로 즉시 나타날 수 있습니다.그 전에 브로커는 정지 손실 또는 후행 중 하나를 볼 수 없습니다 STOP.To 이 작업을 수행,당신은 가격이 순서에서 검은 색으로 판명 할 때 점의 수에 후행 정지 플러스를 설정해야합니다. 전략 테스터의 전문가 고문을 최적화하고 자신에게 가장
The indicator detects and displays 3 Drives harmonic pattern (see the screenshot). The pattern is plotted by the extreme values of the ZigZag indicator (included in the resources, no need to install). After detecting the pattern, the indicator notifies of that by a pop-up window, a mobile notification and an email. The indicator highlights the process of the pattern formation and not just the complete pattern. In the former case, it is displayed in the contour triangles. After the pattern is com
This indicator is another variant of the famous powerful indicator Fibonacci-SS https://www.mql5.com/en/market/product/10136 but has different behaviour in placing Pending Order and TP Line. Automatically places Fibonacci retracement lines from the last highest and lowest visible bars on the chart with: An auto Pending Order (Buy/Sell). Taking Profit 1, Taking Profit 2 is pivot point and Taking Profit 3 for extended reward opportunity. The best risk and reward ratio. Simple and powerful indicat
"Adjustable Fractals"는 프랙탈 지표의 고급 버전으로, 매우 유용한 거래 도구입니다! .................................................................................................................. - 알다시피 표준 프랙탈 mt4 지표에는 설정이 전혀 없습니다. 이는 거래자에게 매우 불편합니다. - Adjustable Fractals는 이 문제를 해결했습니다. 필요한 모든 설정이 있습니다. - 지표의 조정 가능한 기간(권장 값 - 7 이상). - 가격의 고점/저점으로부터 조정 가능한 거리. - 프랙탈 화살표의 조정 가능한 디자인. - 표시기에는 모바일 및 PC 알림 기능이 내장되어 있습니다. 여기를 클릭하여 고품질 트레이딩 로봇과 지표를 확인하세요! 이 MQL5 웹사이트에서만 제공되는 오리지널 제품입니다.
Laser Trend
Nicolas Zouein
The trend is your friend! This is what this indicator is all about. Follow this famous saying and be safe. Characteristics: Buy/Sell signals fixed on the close of a bar. Works on all symbols and all timeframes. Clear visual market trend laser line, Buy/Sell signal arrows, market strength meter, TP1 & TP2 boxes. Visual signals when to enter, when to exit the market. No repainting. Compatible with Flexible EA for trading automation. (Ask for a free set file optimized to perform 2010-2018) Parame
Trend Oscillator mw
DMITRII GRIDASOV
Trend Oscillator - 고급 맞춤형 Crypto_Forex 지표, 효율적인 거래 도구입니다! - 고급 새로운 계산 방법 사용 - 매개변수 "계산 가격"에 대한 20가지 옵션. - 지금까지 개발된 가장 매끄러운 오실레이터. - 상승 추세는 녹색, 하락 추세는 빨간색. - 과매도 값: 5 미만, 과매도 값: 95 이상. - 이 지표로 표준 전략도 업그레이드할 수 있는 기회가 많습니다. - PC 및 모바일 알림. ................................................................................................................................................ 여기를 클릭하여 고품질 트레이딩 로봇과 지표를 확인하세요! 이 MQL5 웹사이트에서만 제공되는 오리지널 제품입니다.
Magic Grid
Aliaksandr Charkes
4.54 (28)
Magic Grid is an indicator-free advisor that uses a grid strategy. The strategy is based on automatic reopening of grid pending orders, after closing their market positions (by Take-Profit, Stop-Loss or manually). Pending orders are placed with a specified step from the initial prices, which can be entered manually or generated automatically ( one time at the beginning of the trade ). The robot can trade on any time frame, on any currency pair, on several currency pairs, and on any number of di
FREE
DYJ GlobalTradeGameTheory(Power)  is based on   Bulls   and  Bears  indicator. It can be used for any currency pair and timeframe. Power: Market entry condition  Power attempts to gauge bullish and bearish forces in the market by using two separate measures, one for each type of directional pressure. The  EA's BearsIndex  attempts to measure the market's appetite for lower prices The EA's BullsIndex attempts to measure the market's appetite for higher prices It also uses  Laguerre filtering fal
ADX Pointer
Dominik Mandok
ADX Pointer is an indicator which is based on "Average Directional Index" and draws three numbers in chart window depending on the value of ADX. In ADX Pointer you can set "ADX_Period" which is of course period of Average Directional Index and you can also set 3 levels. When ADX value exceed first level ("ADX_Level1") in chart window appears number "1", when ADX exceed second level ("ADX_Level2") appears "2" and when ADX exceed third level ("ADX_Level3") appears "3". Simple. ADX Pointer works on
캔들의 종가를 예측하는 지표입니다. 지표는 주로 D1 차트에서 사용하기 위한 것이. 이 지표는 전통적인 외환 거래와 바이너리 옵션 거래 모두에 적합합니다. 지표는 독립형 거래 시스템으로 사용하거나 기존 거래 시스템에 추가로 사용할 수 있습니다. 이 표시기는 현재 양초를 분석하여 양초 본체 내부의 특정 강도 요인과 이전 양초의 매개변수를 계산합니다. 따라서 지표는 시장 움직임의 추가 방향과 현재 양초의 종가를 예측합니다. 이 방법 덕분에 지표는 단기 및 중장기 거래 모두에 적합합니다. 지표를 사용하면 시장 상황을 분석하는 동안 지표가 생성할 잠재적 신호의 수를 설정할 수 있습니다. 표시기 설정에는 이를 위한 특별한 매개변수가 있습니다. 또한 인디케이터는 새로운 신호에 대해 차트의 메시지 형태, 이메일 및 PUSH 알림 형태로 알릴 수 있습니다. 구매 후 저에게 꼭 써주세요! 나는 당신에게 지표와 거래에 대한 나의 추천을 줄 것입니다! 또한 보너스를 받으세요!
Before
Nadiya Mirosh
The Before indicator predicts the most likely short-term price movement based on complex mathematical calculations. Most of the standard indicators commonly used in trading strategies are based on fairly simple calculations. This does not mean that there were no outstanding mathematicians in the world at the time of their creation. It is just that computers did not yet exist in those days, or their power was not enough for the sequential implementation of complex mathematical operations. Nowad
ShinZuka
Muhammad Asyraf Bin Mohamad
Using MACD value for direction. Using RSI as reversal indicator. Using open trading hour. (Recommend Hour 10,11,15 & 19 : MT4-Time) Counter trade if signal failed. Cutloss trade if signal failed. Auto lot calculate based on target profit & takeprofit. Able to set counter trade value. Suitable for commodities & currency.  Timeframe H1. Able to set limit lot open. Able to select day to trade.
The indicator displays the data of the Stochastic oscillator from a higher timeframe on the chart. The main and signal lines are displayed in a separate window. The stepped response is not smoothed. The indicator is useful for practicing "manual" forex trading strategies, which use the data from several screens with different timeframes of a single symbol. The indicator uses the settings that are identical to the standard ones, and a drop-down list for selecting the timeframe. Indicator Paramet
Spread and Close MT4
Alexander Denisovich Jegorov
Spread & Candle Close Timer Indicator for MT4  Optimize your trading with this lightweight and efficient indicator, designed to display the real-time spread and candle close countdown directly on your MT4 chart. Features: Live Spread Monitoring – Instantly see market conditions. Candle Close Timer – Stay prepared for the next price movement. Simple & Non-Intrusive Design – No unnecessary settings, just clear and accurate data. Ideal for scalpers, day traders, and those who need real-time exec
Trend Scanner
Vladimir Kalendzhyan
4.33 (6)
By purchasing this indicator, you have the right to receive a free copy of one of   my other indicator's or advisor’s!  (All future updates are included. No limits) . To get it , please contact me by  mql5 message ! The Trend Scanner trend line indicator displays the trend direction and its changes. The indicator works on all currency pairs and  timeframes. The indicator simultaneously displays multiple readings on the price chart: the support and resistance lines of the currency pair, the exist
이 제품의 구매자들이 또한 구매함
Miraculous Indicator – Gann Square of Nine 기반 100% 비리페인트 Forex 및 바이너리 도구 이 영상은 Miraculous Indicator 를 소개합니다. 이 지표는 Forex 및 바이너리 옵션 트레이더를 위해 특별히 개발된 매우 정확하고 강력한 트레이딩 도구입니다. 이 지표가 독특한 이유는 전설적인 **Gann Square of Nine(Gann 9의 사각형)**과 **Gann's Law of Vibration(Gann 진동의 법칙)**에 기반을 두고 있기 때문입니다. 이는 현대 트레이딩에서 가장 정밀한 예측 도구 중 하나로 손꼽힙니다. Miraculous Indicator는 완전히 비리페인트(non-repaint) 됩니다. 즉, 캔들이 마감된 후에도 신호가 변경되거나 사라지지 않습니다. 보이는 것이 곧 결과입니다. 이는 트레이더가 자신감을 가지고 거래에 진입하고 청산할 수 있는 신뢰할 수 있고 일관된 기반을 제공합니다. 주요 특징: Gann
Gann Made Easy
Oleg Rodin
4.81 (156)
Gann Made Easy 는 mr.의 이론을 사용하여 최고의 거래 원칙을 기반으로 하는 전문적이고 사용하기 쉬운 Forex 거래 시스템입니다. W.D. 간. 이 표시기는 Stop Loss 및 Take Profit Levels를 포함하여 정확한 BUY 및 SELL 신호를 제공합니다. PUSH 알림을 사용하여 이동 중에도 거래할 수 있습니다. 거래 팁, 보너스, GANN MADE EA를 무료로 받으시려면 구매 후 저에게 연락주세요! 아마도 Gann 거래 방법에 대해 이미 여러 번 들었을 것입니다. 일반적으로 Gann의 이론은 초보자 거래자뿐만 아니라 이미 거래 경험이 있는 사람들에게도 매우 복잡한 것입니다. Gann의 거래 방식은 이론적으로 적용하기 쉽지 않기 때문입니다. 나는 그 지식을 연마하고 Forex 지표에 최고의 원칙을 적용하기 위해 몇 년을 보냈습니다. 표시기는 적용하기가 매우 쉽습니다. 차트에 첨부하고 간단한 거래 권장 사항을 따르기만 하면 됩니다. 지표는 지속적으로 시장
M1 Sniper
Oleg Rodin
5 (17)
M1 SNIPER 는 사용하기 쉬운 거래 지표 시스템입니다. M1 시간대에 맞춰 설계된 화살표 지표입니다. 이 지표는 M1 시간대 스캘핑을 위한 단독 시스템으로 사용할 수 있으며, 기존 거래 시스템의 일부로도 사용할 수 있습니다. 이 거래 시스템은 M1 시간대 거래용으로 특별히 설계되었지만, 다른 시간대에도 사용할 수 있습니다. 원래는 XAUUSD와 BTCUSD 거래를 위해 이 방법을 설계했지만, 다른 시장 거래에도 유용하다는 것을 알게 되었습니다. 이 지표의 신호는 추세 방향과 반대로 거래될 수 있습니다. 저는 지표의 신호를 활용하여 양방향으로 거래할 수 있도록 돕는 특별한 거래 기법을 알려드립니다. 이 방법은 특별한 동적 지지선과 저항선 가격 영역을 활용하는 것을 기반으로 합니다. 구매하시면 M1 SNIPER 화살표 지표를 바로 다운로드하실 수 있습니다. 또한, 아래 스크린샷에 표시된 Apollo Dynamic SR 지표는 M1 SNIPER 도구를 사용하는 모든 사용자에게 무료로
RFI levels PRO
Roman Podpora
5 (1)
사전 지표       시장 반전 수준과 영역을 파악하여   가격이 해당 수준으로 되돌아올 때까지 기다렸다가 새로운 추세의 시작점에서 진입할 수 있도록 해줍니다. 즉, 추세의 끝에서 진입하는 것이 아닙니다. 그는 보여준다       반전 수준       시장이 방향 전환을 확인하고 추가적인 움직임을 형성하는 지점입니다. 이 지표는 차트를 다시 그릴 필요 없이 작동하며, 모든 금융 상품에 최적화되어 있고, 특정 금융 상품과 함께 사용할 때 최대의 잠재력을 발휘합니다.       트렌드 라인즈 프로       지시자. 모든 계측기에 적용 가능한 가역 구조 스캐너 모든 거래 상품을 자동으로 추적하고 모든 R-반전 패턴을 즉시 식별하여 LOGIC AI 신호가 이미 존재하는 위치와 기타 유용한 정보를 표시합니다. 로직 AI – 진입점을 표시해주는 도우미 시장 진입에 가장 적합한 시점을 판단하는 지능형 신호입니다. TPSproSYSTEM 알고리즘을 사용하여 가격 변동, 추세 및 주요 시장 참
TPSpro RFI Levels
Roman Podpora
4.85 (27)
러시아어 설명서  /  영어   설명서  /  MT5 버전 주요 기능: 판매자와 구매자의 활동 영역을 표시합니다! 이 지표는 매수 및 매도에 대한 모든 올바른 첫 번째 임펄스 레벨/존을 표시합니다. 진입점 검색이 시작되는 이러한 레벨/존이 활성화되면 레벨의 색상이 바뀌고 특정 색상으로 채워집니다. 상황을 더욱 직관적으로 파악할 수 있도록 화살표도 표시됩니다. LOGIC AI - 템플릿 활성화 시 진입점 검색을 위한 영역(원) 표시 시각적 명확성을 개선하기 위해 인공지능을 사용하여 진입점을 검색한 영역을 표시하는 기능이 추가되었습니다. 더 높은 시간대의 레벨/존 표시(MTF 모드) 더 높은 시간 간격을 사용하여 레벨/존을 표시하는 기능이 추가되었습니다. 또한, 이 지표는 자동 추세 감지 기능(   TPSproTREND PRO   )을 구현했습니다. 거래를 위한 별도의 전문적인 단계별 알고리즘 이 알고리즘은 추세 방향과 반대 방향으로의 당일 거래 모두에 적합하도록 설계되었습니다. 각
Volatility Trend System - a trading system that gives signals for entries. The volatility system gives linear and point signals in the direction of the trend, as well as signals to exit it, without redrawing and delays. The trend indicator monitors the direction of the medium-term trend, shows the direction and its change. The signal indicator is based on changes in volatility and shows market entries. The indicator is equipped with several types of alerts. Can be applied to various trading ins
Gold Signal Pro
Mohamed Hassan
First 25 copies at $80, after that price becomes $149 (3 copies left) Gold Signal Pro is a powerful MT4 indicator designed to help traders spot strong price reactions in the market. It focuses on clear wick rejections , showing when price strongly rejects a level and often continues in the same direction. Gold Signal Pro is mainly built for scalping gold (XAUUSD) and works best on lower timeframes like M5 and M15 , where timing matters most. That said, it can also be used on any forex pair, a
PRO Renko System
Oleg Rodin
5 (30)
PRO Renko System 은 RENKO 차트 거래를 위해 특별히 고안된 매우 정확한 거래 시스템입니다. 이것은 다양한 거래 상품에 적용될 수있는 보편적 인 시스템입니다. 체계는 효과적으로 당신에게 정확한 반전 신호에 접근을 주는 소위 시장 소음을 중화합니다. 이 표시기는 사용하기가 매우 쉽고 신호 생성을 담당하는 매개 변수가 하나만 있습니다. 당신은 쉽게 당신의 선택의 어떤 무역 계기에 공구를 적응시킬 수 있고 renko 막대기의 크기. 나는 항상 당신이 내 소프트웨어로 수익성있게 거래 할 수 있도록 추가 지원을 제공 할 준비가되어 있습니다! 나는 당신에게 행복하고 수익성있는 거래를 기원합니다! 구매 후 저에게 연락하십시오! 내 렌코 차트 생성기를 보내드립니다. 또한 내 개인 권장 사항 및 시스템의 다른 모듈을 무료로 공유 할 것입니다!
GoldRush Trend Arrow Signal
Kirk Lee Holloway
5 (2)
GoldRush 트렌드 화살표 신호 GoldRush 트렌드 화살표 신호 지표는 XAU/USD 시장에서 고속 단기 스캘핑 트레이더를 위해 설계된 정밀한 실시간 트렌드 분석을 제공합니다. 1분 시간대에 특화되어 설계된 이 도구는 명확한 진입점을 표시하는 방향성 화살표를 제공하여 스캘퍼들이 변동성이 높은 시장 환경에서도 자신 있게 거래할 수 있도록 합니다. 이 지표는 PRIMARY 및 SECONDARY 경고 화살표로 구성됩니다. PRIMARY 신호는 추세 방향의 변화를 나타내는 흰색과 검은색 방향성 화살표이며, SECONDARY 신호는 PRIMARY 화살표가 지시하는 방향을 확인하고 잠재적인 거래 진입점을 표시하는 파란색과 빨간색 화살표입니다. 참고: 추세 방향이 변경된 후 PRIMARY 경고 화살표가 단 하나만 표시될 경우, 다수의 SECONDARY 파란색/빨간색 화살표가 표시될 수 있음을 유의해야 합니다. SECONDARY 신호는 신호 기준을 충족하는 어떤 캔들 이후에도 표시
Scalper Inside PRO
Alexey Minkov
4.74 (69)
An exclusive indicator that utilizes an innovative algorithm to swiftly and accurately determine the market trend. The indicator automatically calculates opening, closing, and profit levels, providing detailed trading statistics. With these features, you can choose the most appropriate trading instrument for the current market conditions. Additionally, you can easily integrate your own arrow indicators into Scalper Inside Pro to quickly evaluate their statistics and profitability. Scalper Inside
Trend indicator AI
Ramil Minniakhmetov
4.65 (80)
트렌드 인공 지능 지표는 실행 가능한 진입 점 및 반전 경고와 추세 식별을 결합하여 상인의 시장 분석을 향상시킬 훌륭한 도구입니다. 이 표시기는 사용자가 자신감과 정밀도로 외환 시장의 복잡성을 탐색 할 수 있도록 지원합니다 기본 신호 외에도 트렌드 인공 지능 지표는 풀백 또는 되돌림 중에 발생하는 2 차 진입 점을 식별하여 거래자가 기존 트렌드 내에서 가격 수정을 활용할 수 있도록합니다. 중요한 장점: ·작동 4 및 5 *명확한 구매 또는 판매 신호 *다시 칠하지 않습니다 *모든 자산에서 작동 나는 전보 사기에 개 또는 세트를 판매하지 않도록주의. 모든 설정은 블로그에 여기에 무료.  중요! 지침 및 보너스를 얻기 위해 구입 후 즉시 저에게 연락! 진짜 가동 감시는 뿐 아니라 나의 다른 제품 여기에서 찾아낼 수 있습니다: https://www.mql5.com/en/users/mechanic/seller&nbsp ; 설정 및 입력: 모든 자산에 대해 기본 설정을 권
Trend Screener
STE S.S.COMPANY
4.79 (95)
트렌드 표시기, 트렌드 트레이딩 및 필터링을 위한 획기적인 고유 솔루션, 하나의 도구 안에 내장된 모든 중요한 트렌드 기능! Forex, 상품, 암호 화폐, 지수 및 주식과 같은 모든 기호/도구에 사용할 수 있는 100% 다시 칠하지 않는 다중 시간 프레임 및 다중 통화 표시기입니다. 기간 한정 특가: 지원 및 저항 스크리너 지표는 단 100달러에 평생 제공됩니다. (원래 가격 50 달러) (제안 연장) Trend Screener는 차트에 점이 있는 화살표 추세 신호를 제공하는 효율적인 지표 추세 추종 지표입니다. 추세 분석기 표시기에서 사용할 수 있는 기능: 1. 트렌드 스캐너. 2. 최대 이익 분석이 있는 추세선. 3. 추세 통화 강도 측정기. 4. 경고가 있는 추세 반전 점. 5. 경고가 있는 강력한 추세 점. 6. 추세 화살표 Trend Screener Indicator가 있는 일일 분석 예, 일일 신호 성능...등은 여기에서 찾을 수 있습니다.   여기를 클릭하십시오. L
Trend Lines PRO
Roman Podpora
5 (1)
트렌드 라인즈 프로       이 지표는 시장이 실제로 어떤 방향으로 전환되는지 파악하는 데 도움이 됩니다. 실제 추세 반전 지점과 주요 시장 참여자들이 다시 진입하는 지점을 보여줍니다. 보시다시피       BOS 라인       복잡한 설정이나 불필요한 노이즈 없이 더 높은 시간대의 추세 변화와 주요 레벨을 확인할 수 있습니다. 신호는 차트에 다시 그려지지 않고 캔들이 마감된 후에도 계속 표시됩니다. VERSION MT 5     -    RFI LEVELS PRO   표시기   와 결합할 때 최대 잠재력을 발휘합니다. 지표가 보여주는 내용: 실제 변화       추세(BOS 라인) 한 번 신호가 나타나면 그 신호는 계속 유효합니다! 이는 신호를 발생시킨 후 변경될 수 있는 리페인팅 방식의 지표와 중요한 차이점입니다. 리페인팅 방식의 지표는 잠재적으로 자금 손실로 이어질 수 있습니다. 이제 더욱 높은 확률과 정확도로 시장에 진입할 수 있습니다. 또한 화살표가 나타난 후 목표가(
System Trend Pro
Aleksandr Makarov
5 (2)
System Trend Pro - This is the best trend trading indicator!!! The indicator no repaint!!!  The indicator has   MTF   mode, which adds confidence to trading on the trend (   no repaint   ). How to trade? Everything is very simple, we wait for the first signal (big arrow), then wait for the second signal (small arrow) and enter the market in the direction of the arrow. (See screens 1 and 2.) Exit on the opposite signal or take 20-30 pips, close half of it, and keep the rest until the opposite
Smc Blast Signal
Mohit Dhariwal
5 (3)
Full Fledged EA and Alert plus for alerts will also be provided in this offer along with the purchase of Indicator. Limited copies only at this price and Ea too. Grab your copy soon Alert plus for indicator with set file is kept in comment section with the image  SMC Blast Signal with FVG, BOS and trend Breakout The SMC Blast Signal is a Precise trading system for Meta Trader 4 that uses Smart Money Concepts (SMC), including Fair Value Gaps (FVG) and Break of Structure (BOS), to identify high-pr
Currency Strength Wizard
Oleg Rodin
4.84 (55)
통화 강도 마법사는 성공적인 거래를 위한 올인원 솔루션을 제공하는 매우 강력한 지표입니다. 표시기는 여러 시간 프레임의 모든 통화 데이터를 사용하여 이 또는 해당 외환 쌍의 힘을 계산합니다. 이 데이터는 특정 통화의 힘을 확인하는 데 사용할 수 있는 사용하기 쉬운 통화 지수 및 통화 전력선의 형태로 표시됩니다. 필요한 것은 거래하려는 차트에 표시기를 부착하는 것뿐입니다. 표시기는 거래하는 통화의 실제 강세를 보여줍니다. 지표는 또한 추세와 거래할 때 유리하게 사용할 수 있는 구매 및 판매 거래량 압력의 극한값을 보여줍니다. 지표는 또한 피보나치에 기반한 가능한 대상을 보여줍니다. 표시기는 PUSH 알림을 포함한 모든 유형의 알림을 제공합니다. 구매 후 연락주세요. 나는 당신과 거래 팁을 공유하고 당신에게 무료로 훌륭한 보너스 지표를 줄 것입니다! 나는 당신에게 행복하고 유익한 거래를 기원합니다!
Gold Scalper Super
Aleksandr Makarov
5 (2)
Gold Scalper Super is an easy-to-use trading system. The indicator can be used as a standalone scalping system on the M1 time frame, as well as part of your existing trading system. Bonus: when purchasing an indicator, Trend Arrow Super is provided free of charge, write to us after purchase. The indicator 100% does not repaint!!! If a signal appears, it does not disappear! Unlike indicators with redrawing, which lead to the loss of a deposit, because they can show a signal and then remove it.
IQ Gold Gann Levels
INTRAQUOTES
5 (4)
Presenting one-of-a-kind Gann Indicator for XAUUSD IQ Gold Gann Levels is a non-repainting, precision tool designed exclusively for XAUUSD/Gold intraday trading. It uses W.D. Gann’s square root method to plot real-time support and resistance levels, helping traders spot high-probability entries with confidence and clarity. William Delbert Gann (W.D. Gann) was an exceptional market analyst whose trading technique was based on a complex blend of mathematics, geometry, astrology, and ancient calcul
Pulse Scalping Line - an indicator for identifying potential pivot points. Based on this indicator, you can build an effective Martingale system. According to our statistics, the indicator gives a maximum of 4 erroneous pivot points in a series. On average, these are 2 pivot points. That is, the indicator shows a reversal, it is erroneous. This means that the second signal of the indicator will be highly accurate. Based on this information, you can build a trading system based on the Martingale
Pip Storm Signal
Camila Bernardez Camero
PIP STORM 신호 PIP STORM 은 변동성이 큰 시장 상황에서 초고빈도 실행을 위해 설계된 화살표 기반의 고급 시스템입니다. 이 시스템의 핵심 목표는 지연되거나 과도하게 사용된 인디케이터에 의존하지 않고, 실행 가능한 스캘핑 신호를 지속적으로 제공하는 것입니다. 예측하지 않고, 가격 전환 구간에 정밀하게 반응하며, 최소한의 실시간 확인 로직을 통해 마이크로 브레이크아웃과 유동성 불균형을 포착합니다. 업데이트 받기 향후 릴리스 및 공지사항을 확인하려면 공식 채널에 가입하세요: https://www.mql5.com/en/channels/signalsandindicators 스캘핑 빈도 이 도구는 조용히 사용하기 위한 것이 아닙니다. PIP STORM 은 활성 시장에서 거의 모든 캔들에 대해 공격적이고 지속적으로 신호를 생성하며, 현재의 방향을 확인하거나 중요한 되돌림을 정밀하게 감지합니다. 신호 해석 시각적으로는 단순하지만, 작동 면에서는 매우 강력합니다: 빨
Apollo SR Master
Oleg Rodin
5 (1)
Apollo SR Master는 지지/저항 구간에서의 거래를 더욱 쉽고 안정적으로 만들어 주는 특수 기능을 갖춘 지지/저항 지표입니다. 이 지표는 지역 가격의 고점과 저점을 감지하여 시간 지연 없이 실시간으로 지지/저항 구간을 계산합니다. 새롭게 형성된 저항 구간을 확인하기 위해 지표는 해당 저항 구간을 실제 매도 또는 매수 신호로 활용할 수 있음을 나타내는 특수 신호를 표시합니다. 이 경우, 저항 구간의 강도가 높아지고, 따라서 저항 구간에서의 성공적인 거래 가능성도 높아집니다. 이것이 바로 이 지표의 핵심 아이디어입니다. SR 존은 손절매와 이익실현을 더욱 쉽게 할 수 있도록 해줍니다. 신호 방향에 따라 SR 존 위 또는 아래 공간을 손절매로 활용할 수 있습니다. 또한, 반대쪽 SR 존은 잠재적 이익실현 영역으로 활용할 수 있습니다. 또한 Apollo SR Master 지표를 사용하는 모든 사용자에게 "Apollo Price Action System" 지표를 무료로 제공합니다.
Basic Harmonic Patterns Dashboard
Mehran Sepah Mansoor
5 (3)
이 대시보드는 선택한 심볼에 대해 사용 가능한 최신 고조파 패턴을 표시하므로 시간을 절약하고 더 효율적으로 사용할 수 있습니다 / MT5 버전 . 무료 인디케이터: Basic Harmonic Pattern 인디케이터 열 Symbol : 선택한 심볼이 나타납니다 Trend : 강세 또는 약세 Pattern : 패턴 유형(가틀리, 나비, 박쥐, 게, 상어, 사이퍼 또는 ABCD) Entry : 진입 가격 SL: 스톱로스 가격 TP1: 1차 테이크프로핏 가격 TP2: 2차 테이크프로핏 가격 TP3: 3차 테이크프로핏 가격 Current price: 현재 가격 Age (in bars): 마지막으로 그려진 패턴의 나이 주요 입력 Symbols : "28개 주요 통화쌍" 또는 "선택한 심볼" 중에서 선택합니다. Selected Symbols : 쉼표로 구분하여 모니터링하려는 원하는 심볼("EURUSD,GBPUSD,XAUUSD")을 선택합니다. 브로커에 쌍에 접미사 또는 접두사가 있는
현재 40% 할인 ! 초보자 또는 전문가 트레이더를 위한 최고의 솔루션! 이 대시보드 소프트웨어는 28개의 통화 쌍에서 작동합니다. 2가지 주요 지표(Advanced Currency Strength 28 및 Advanced Currency Impulse)를 기반으로 합니다. 전체 Forex 시장에 대한 훌륭한 개요를 제공합니다. 고급 통화 강도 값, 통화 이동 속도 및 모든(9) 시간대의 28 Forex 쌍에 대한 신호를 보여줍니다. 추세 및/또는 스캘핑 기회를 정확히 파악하기 위해 차트의 단일 지표를 사용하여 전체 시장을 볼 수 있을 때 거래가 어떻게 개선될지 상상해 보십시오! 잠재적인 거래를 식별하고 확인하면서 강력한 통화와 약한 통화를 더욱 쉽게 식별할 수 있도록 이 지표에 기능을 내장했습니다. 이 표시기는 통화의 강세 또는 약세가 증가 또는 감소하는지 여부와 모든 시간대에서 수행되는 방식을 그래픽으로 보여줍니다. 추가된 새로운 기능은 현재 시장 조건 변화에 적응하는
Advanced Arrow
Alfred Kamal
3.9 (39)
This indicator depends on some secrets equations to draw Signals with Stop loss and maximum 4 Take profits. There is a free EA depends on this indicator as a gift when you purchase/rent it. Features Simply it gives you entry point as Ready sign (Buy / Sell) and arrow (Buy / Sell) after candle closed, also SL line and 4 TP lines or less. Once SL-TP lines are shown with the arrow, they remains as they are until signal change. It is historical indicator. No Repaint. user manual for V5 please click
Slayer Scalping
Abdulkarim Karazon
5 (2)
이 지표는 두 가지 이익 실현 수준과 매우 엄격한 손절각에 초점을 맞추고 있습니다. 전체 아이디어는 m15 이상에서 시작하는 높은 시간대에서 시장을 스칼프하는 것입니다. 이 기간은 스프레드와 중개 수수료에 크게 영향을 받지 않기 때문입니다. 이 지표는 가격 다이버전스 전략에 기반해 매수/매도 신호를 제공하며, 강세 다이버전스 조건이 완전히 충족되면 TP/SL 수준과 함께 매수 화살표를 그립니다. 매도 화살표도 마찬가지입니다. 캔들 종간에 화살표가 출력되고 실시간으로 다시 그리그려지지 않으며, 일부 신호는 다소 늦게 나타나 지표에 의해 무시되어 경고를 주지 않습니다. 이는 특정 시장 상황(높은 변동성/뉴스 영향)에서 다이버전스의 본질입니다. 왜 효과가 있을까요? . 각 신호 뒤에 있는 좋은 전략 .라이브로 다시 도색하지 않습니다. . 어떤 쌍에도 잘 작동합니다. . 안정적인 성능을 제공합니다 추천 : . 더 긴 시간 동안 사용하세요 . 주 주기를 바꾸면 신호 품질이 달라지는데,
MetaForecast M4
Vahidreza Heidar Gholami
5 (2)
MetaForecast는 가격 데이터의 조화를 기반으로 모든 시장의 미래를 예측하고 시각화합니다. 시장이 항상 예측 가능한 것은 아니지만 가격에 패턴이 있다면 MetaForecast는 가능한 정확하게 미래를 예측할 수 있습니다. 다른 유사한 제품과 비교했을 때, MetaForecast는 시장 동향을 분석하여 더 정확한 결과를 생성할 수 있습니다. 입력 매개변수 Past size (과거 크기) MetaForecast가 미래 예측을 생성하기 위한 모델을 만드는 데 사용하는 막대의 수를 지정합니다. 모델은 선택한 막대 위에 그려진 노란색 선으로 표시됩니다. Future size (미래 크기) 예측해야 할 미래 막대의 수를 지정합니다. 예측된 미래는 핑크색 선으로 표시되며 그 위에 파란색 회귀선이 그려집니다. Degree (차수) 이 입력은 MetaForecast가 시장에서 수행할 분석 수준을 결정합니다. Degree 설명  0 차수 0의 경우, "Past size" 입력에 모든 봉우리와
Easy ICT Price Action MT4
Han Qin Lin
4.88 (8)
ICT, SMC, 스마트 머니 컨셉트(Smart Money Concept), 지지 및 저항(Support and Resistance), 추세 분석(Trend Analysis), 가격 행동(Price Action), 시장 구조(Market Structure), 주문 블록(Order Blocks), 브레이커 블록(Breaker Blocks), 모멘텀 변화(Momentum Shift), 강한 불균형(Strong Imbalance), HH/LL/HL/LH, 공정 가치 격차(Fair Value Gap), FVG, 프리미엄 및 디스카운트 영역(Premium & Discount Zones), 피보나치 리트레이스먼트(Fibonacci Retracement), OTE, 매수 측 유동성(Buyside Liquidity), 매도 측 유동성(Sellside Liquidity), 유동성 공백(Liquidity Voids), 시장 세션(Market Sessions), NDOG, NWOG, 실버 불릿(Silv
이 지표를 구매하면 제 프로페셔널 트레이드 매니저를 무료로 드립니다. 우선 이 거래 시스템이 리페인팅, 리드로잉 및 레이그 인디케이터가 아니라는 점을 강조하는 것이 중요합니다. 이는 수동 및 로봇 거래 모두에 이상적인 것으로 만듭니다. 온라인 강좌, 설명서 및 프리셋 다운로드. "스마트 트렌드 트레이딩 시스템 MT5"은 새로운 및 경험이 풍부한 트레이더를 위해 맞춤형으로 제작된 종합적인 거래 솔루션입니다. 10개 이상의 프리미엄 인디케이터를 결합하고 7개 이상의 견고한 거래 전략을 특징으로 하여 다양한 시장 조건에 대한 다목적 선택이 가능합니다. 트렌드 추종 전략: 효과적인 트렌드 추이를 타기 위한 정확한 진입 및 손절 관리를 제공합니다. 반전 전략: 잠재적인 트렌드 반전을 식별하여 트레이더가 범위 시장을 활용할 수 있게 합니다. 스캘핑 전략: 빠르고 정확한 데이 트레이딩 및 단기 거래를 위해 설계되었습니다. 안정성: 모든 인디케이터가 리페인팅, 리드로잉 및 레이그가 아니므로 신뢰
Advanced Currency Strength28 Indicator
Bernhard Schweigert
4.91 (657)
현재 40% 할인 초보자 또는 전문가 트레이더를 위한 최고의 솔루션! 이 지표는 우리가 독점 기능과 새로운 공식을 통합했기 때문에 독특하고 고품질이며 저렴한 거래 도구입니다. 단 하나의 차트로 28 Forex 쌍의 통화 강도를 읽을 수 있습니다! 새로운 추세 또는 스캘핑 기회의 정확한 트리거 포인트를 정확히 찾아낼 수 있기 때문에 거래가 어떻게 개선될지 상상해 보십시오. 사용 설명서: 여기를 클릭  https://www.mql5.com/en/blogs/post/697384 그것이 첫 번째, 원본입니다! 쓸모없는 지망생 클론을 사지 마십시오. 더 스페셜  강력한 통화 모멘텀을 보여주는 하위 창의 화살표 GAP가 거래를 안내합니다! 기본 또는 호가 통화가 과매도/과매도 영역(외부 시장 피보나치 수준)에 있을 때 개별 차트의 기본 창에 경고 표시가 나타납니다. 통화 강도가 외부 범위에서 떨어질 때 풀백/반전 경고. 교차 패턴의 특별 경고 추세를 빠르게 볼 수 있는 다중 시간
Special offer : ALL TOOLS , just $35 each! New tools   will be   $30   for the   first week   or the   first 3 purchases !  Trading Tools Channel on MQL5 : Join my MQL5 channel to update the latest news from me 다중 시간 프레임의 체적 주문 블록 지표는 주요 시장 참가자들이 주문을 축적하는 중요한 가격 영역을 식별하여 시장 행동에 대한 더 깊은 통찰을 원하는 트레이더들을 위해 설계된 강력한 도구입니다. 이 영역들은 체적 주문 블록으로 알려져 있으며, 잠재적 지지 및 저항 구역으로 작용해 정보에 입각한 거래 결정에 중요한 이점을 제공합니다. MT5 버전 보기:   Volumetric Order Blocks MT5 Multi Timeframe See more products at:   https://www.mql5.com
제작자의 제품 더 보기
MACD Message
Dmitriy Moshnin
MACD Message is an analogue of the MACD Alert for the MetaTrader 4 terminal with more advanced functionality: Parameters 'Averaging Method' and 'Price Type' ( MA method and Apply to ) are displayed in the settings window. It gives an advantage of monitoring convergence/divergence of all types of Moving Average (Simple Averaging, Exponential, Smoothed and Linear Weighted) and by any price (Closing Price, Opening Price, the Maximum Price for the Period, the Minimum Price for the Period, Median Pri
Symbol Profit
Dmitriy Moshnin
This is an indicator for MetaTrader 4. It is small, nice and compactly sized for a chart window, while conveniently displaying all the necessary information: open position volumes and total profit on them. Font size, corner and color can be set according to your preferences. By default, a positive position is displayed in green and a negative one is shown in red. Happy Trading. Indicator Parameters Symbol - name of the current symbol in the window: Show – display, Hide – do not display; Profit
Unlike the standard indicator, Stochastic Oscillator Message ( please see the description and video ) features an alert system that informs you of changes in the market situation using twenty signals: the Main line and Signal line cross in the area above/below the levels of extremum (below 20%; above 80%); the Main line and Signal line cross within the range of 20% to 80%; the Main line crosses the levels of extremum; the Main line crosses the 50-level; divergence on the last bar. Parameters of
RSI TrendLine Divergency Message is an indicator for the MetaTrader 4 trading platform. Unlike the original indicator, this three in one version has a system of alerts that inform on market situation changes. It consists of the following signals: when the Main line crosses the levels of extreme zones and 50% level; when the Main line crosses the Trend line in the indicator window; divergence on the last bar. Parameters of levels of extremum, 50-level and divergence are adjustable. Parameters La
MACD Color
Dmitriy Moshnin
MACD Color ( please see the description and video ) is an indicator for the MetaTrader 4 trading platform that is similar to MACD Message . Unlike the standard indicator, it changes the bar edge color when there is a change in the market situation - a change in the trend strength or a change in the inclination of the main EMA which represents the zero level - it changes the color of the zero level (this parameter can be disabled in the settings). Take a look at how the indicator can be used in a
The Four Moving Averages indicator ( please see the description and video ), a version of Four Moving Averages Message , concurrently displays four Moving Averages with default settings in the main chart window: Green and Red ones represent a short-term trend, Red and Blue ones - mid-term trend, while Blue and Yellow ones - long-term trend. You can change the moving average settings and colors. However, these parameters have been configured so that to allow trading on all time frames. Take a loo
The Four Moving Averages Message indicator ( please see the description and video ), a version of Four Moving Averages , concurrently displays four Moving Averages with default settings in the main chart window: Green and Red ones represent a short-term trend, Red and Blue ones - mid-term trend, while Blue and Yellow ones - long-term trend. You can change the moving average settings and colors. However, these parameters have been configured so that to allow trading on all time frames. The built-
The Display Stochastic System indicator for the MetaTrader 4 trading platform ( see description (in Russian) ) is compactly sized for a chart window, while displaying Stochastic indicator results for all time frames in a single window. Parameters for each time frame are set separately. Font size, corner and color can be set according to your preferences. By default, a buy signal is green and a sell signal is red. The overbought market is dark red (prepare to sell -> wait for the red color). The
The Display ADX System indicator for the MetaTrader 4 trading platform ( see description (in Russian) ) is compactly sized for a chart window, while displaying ADX indicator results for all time frames in a single window. Parameters for each time frame are set separately. Font size, corner and color can be set according to your preferences. By default, colors of time frame names are as follows: no trend - white, bullish trend - green, bearish trend - red. If the ADX is rising on the last three b
The Level Moving Averages indicator ( see the description and video ) does not draw the Moving Average line in the chart window but marks the Moving Average level on all time frames in accordance with the specified parameters. The level move frequency corresponds to the TimeFrame parameter value specified. The advantage of this indicator lies in the fact that it offers the possibility of monitoring the interaction between the price and the MA of a higher time frame on a lower one (e.g., the MA l
The Level S Moving Averages indicator ( see the description and video ) does not draw the Moving Average line in the chart window but marks multiple levels (such as close, highs and lows of any bar on the time frames from M1 to D1, W1, MN - strong levels) of the Moving Average on all time frames in accordance with the specified parameters. The level move frequency corresponds to the TimeFrame parameter value specified. The advantage of this indicator lies in the fact that it offers the possibili
The Level Moving Averages Message indicator ( see the description and video ) does not draw the Moving Average line in the chart window but marks the Moving Average level on all time frames in accordance with the specified parameters. The level move frequency corresponds to the TimeFrame parameter value specified. The advantage of this indicator lies in the fact that it offers the possibility of monitoring the interaction between the price and the MA of a higher time frame on a lower one (e.g.,
Lot Calculation
Dmitriy Moshnin
Lot size calculator ( see the description ) calculates the lot size based on percent of free margin, as well as profit, loss and P/L ratio for a planned position by moving horizontal levels in the chart window. More advanced analog of Lot Calculation is Profit Factor indicator.
The Display Trend Moving Averages System indicator ( see its description ) shows information about direction of trends H1, H4, D1, W1, MN on all timeframes in one window, so that you can track changes in the average price before the oldest bar closes. A trend unit is a Moving Average with period "1" of the close of the oldest bar (H1, H4, D1,  W1, MN). The indicator recalculates values of older bars for internal bars and draws a trend slope in the chart window as colored names of time intervals:
ADX Message
Dmitriy Moshnin
Отличается от стандартного индикатора дополнительным набором настроек и встроенной системой оповещений. Индикатор может подавать сигналы в виде алерта ( Alert ), комментария в левый верхний угол главного окна графика ( Comment ), уведомления на мобильную версию терминала ( Mobile МТ4 ), электронный почтовый ящик ( Gmail ).  Параметры индикатора Period — период расчета индикатора; Method — выбор метода усреднения: простой, экспоненциальный, сглаженный, линейно-взвешенный; Apply to — выбор использ
The Two Moving Averages indicator concurrently displays two Moving Averages with default settings in the main chart window: Green and Red lines that represent a short-term trend. You can change the moving average settings and colors. However, these parameters have been configured so that to allow trading on all timeframes. Take a look at how the Moving Averages lines can be used in a profitable multi-currency Trading Strategy on all time frames, that is also suitable for trading in your mobile t
The Three Moving Averages indicator concurrently displays three Moving Averages with default settings in the main chart window: Green and Red lines represent a short-term trend, Red and Blue lines - long-term trend. You can change the moving average settings and colors. However, these parameters have been configured so that to allow trading on all timeframes. Take a look at how the Moving Averages lines can be used in a profitable multi-currency Trading Strategy on all time frames, that is also
The alerting system for the MetaTrader 4 platform 'Two Moving Average Message' consists of two moving average lines with individual parameters. The indicator can generate alerts ( AlertMessage )б display a comment in the upper left corner of the main chart window ( CommentMessage ), send notifications to the mobile terminal version ( MobileMessage ), send emails ( GmailMessage ) and play two different sounds at the intersection of lines upwards or downwards. Parameters Language – choose language
Profit Factor
Dmitriy Moshnin
The Profit Factor indicator calculates one of the three parameters: 1 - market entry level (in the 'Calculate the' parameter - Market Open Trade), 2 - the Stop Loss level (Calculate the - Market Price Loss), 3 - the Take Profit level (Calculate the - Market Price Profit) - with a desired profit/loss ratio (Profit Factor), as well as the lot size (trade volume) according to the value of the risk percentage of available funds specified in the settings (a simpler analog is the Lot Calculation indic
MACD Converter
Dmitriy Moshnin
MACD Converter is an analogue of the MACD Message with more advanced functionality: It has two signal lines: Signal Line 1 and Line 2, bar outlines are colored according to Line 1, it also triggers the trend notifications. MACD Converter converts the parameters of Fast MA, Slow MA and Signal Line 1 and Line 2 lines from the interval specified in the settings (Convert Time Frame) to smaller timeframes. This allows receiving a signal for making a decision within the specified (Convert Time Frame)
LTT Range System
Dmitriy Moshnin
Индикатор Форекс LTT Range System показывает на графике средние диапазоны движения рыночной цены за периоды M 15, H 1, H 4, D 1, W 1, MN 1.  Верхняя и нижняя границы диапазонов рассчитываются от цены открытия бара. Пивот – середина между ценой открытия бара и границей диапазона: если рыночная цена находится выше цены открытия бара – метка пивота располагается между ценой открытия бара и верхней меткой диапазона, если рыночная цена находится ниже цены открытия бара – метка пивота располагается ме
Parabolic Converter is and analogue of the Parabolic indicator for МТ4 which can automatically recalculate parameters of Time Frame specified in settings for lower time periods. It has a Notification System which triggers when the price movement direction is changed. For example: if we set Time Frame 1 Hour to H1 and M30, M15, M5 and M1 contained therein, we can see the indicator's readings corresponding to H1 (fig.). At that, if we add one more Parabolic on the same chart (of several charts) wi
RSI Converter
Dmitriy Moshnin
Relative Strength Index with advanced functionality recalculates (converts) the averaging period in accordance with the value of parameter Time Frame for lower chart time intervals (Multi-TimeFrame (MTF)). Unlike the standard indicator, RSI converter includes an alert system that notifies about changes in market situation, it consists of the following signals: Main line crosses levels of extreme zones (30%, 70%) and the level of 50%; The main line crosses one or two trendlines in the indicator w
Commodity Channel Index Message is an indicator for the MetaTrader 4 trading platform. Unlike the original indicator, this three in one version has a system of alerts that inform on market situation changes. It consists of the following signals: when the Main line crosses the levels of extreme zones and 50% level; when the Main line crosses the Trend line in the indicator window; Divergence on the last bar. Values of the middle and extreme levels and divergence zones are customizable. Parameter
MACD TrendMA
Dmitriy Moshnin
The MACD TrendMA indicator is a trading system developed on the basis of the MACD indicator popular among many traders, and which is based on measuring the inclination (trend) angle of the moving averages, while measuring the ratio (convergence/divergence) between them. The signal for entering/exiting the market is the frame of the bars colors and color of the MACD TrendMA histogram according to the trend, which can be customized in the properties window of the indicator - in case the inclinatio
MACD Temp
Dmitriy Moshnin
MACD Temp is a system of two oscillators, which allows to track the price changes of the Fast and Slow periods in case of their convergence/divergence. The bar border is colored in accordance with the MACD trend, while the color of the histogram changes when the values of the Momentum indicators cross the level of 100, for respective periods: Fast Moving Average (Fast Momentum), Slow Moving Average (Slow Momentum), selectively or for both values (the mode is to be chosen in the indicator propert
MACD CloseBars
Dmitriy Moshnin
The MACD CloseBars indicator is a trading system based on the MACD indicator popular among many traders, which is built on the principle of bars closing above the moving averages selected in the indicator settings. The signal for entering/exiting the market is the frame of the bars colors according to the trend: in case the bars in the main window of the chart are closed above/below the Fast Moving Average, Slow Moving Average individually or both together. Indicator Parameters Fast Moving Aver
MACD ColorBars
Dmitriy Moshnin
MACD ColorBars paints bar frames according to a trend, as well as changes the histogram color when MACD bars are rising or falling (if Color Bars is enabled in the inputs window). The growth of bars indicates a divergence between the fast and slow moving averages, while the decrease indicates their convergence. Parameters Fast Moving Average - period of the fast moving average; Slow Moving Average - period of the slow moving average; MA method - moving average smoothing method (simple, exponent
MACD Volume
Dmitriy Moshnin
The MACDVolume indicator is a trading system based on the increase in tick volumes in bars, which match the trend. Indicator Parameters Fast Moving Average - period of the fast moving average; Slow Moving Average - period of the slow moving average; MA method - averaging method of the moving averages (simple averaging, exponential, smoothed and linear-weighted); Apply to - applied price of the moving averages (Close, Open, High for the period, Low for the period, Median, Typical and Linear-Weig
MACD BBands
Dmitriy Moshnin
MACD BBands is a trading system based on MACD and Bollinger Bands placed in a single window. The indicator shows moving average slope angle (trend) change, compares their ratio (convergence/divergence) and allows sorting out signals using Bollinger Bands. The indicators are calibrated in such a way that the middle Bollinger Bands line is the zero level of the MACD indicator. Parameters Period - Bollinger Bands period; Deviations - number of standard deviations; Shift - shift relative to price;
필터:
리뷰 없음
리뷰 답변