MACD Temp
- 지표
-
Dmitriy Moshnin
 Торговать нужно так, чтобы не было мучительно больно за бесцельно вложенные деньги...
 - 버전: 1.1
- 업데이트됨: 20 11월 2021
- 활성화: 5
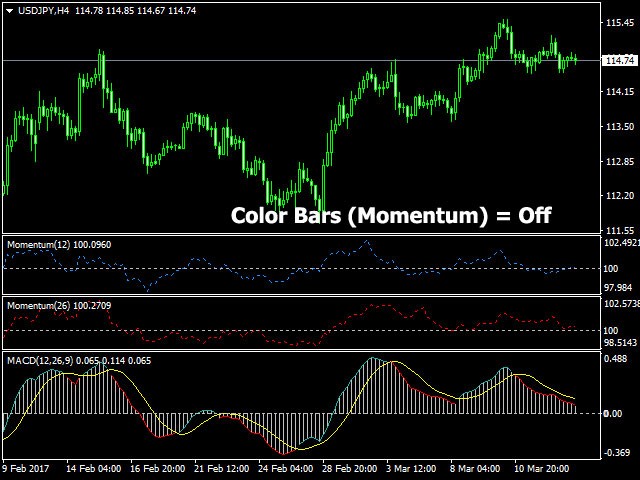
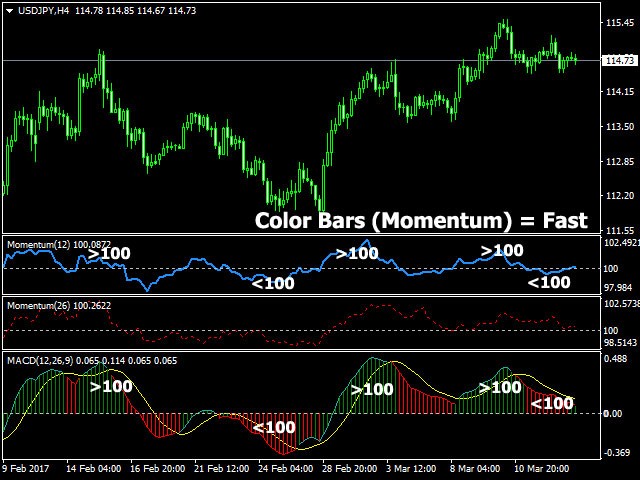
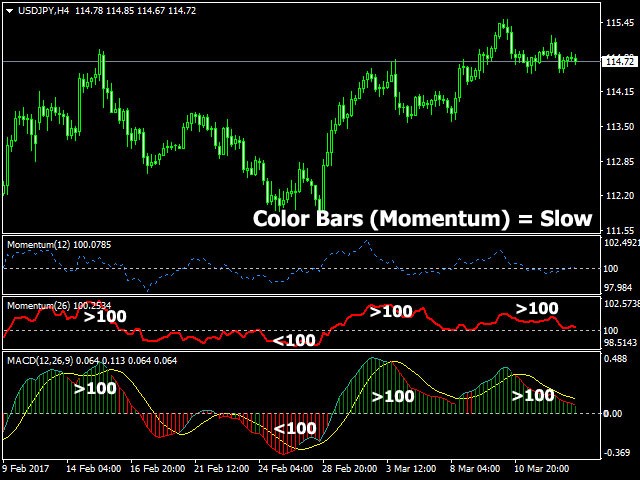
MACD Temp is a system of two oscillators, which allows to track the price changes of the Fast and Slow periods in case of their convergence/divergence. The bar border is colored in accordance with the MACD trend, while the color of the histogram changes when the values of the Momentum indicators cross the level of 100, for respective periods: Fast Moving Average (Fast Momentum), Slow Moving Average (Slow Momentum), selectively or for both values (the mode is to be chosen in the indicator properties window). The signal occurs when the color of the bar borders matches the color of MACD bars.
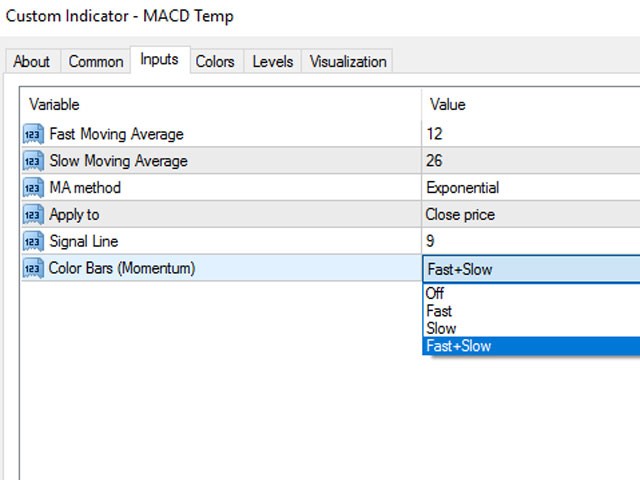
Indicator Parameters
- Fast Moving Average - period of the fast moving average;
- Slow Moving Average - period of the slow moving average;
- MA method - averaging method of the moving averages (simple averaging, exponential, smoothed and linear-weighted);
- Apply to - applied price of the moving averages (Close, Open, High for the period, Low for the period, Median, Typical and Linear-Weighted);
- Signal Line - period of the signal line;
- Color Bars (Momentum) – change the color of the indicator bars when Fast Momentum and/or Slow Momentum cross the level of 100.
More functional versions of the indicator: MACD Message and MACD Converter.
Happy trading!

사용자가 평가에 대한 코멘트를 남기지 않았습니다