Chart Pattern Scanner Breakout Stats

All classic chart patterns, with a track record. The indicator finds double and triple tops and bottoms, head & shoulders and inverse head & shoulders, ascending, descending and symmetrical triangles, rising and falling wedges, flags, pennants, rectangles and 1-2-3 reversals on your chart and on dozens of symbols and timeframes at once. Every pattern is drawn with its neckline or boundary lines, the breakout level, the invalidation (stop) level and the measured-move target - and the panel shows how often that pattern actually reached its target on this symbol and timeframe: target-hit rate, stop rate and average result in R, measured with exactly the same non-repainting rules as the live signals.

The complete manual is on this page: no private messages needed. Example set files are listed at the end.

Why it is different

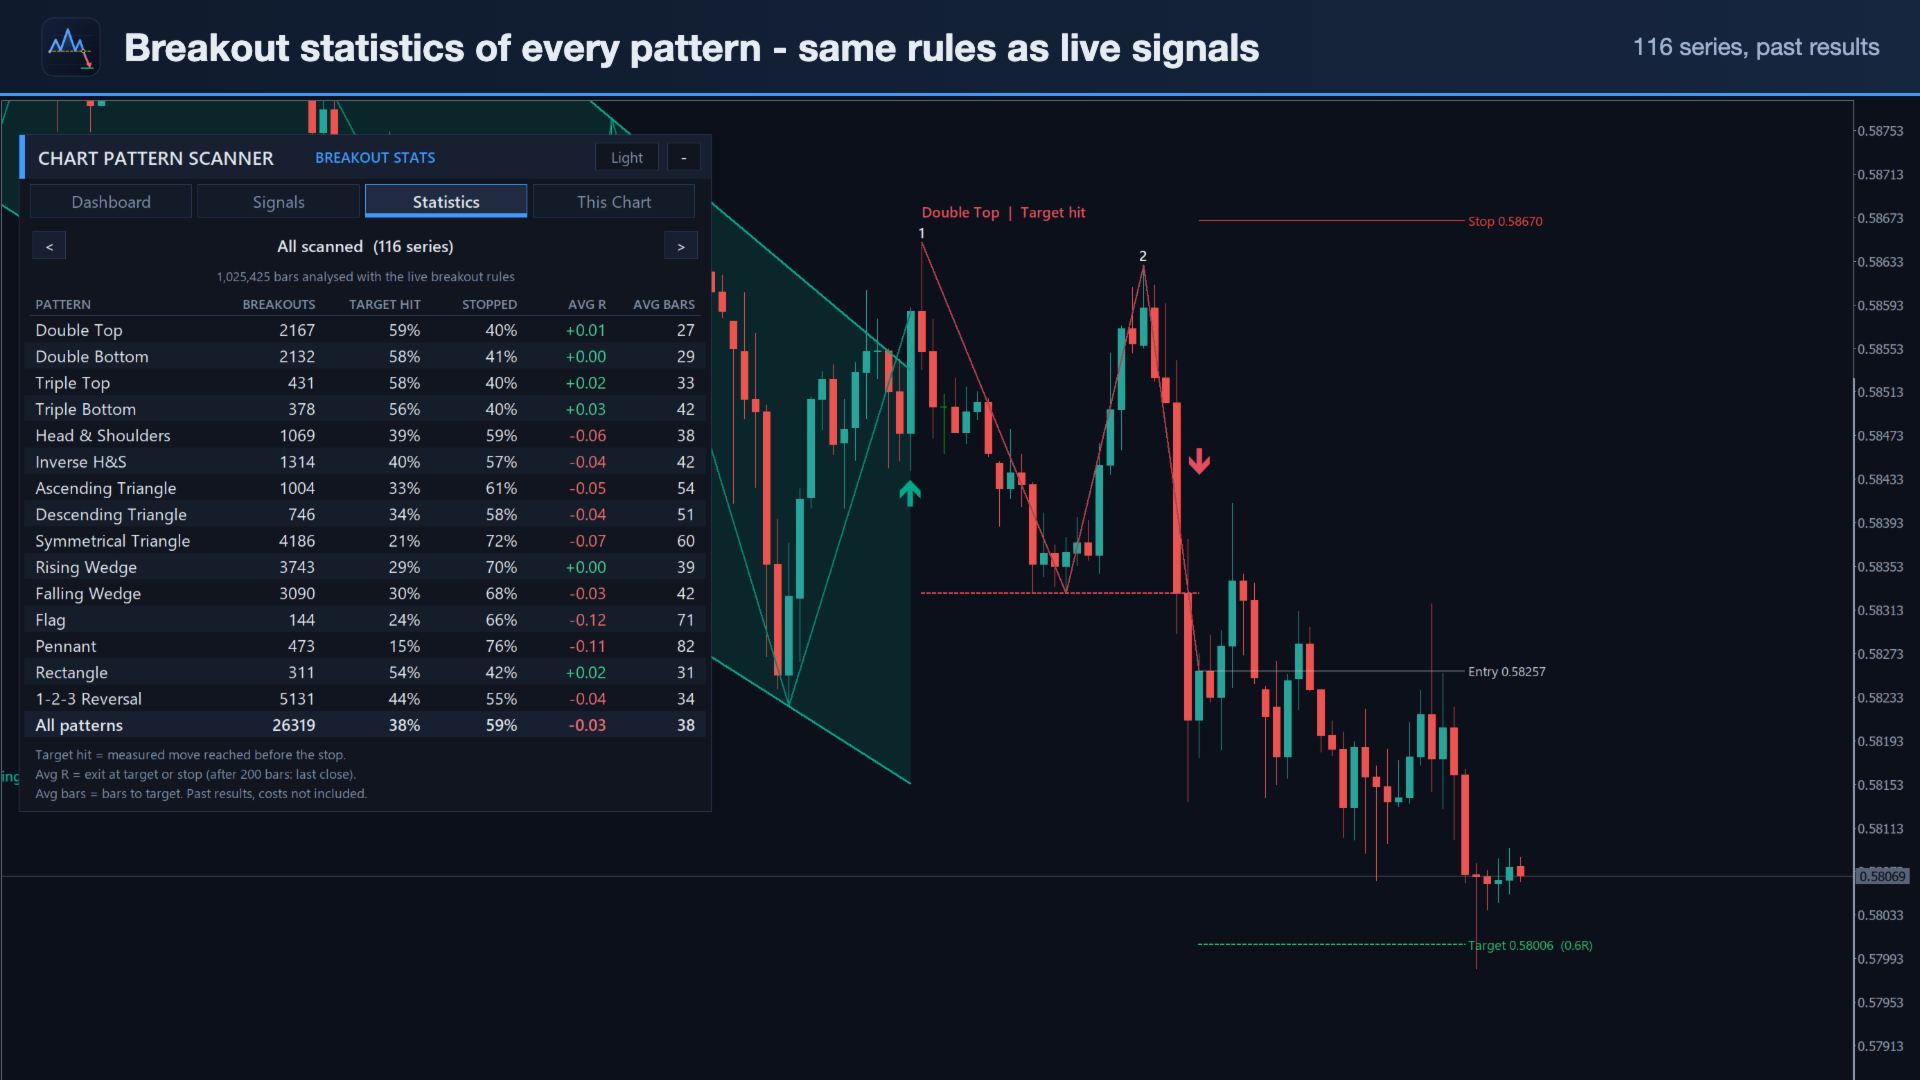
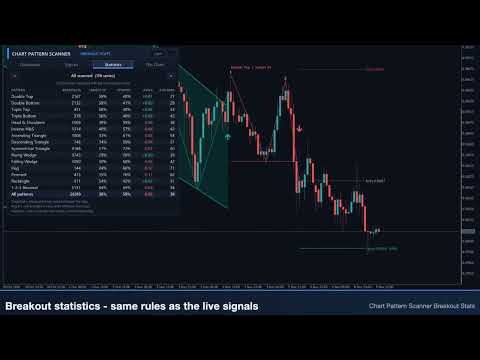
  • Breakout statistics built in. For each of the 15 patterns, on this chart, on every dashboard symbol and timeframe and on all of them together: number of breakouts, how many reached the measured move before the stop, how many were stopped, the average result in R and the average number of bars to the target. Every signal shows the target-hit rate of that pattern on that symbol next to it.
  • Written breakout rules, no repainting. A pattern is shown as forming once its swings are confirmed, and becomes a breakout only on a closed bar beyond the neckline or boundary. From that bar on it is frozen: never moved, never deleted. A setup that fails (close beyond the invalidation side) or runs out of time simply disappears from the forming list - it is never redrawn as something else.
  • One clear level set per pattern: breakout level, stop beyond the invalidation level, one measured-move target and the reward:risk ratio.
  • All 15 classic patterns, detector, dashboard and statistics in one product, light on the terminal: a symbol is re-analysed only when it closes a new bar.

Patterns

PatternShapeBreakoutStopTarget (measured move)
Double Top / Double Bottomtwo equal peaks (troughs) with a prior trendclose beyond the neckline (the trough between them)beyond the peakspattern height
Triple Top / Triple Bottomthree equal peaks (troughs)close beyond the necklinebeyond the peakspattern height
Head & Shoulders / Inversehead clearly beyond two similar shoulders, sloped necklineclose beyond the necklinebeyond the right shoulderhead to neckline
Ascending / Descending Triangleflat resistance (support) and rising support (falling resistance)close beyond the flat sidelast swing inside the patternwidest part of the triangle
Symmetrical Trianglefalling highs, rising lowsclose beyond either linelast opposite swingwidest part
Rising / Falling Wedgeboth lines rising (falling) and convergingdown (up)last swing inside the patternwidest part
Flag / Pennantfast pole, then a parallel (flag) or converging (pennant) pausewith the polelast swing inside the patternpole length
Rectangleflat support and flat resistanceclose beyond either linelast opposite swingrectangle height
1-2-3 Reversaltrend into point 1, reaction to 2, weaker retest 3close beyond point 2beyond point 3distance 1-2

Detection and breakout rules

  • Swings come from a zigzag of confirmed pivots (a pivot needs Swing Depth bars on each side and a minimum size in ATR). Two pattern sizes are searched by default (depth 5 and 10).
  • Equal peaks and flat lines use a tolerance in % of the pattern height; patterns must be at least Minimum Pattern Height × ATR tall. Reversals need a prior trend into the pattern.
  • Triangles, wedges and rectangles need five touches (three on one line). Flags and pennants need a pole at least twice the flag height that is not retraced by more than 50 %.
  • A breakout is the first closed bar beyond the line, within the breakout window (pattern width, and before the apex of a triangle or wedge). A close beyond the invalidation side first, or a new extreme of the last swing, cancels the setup. A breakout bar that has already covered half of the target is skipped.
  • Entry = close of the breakout bar. Stop = invalidation level + 0.2 ATR (at least 0.3 ATR from the entry). Target = breakout level ± measured move × Target.
  • Outcome: the target hit before the stop is a win, the stop first is a loss, a bar touching both counts as a loss; after Max Bars to resolve the result is the last close in R.

Dashboard

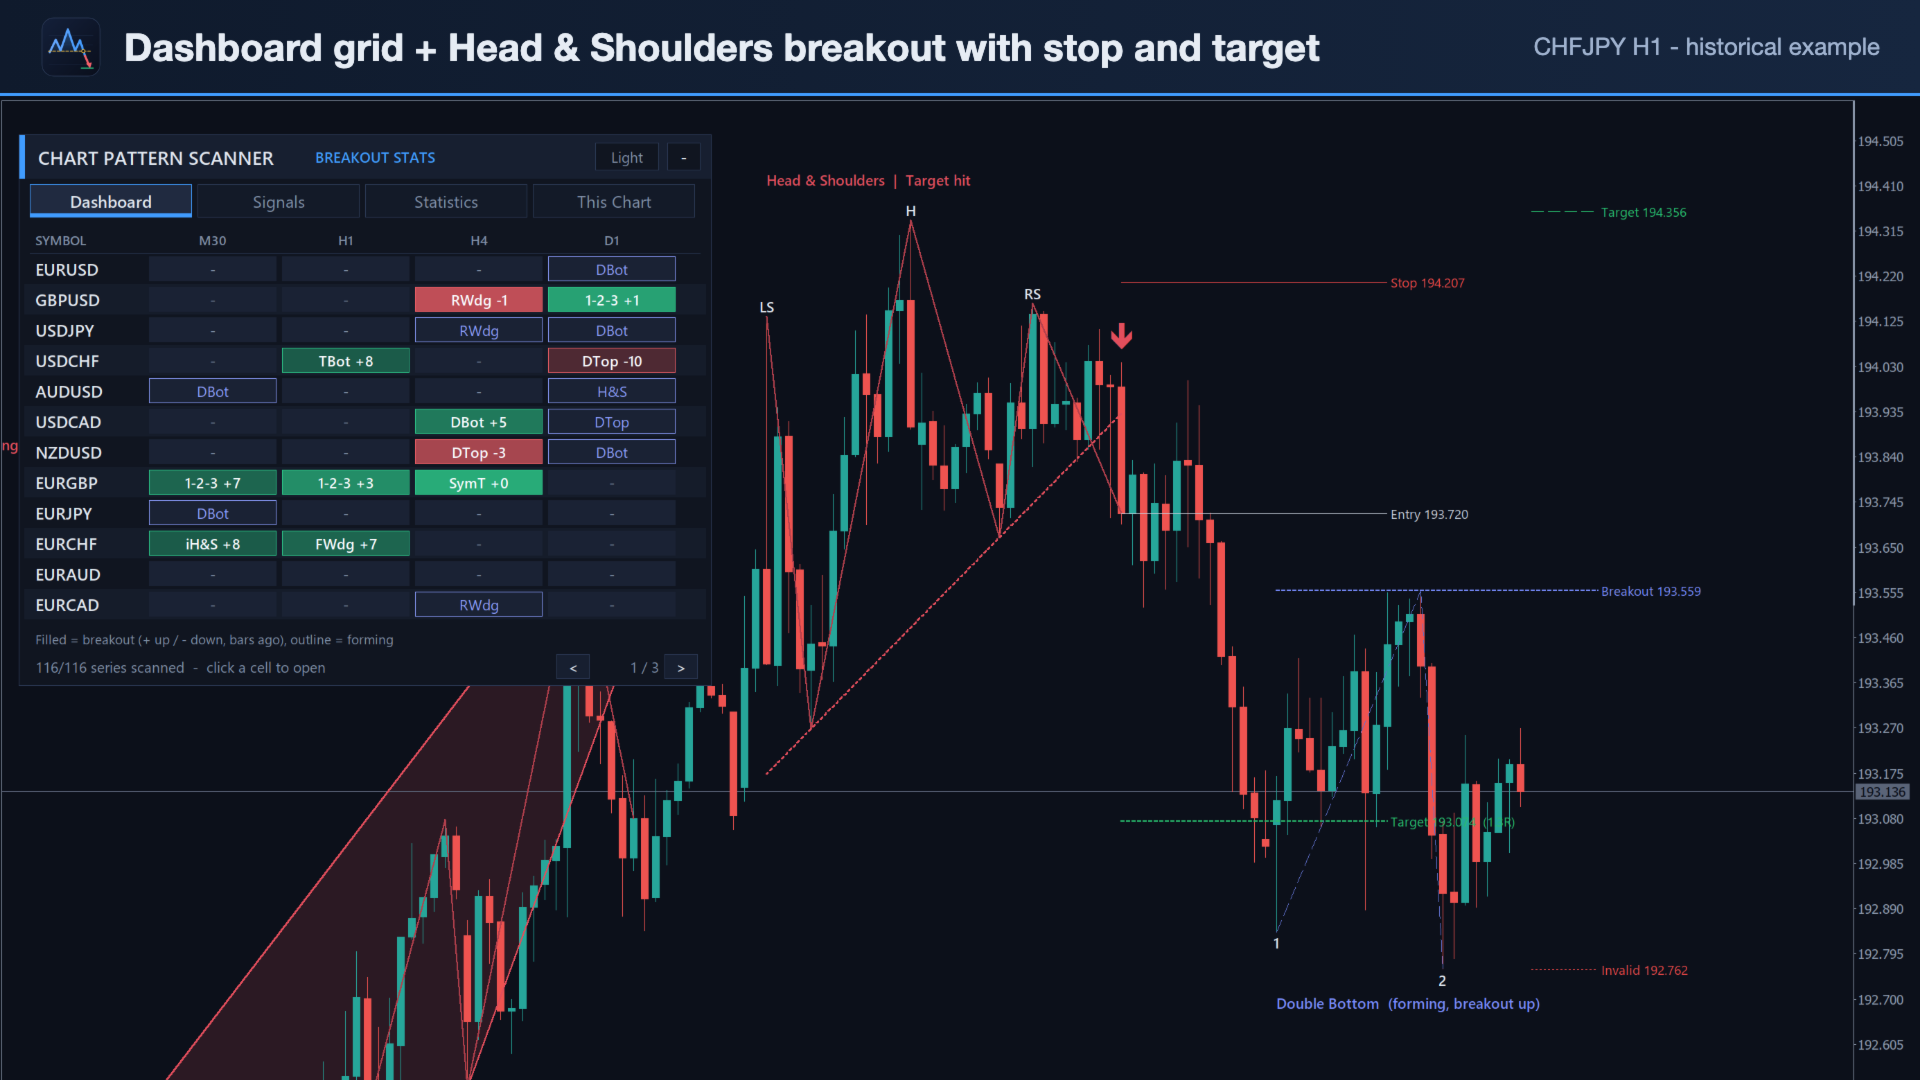
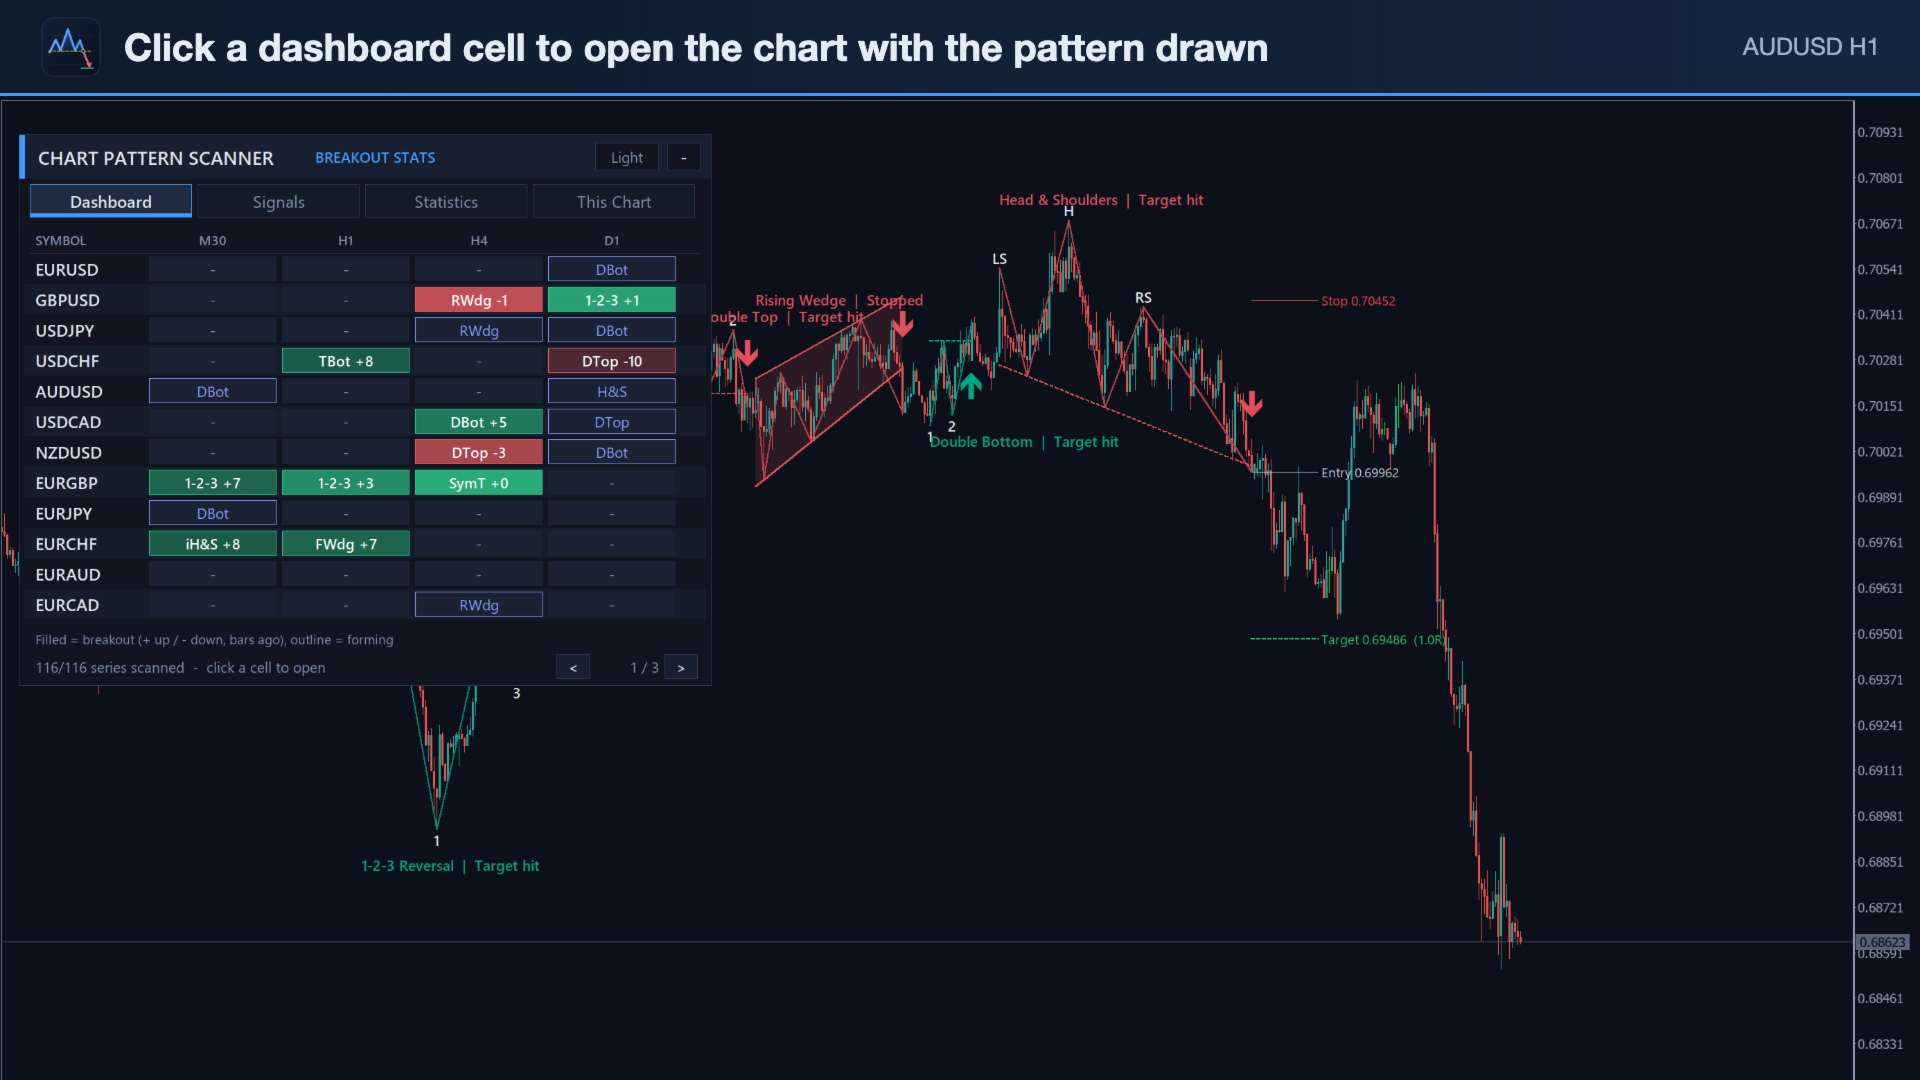
A grid with one row per symbol and one column per timeframe (default M30, H1, H4, D1 and 28 pairs + gold; any list works, broker suffixes such as .a or m are found automatically). A filled cell is a breakout: green up, red down, with the pattern code and the bars since the breakout; the colour fades as it ages. An outlined cell is a forming pattern. Hover a cell for details and the statistics of that pattern on that symbol; click a cell to open the chart (or switch this chart) with the pattern, levels and target drawn.

Signals tab

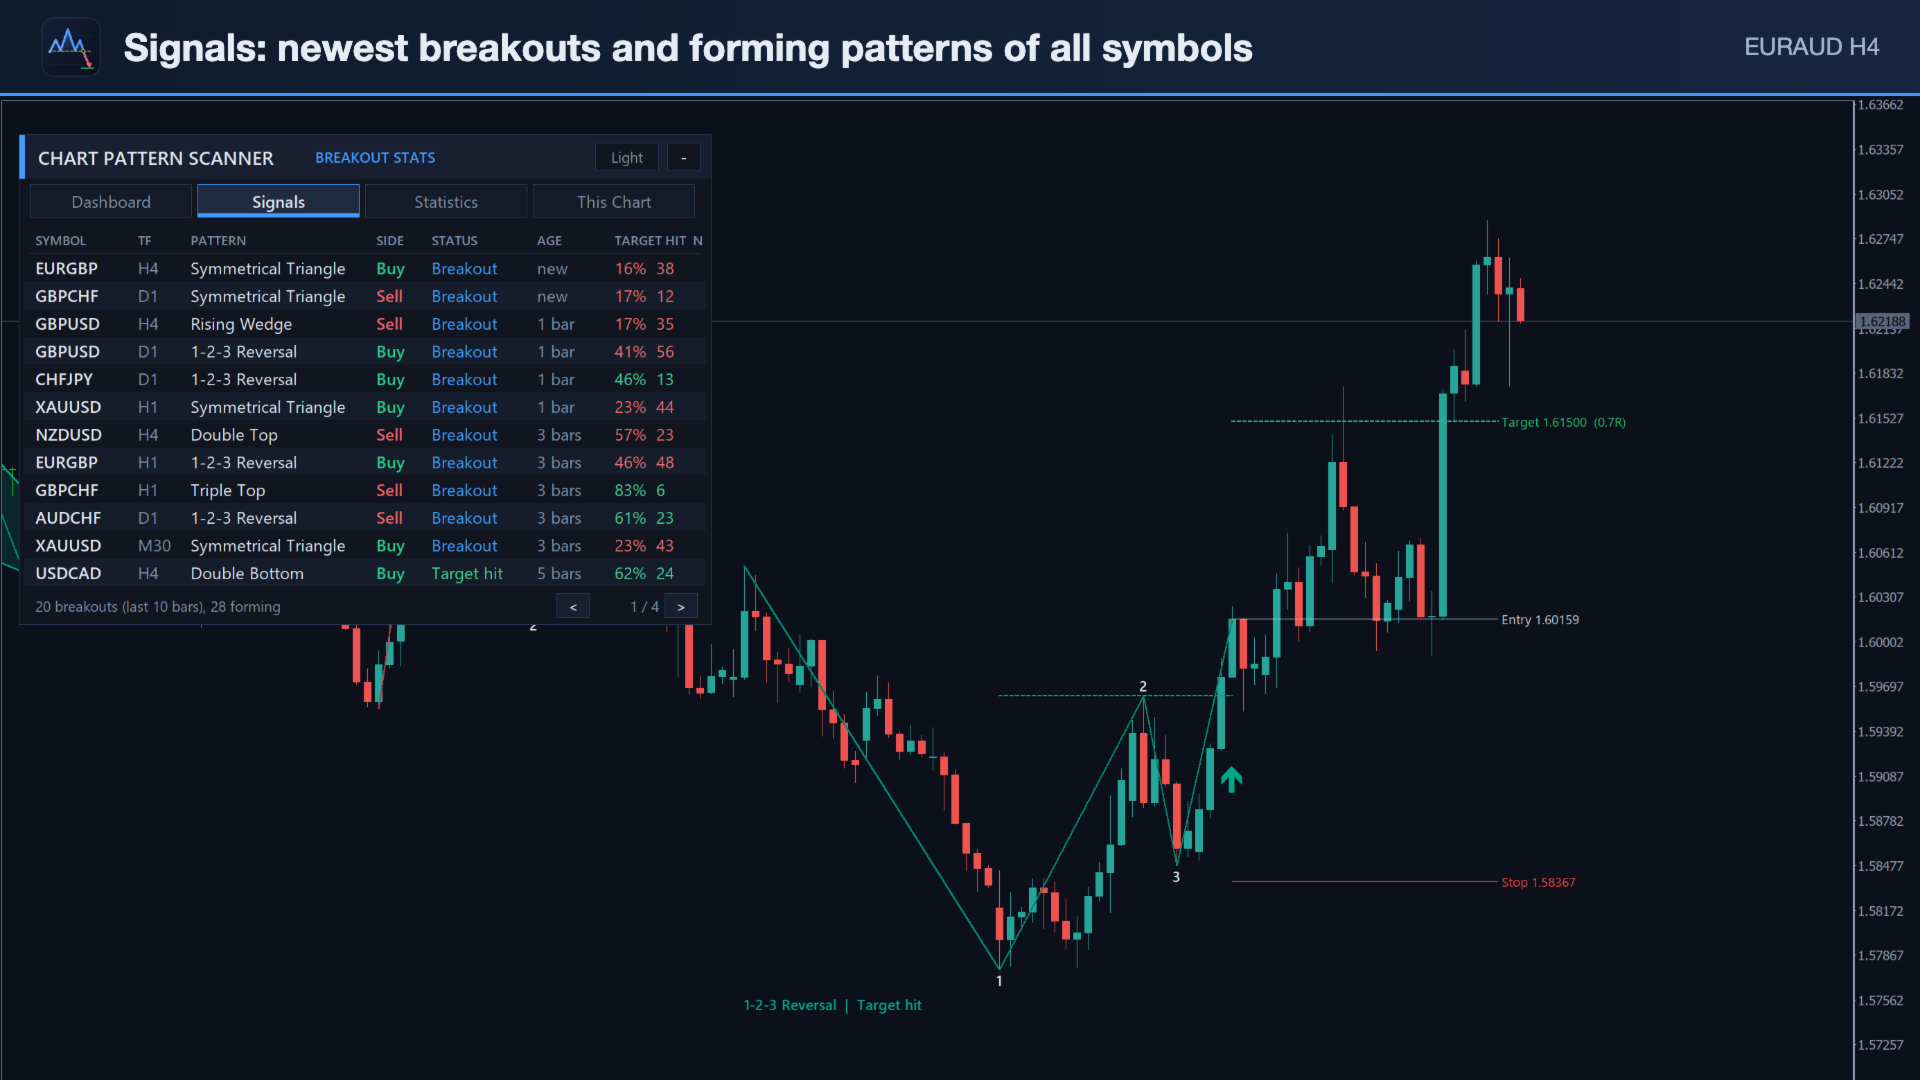
The newest breakouts and forming patterns of all dashboard symbols in one sorted list: symbol, timeframe, pattern, side, status (breakout / target hit / stopped / forming), age and the target-hit rate with the number of cases. Click a row to open the chart.

Statistics tab

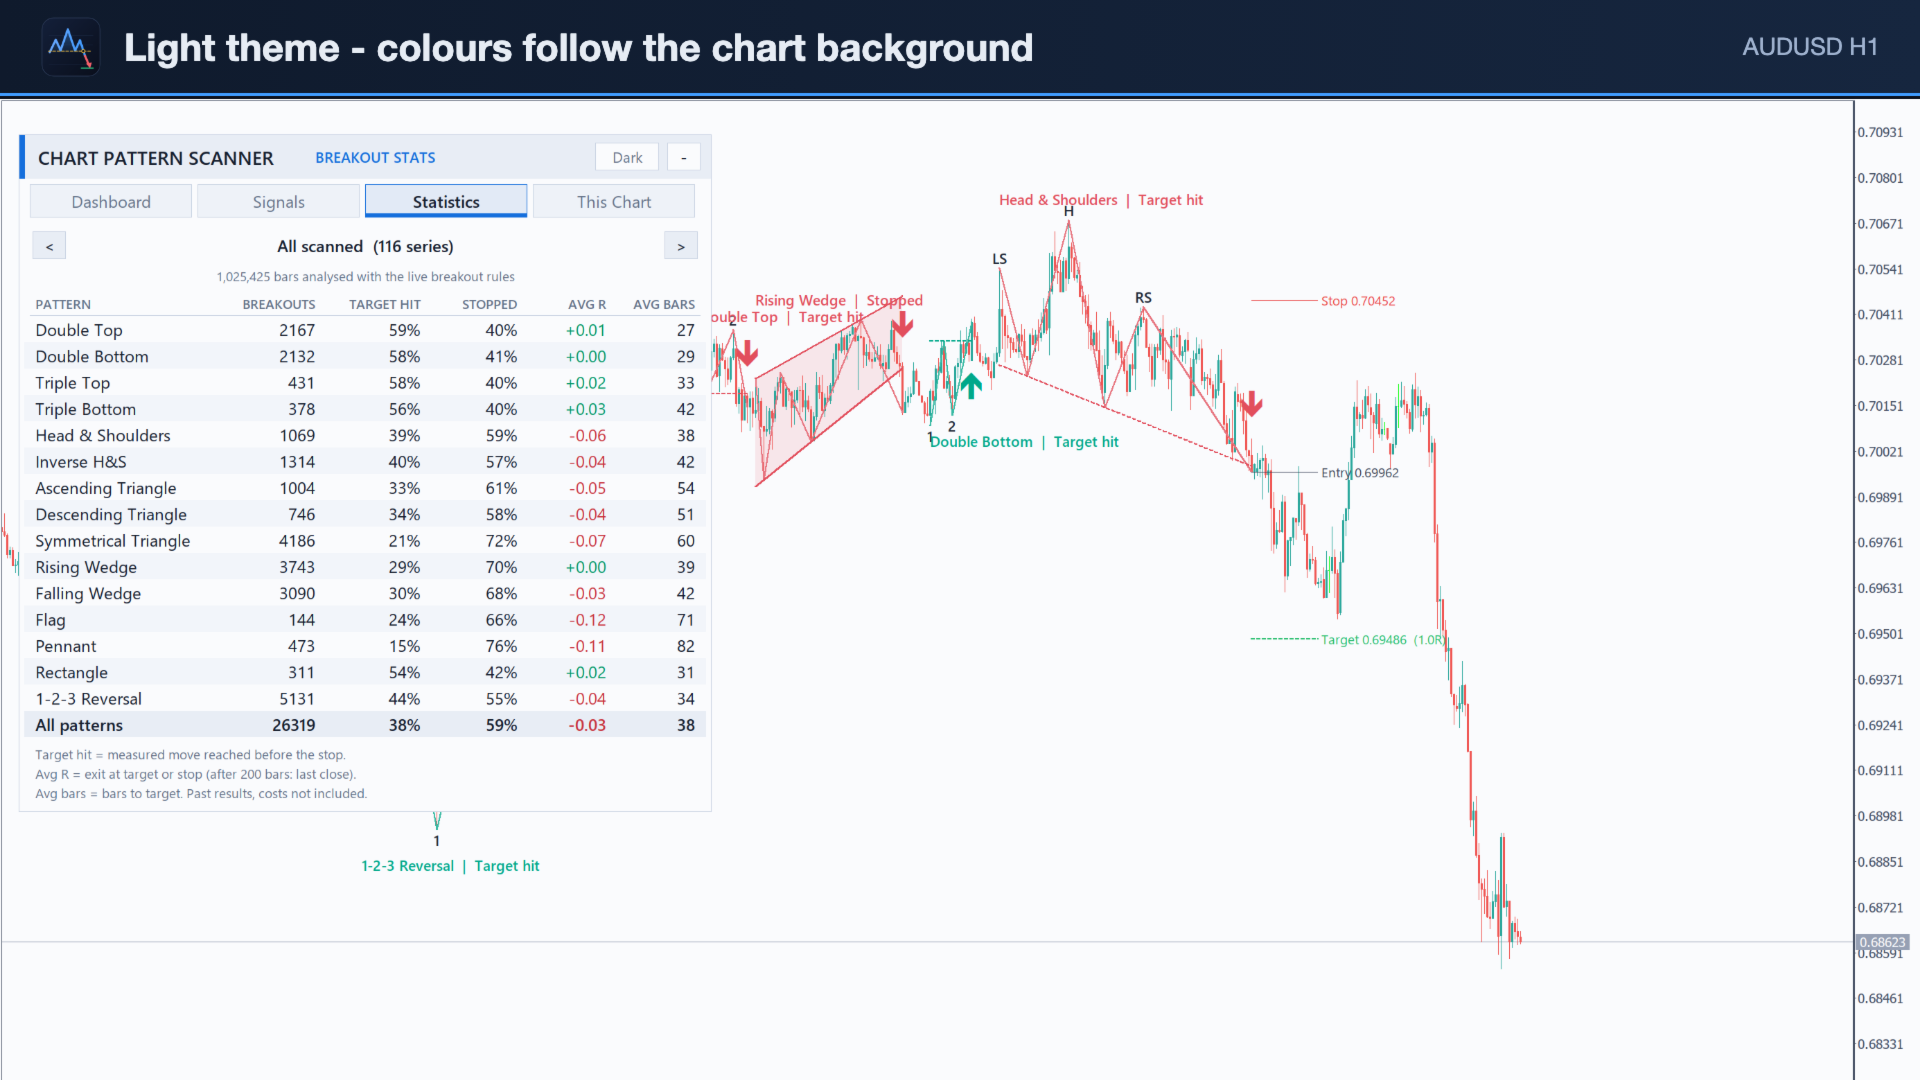
Per pattern: breakouts, target hit %, stopped %, average R and average bars to the target. Switch the scope with the arrows: this chart, any single dashboard symbol/timeframe, or all scanned series together.

This Chart tab

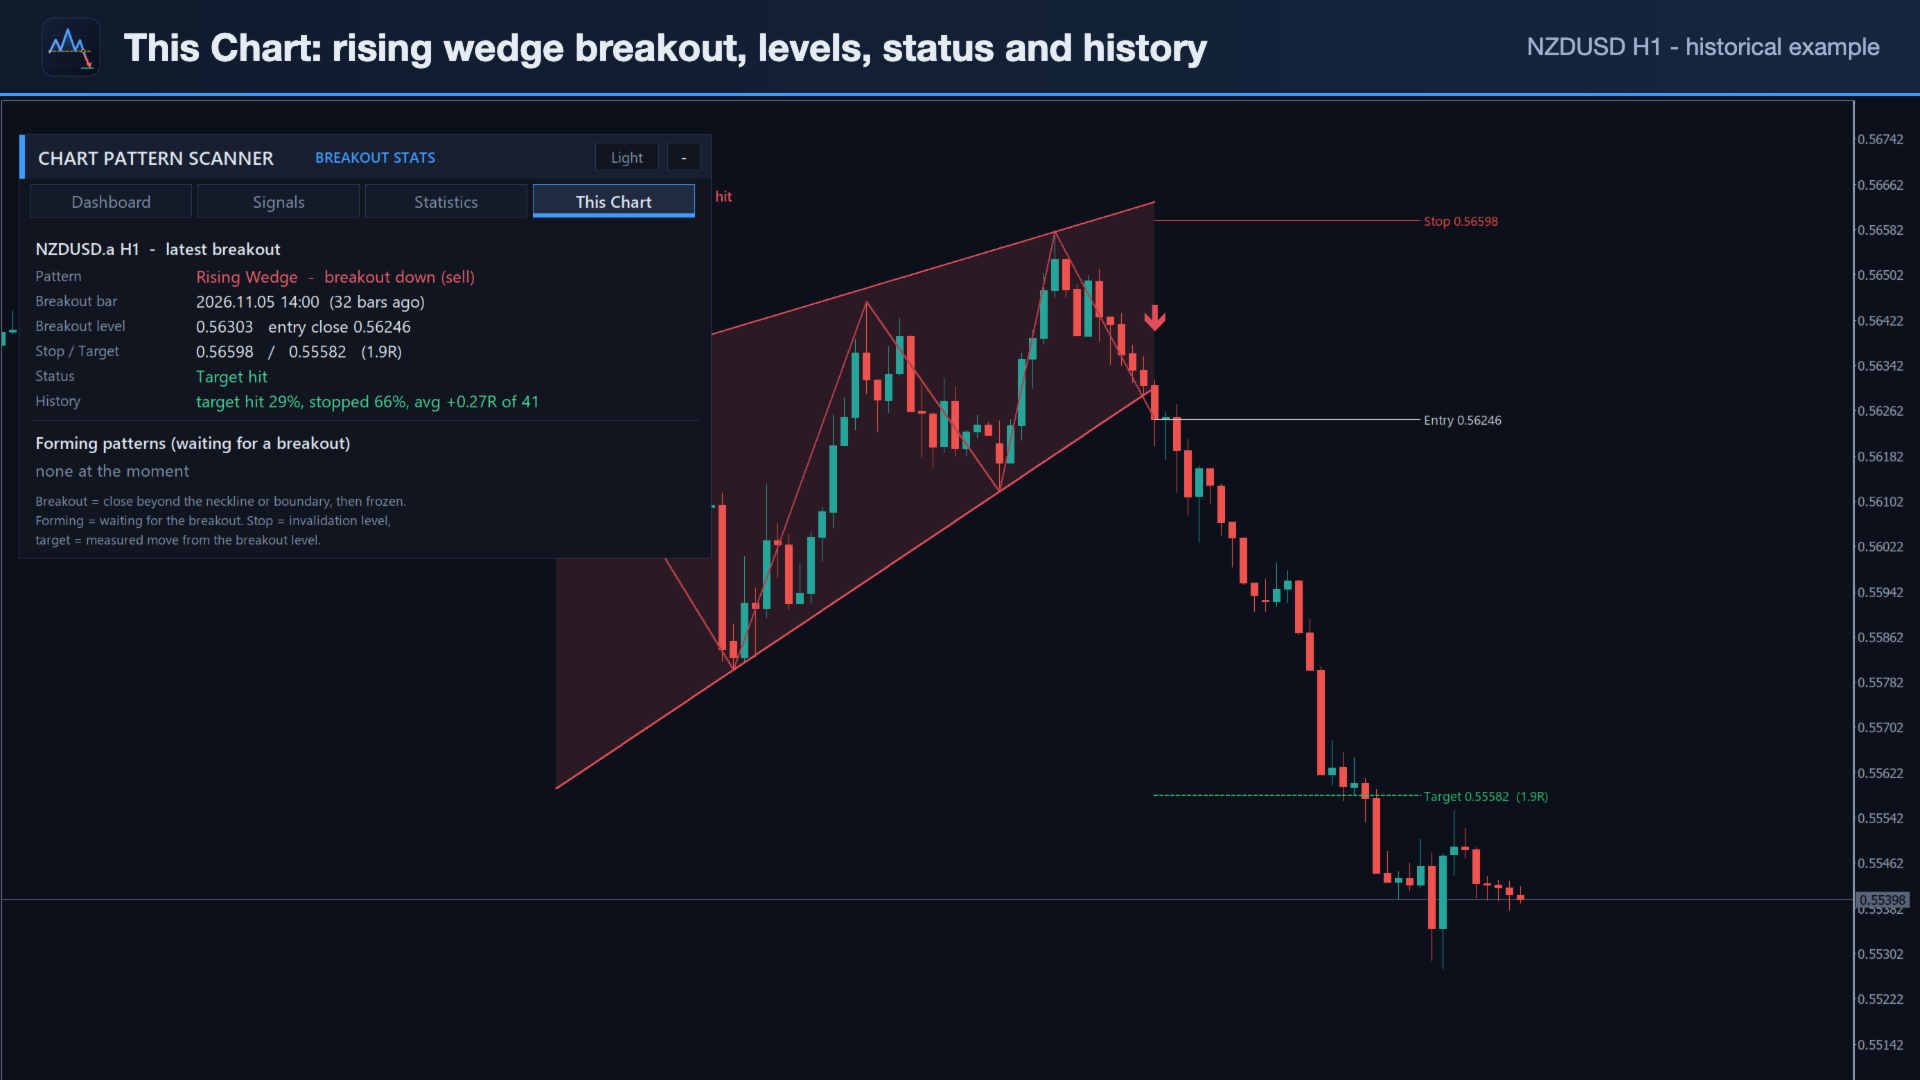
The latest breakout on this chart with its breakout level, entry, stop, target, reward:risk, status and history, plus the forming patterns with their breakout levels.

Chart drawing

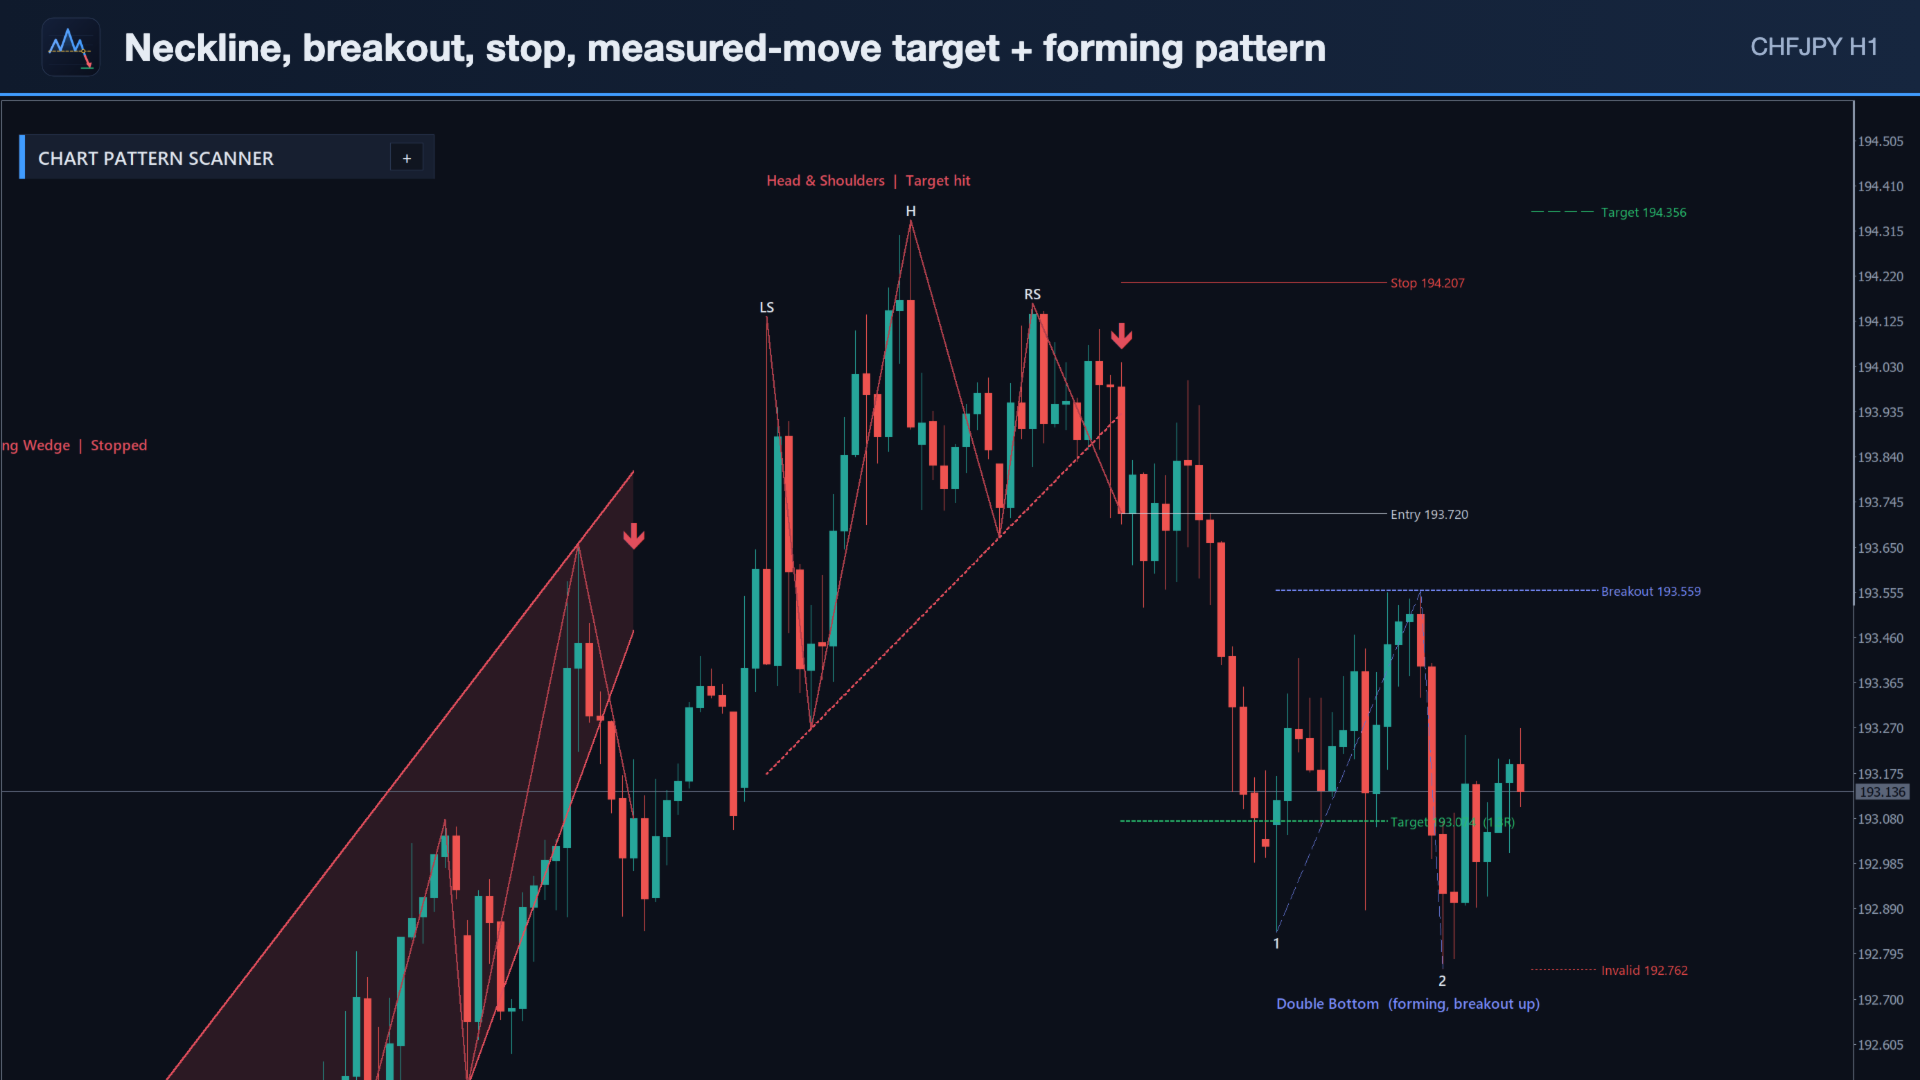
  • Outline through the swing points (labels LS / H / RS, 1 / 2 / 3), neckline or boundary lines, a light fill for triangles, wedges, flags, pennants and rectangles.
  • Breakout arrow, result label (target hit / stopped / active), and for the latest breakout the entry, stop and target lines with prices and R.
  • Forming patterns in their own colour with the breakout level(s), the projected target and the invalidation level.
  • Patterns drawn on the chart never overlap in time, so the picture stays readable; all colours are inputs.

Alerts

On a confirmed breakout (and optionally on a new forming pattern), for this chart and all dashboard symbols: popup, push notification, e-mail and sound. The message contains the pattern, side, entry, stop, target and the history of that pattern on that symbol.

Panel

Dark and light themes (automatic or one click), DPI scaling, movable by its header, minimisable; position, tab and theme are remembered per chart.

Buffers for Expert Advisors

On the breakout bar of every signal: 0 = signal (+1 buy, -1 sell), 1 = pattern type (0 Double Top, 1 Double Bottom, 2 Triple Top, 3 Triple Bottom, 4 Head & Shoulders, 5 Inverse H&S, 6 Ascending Triangle, 7 Descending Triangle, 8 Symmetrical Triangle, 9 Rising Wedge, 10 Falling Wedge, 11 Flag, 12 Pennant, 13 Rectangle, 14 1-2-3 Reversal), 2 = entry, 3 = stop loss, 4 = target, 5 = breakout level. Empty value elsewhere. Values never change once written; read bar 1 (the last closed bar).

Main inputs

InputDefaultMeaning
Pattern families (8 switches)all ondouble, triple, H&S, triangles, wedges, flags/pennants, rectangles, 1-2-3
Pattern Sizes / Swing DepthSmall + Medium / 5swing sizes searched
Minimum Swing1.0 × ATRignore tiny swings
Equal-Level / Flat-Line Tolerance15 %of the pattern height
Minimum Pattern Height1.5 × ATRignore small patterns
Reversals need a prior trendtruedouble/triple/H&S only after a move into them
Breakout close beyond the line by0 × ATRstricter breakouts when raised
Stop beyond the invalidation level0.2 × ATRstop buffer
Target1.0 × measured movee.g. 0.7 for a closer target
Breakout must come within1.0 × pattern widthbreakout window
History Bars / Max Bars to resolve10 000 / 200statistics
Breakouts drawn / Show Forming6 / truechart drawing
Symbols / Timeframes28 pairs + XAUUSD / M30,H1,H4,D1dashboard (empty symbols = Market Watch, up to 8 timeframes)
Show breakouts up to10 barsage limit in the dashboard
Cell / Row Clickopen chartor switch this chart
Alertsbreakout: popuppopup, push, e-mail, sound, forming alert
Theme / Font SizeAuto / 9panel look

Example settings

  • Default - all patterns, two sizes, M30-D1 dashboard.
  • Swing H4/D1 - Pattern Sizes = Small + Medium + Large, Timeframes = H4,D1.
  • Intraday - Timeframes = M15,M30,H1, Show breakouts up to = 6 bars.
  • Reversals only - switch off Triangles, Wedges, Flags and Pennants, Rectangles.
  • Closer target - Target = 0.7 × measured move (more targets hit, smaller wins).

Installation

  1. Attach the indicator to any chart (one chart is enough for the whole dashboard).
  2. Keep the dashboard symbols in Market Watch or let the indicator add them; the first scan loads the history of every symbol and timeframe (a minute or two).
  3. For push alerts enter your MetaQuotes ID in Tools > Options > Notifications; for e-mail configure Tools > Options > Email.

Notes

  • The free demo runs in the Strategy Tester: the dashboard there contains only the tested symbol (the tester provides no other symbols).
  • Statistics are computed on your broker's history in your terminal. They describe the past and are not a promise of future results; spread and commission are not included.
  • This is an analysis tool. It does not open trades.
추천 제품
CosmiCLab FIBO
Kirils Subins
CosmiCLab SMC FIBO CosmiCLab SMC FIBO is a professional trading indicator designed for traders who use Smart Money Concepts (SMC), market structure analysis and Fibonacci retracement levels. The indicator automatically detects market swings and builds Fibonacci levels based on the latest impulse movement. It also identifies market structure changes such as BOS (Break of Structure) and CHOCH (Change of Character), helping traders understand the current market direction. CosmiCLab SMC FIBO also pr
BlueDigitsFx 공식 생태계 액세스 인프라 업데이트, 트레이딩 리소스, 제품 출시 정보 및 BlueDigitsFx 공식 생태계에 대한 액세스를 받아보세요. Telegram 생태계 웹사이트 MT4 버전 BlueDigitsFx Spike And Strike Reversal MT5 — 시장 반전 및 모멘텀 분석을 위한 복합 오실레이터 BlueDigitsFx Spike And Strike Reversal 은 여러 지표 신호를 결합한 복합 오실레이터로, 트레이더가 잠재적인 시장 반전, 모멘텀 변화 및 추세 소진 상태를 식별할 수 있도록 돕습니다. 이 지표는 오실레이터 기반 확인 기능을 포함한 여러 분석 요소를 통합하며, 차트에 직접 시각적 신호를 표시하여 구조적인 반전 분석을 지원합니다. Spike And Strike는 다양한 시장 환경에서 반전, 되돌림 및 모멘텀 전환 구간에서 추가적인 확인을 원하는 트레이더를 위해 설계되었습니다. 주요 기능 오실레이터 기반의 시각적 반전
Fabii Half Trend Baseline
Fabien Georges Andre Guillemaud
상위 시간대 추세에 맞서는 거래를 멈추세요. 기준선 두 개, 차트 하나. 리페인트 없음. 모든 통화쌍, 모든 시간대. 2분 안에 차트에 적용. Strategy Tester에서 무료 데모를 사용해 볼 수 있습니다. Get more indicators here Baselines, volatility filters and oscillators. No repaint. 필요한 이유 차트의 선이 초록색으로 바뀌어서 진입합니다. 그런 다음 상위 시간대를 열어 보니 더 큰 추세는 반대 방향입니다. 신호는 진짜였습니다. 하지만 그 뒤의 추세는 당신 편이 아니었습니다. 더 큰 추세에 맞서는 거래는 그때마다 진입의 우위를 깎습니다. 제공하는 것 Fabii Half Trend Baseline은 현재 시간대의 추세와 상위 시간대의 추세를 한 차트에 보여 주므로, 창을 바꿔 가며 큰 그림을 확인할 필요가 없습니다. 상위 시간대의 두 번째 기준선이 메인 선 뒤에 그려져서, 다른 차트를 열지 않고도 더 큰
MT5용 Crypto_Forex 지표 PINBAR 패턴, 재도색 및 지연 없음. - "PINBAR 패턴" 지표는 가격 변동 거래에 매우 강력한 지표입니다. - 이 지표는 차트에서 다음과 같은 핀바를 감지합니다. - 상승 핀바 - 차트에 파란색 화살표 신호(그림 참조). - 하락 핀바 - 차트에 빨간색 화살표 신호(그림 참조). -   PC 및 모바일 알림 기능 포함. - "PINBAR 패턴" 지표는 지지/저항 레벨과 결합하기 매우 좋습니다. ................................................................................ 여기를 클릭하여 고품질 트레이딩 로봇과 지표를 확인하세요! MQL5 웹사이트에서만 제공되는 오리지널 상품입니다.
RBreaker
Zhong Long Wu
RBreaker Gold Indicators는 금 선물을 위한 단기 데이 트레이딩 전략으로, 추세 추종과 데이 내 반전의 두 가지 거래 방식을 결합합니다. 추세 장에서 수익을 포착할 수 있을 뿐만 아니라, 시장이 반전될 때 적시에 이익을 확정하고 추세에 맞춰 반대 포지션을 잡을 수 있습니다. 이 전략은 미국 잡지 Futures Truth에서 15년 연속으로 가장 수익성 높은 트레이딩 전략 상위 10위 안에 선정되었습니다. 긴 라이프사이클을 자랑하며, 현재까지 국내외에서 널리 사용되고 연구되고 있습니다. 본 지표는 2026년 금 선물의 움직임을 반영하여 14일 ATR 지표를 기반으로 돌파 계수 A, 관찰 계수 B, 반전 계수 R을 보다 합리적인 값으로 정의했습니다. 매우 훌륭한 지표이며, 안정적인 연간 수익성을 달성했습니다. 강력히 추천합니다~ 위 지표는 변동성이 높은 상품에 적합하며, 매개변수는 금 선물, 주가 지수 선물 등에 적합합니다. 다른 상품이 필요한 경우 돌파 계수 A
신경학적 학습 지표: 차트에 설정하고 스스로 최적의 설정을 찾게 하세요. 뉴로 갠 AI는 MetaTrader 5용 신경 학습 신호 지표로, 대부분의 도구가 사용자에게 맡기는 일을 수행합니다. 최근 기록과 현재 있는 심볼의 실제 시장 상태를 연구하고, 지표 필터에 대한 모든 최적 설정, 최고의 결과를 줄 수 있는 스톱과 타겟 거리를 찾아 사용자 대신 적용합니다. 다른 타임프레임으로 전환하면 처음부터 다시 학습하므로, 항상 눈앞의 차트에 맞는 설정으로 거래하게 되며, 사용자가 추측한 숫자가 아닙니다. 그 뒤에 있는 방법은 W.D. 갠의 가격 범위 분할입니다. 가격이 상위 타임프레임 추세와 일치하는 신호 구역으로 돌아오면, 지표는 캔들에 진입을 표시하고 진입선, 세 개의 타겟, 스톱을 그립니다. 또한 이동평균과 그 밴드 필터로 신호를 확인하고 상위 타임프레임 확인을 사용자 대신 선택하므로, 모든 시장에서 하나의 고정 설정에 얽매이지 않고 주로 추세를 따라 거래합니다. 입증된 통계적 성능
An indicator of pattern #31 ("Long Island") from Encyclopedia of Chart Patterns by Thomas N. Bulkowski. The second gap is in the opposite direction. Parameters: Alerts - show alert when an arrow appears   Push - send a push notification when an arrow appears (requires configuration in the terminal) GapSize - minimum gap size in points ArrowType - a symbol from 1 to 17 ArrowVShift - vertical shift of arrows in points   ShowLevels - show levels ColUp - color of an upward line ColDn - color of a d
A visualization system for favorite candlesticks price action patterns. Once attached, indicator will automatically mark next patterns on the chart: Pinocchio bar  - a small-body bar with a long 'nose', very well-known reverse pattern; Inside bar  - a bar whose range lies inside the range of the previous bar. It represents market incertitude; Outside bar  - a bar whose range exceeds the range of the previous bar. It represents market incertitude; Rails pattern  - two consequent opposite bars wit
Has rsi signal
Evgenii Savinov
HAS RSI Signal — SL/TP 자동 계산 기능이 포함된 전문 트렌드 지표 HAS RSI Signal 은 검증된 클래식 지표와 현대적인 노이즈 필터링 알고리즘을 결합한 강력한 트레이딩 도구입니다. 이 지표는 Heiken Ashi Smoothed (HAS) 캔들과 RSI 오실레이터를 통해 시장을 분석하며, 추세 반전이나 과매수/과매도 구간 이탈 시 트레이더에게 명확한 진입 신호를 제공합니다. 주요 장점: 이중 필터링: Heiken Ashi Smoothed를 사용하여 시장의 '노이즈'를 제거하고, RSI를 통해 모멘텀의 강도를 확인합니다. 자동 레벨 계산: 단순히 신호만 주는 것이 아니라, 변동성( ATR )을 기반으로 최적의 손절매(Stop Loss) 및 이익 실현(Take Profit) 레벨을 자동으로 계산합니다. 시각적 편의성: 신호가 차트 위에 컬러 캔들 형태로 직접 표시되어 복잡하지 않고 직관적으로 추세를 파악할 수 있습니다. 알림 시스템: 터미널 알람, 사운드, 스마
Trade smarter, not harder: Empower your trading with Harmonacci Patterns This is arguably the most complete harmonic price formation auto-recognition indicator you can find for the MetaTrader Platform. It detects 19 different patterns, takes fibonacci projections as seriously as you do, displays the Potential Reversal Zone (PRZ) and finds suitable stop-loss and take-profit levels. [ Installation Guide | Update Guide | Troubleshooting | FAQ | All Products  ] It detects 19 different harmonic pric
Reversal Master for MT5
Alexey Minkov
5 (1)
Reversal Master for MT5 Reversal Master for MT5 is a non‑repainting reversal indicator for MetaTrader 5. It helps you detect potential market reversal points and shows the maximum favourable price movement after each historical signal, so you can better understand how price behaved after similar situations in the past. The MT5 version keeps the familiar reversal‑signal logic of the original Reversal Master for MT4, but adds improved visualisation, historical statistics and a points summary panel
ALYAS Position Tool
Salim Alyas Rasho
ALYAS Position Tool - NextGen ALYAS Position Tool - NextGen is a MetaTrader 5 analytical tool designed for position planning, risk analysis, market structure analysis, and trade scenario visualization . The tool provides an interactive position-planning interface directly on the chart, allowing traders to visualize and adjust Entry, Stop Loss, and Take Profit levels while monitoring the associated risk, reward, position size, and market context. It is designed as an analysis and planning tool an
YazanPro Pattern Scanner
Yazan Adnan Ramadan Ibrahim
개요 YazanPro Pattern Scanner는 여러 시장에서 차트 패턴으로 거래하는 트레이더를 위한 MetaTrader 5 인디케이터입니다. 최대 150개 종목을 최대 9개 시간대에서 검사해 고전적인 차트 패턴과 40가지 캔들 패턴을 찾고, 각 패턴이 도달한 단계와 함께 모든 것을 하나의 표에 보여 줍니다. 차트를 하나씩 열어 보는 대신, 어디에서 패턴이 막 완성되었는지, 돌파했는지, 리테스트 중인지, 확인되었는지를 한눈에 보고, 클릭 한 번으로 패턴이 그려진 그 차트를 엽니다. 주요 기능 시장 감시 창, 브로커의 모든 거래 가능 종목 또는 직접 만든 목록에서 최대 150개 종목: 외환, 금속, 지수, 주식, 에너지, 암호화폐. M1부터 MN1까지 9개 시간대 중 어느 것이든 버튼으로 켜고 끔(기본값 M15, H1, H4, D1). 이중·삼중 천장과 바닥, 헤드 앤 숄더, 삼각형, 웨지, 플래그와 페넌트, 사각형, 채널, 컵 앤 핸들. 7개 단계: 형성 중, 완성, 돌파, 리테
US30NinjaMT5
Satyaseelan Shankarananda Moodley
US30 Ninja is a 5 minute scalping indicator that will let know you when there is a trade set up (buy or sell). Once the indicator gives the trade direction, you can open a trade and use a 30 pip stop loss and a 30 pip to 50 pip take profit. Please trade at own own risk. This indicator has been created solely for the US30 market and may not yield positive results on any other pair. 
Auto Optimized RSI   is a smart and easy-to-use arrow indicator designed for precision trading. It automatically finds the most effective RSI Buy and Sell levels for your selected symbol and timeframe using real historical data simulations. The indicator can be used as a standalone system or as part of your existing trading strategy. It is especially useful for intraday trading. Unlike traditional RSI indicators that rely on fixed 70/30 levels,   Auto Optimized RSI   dynamically adjusts its lev
Harmonic Strategy Suite Pro MT5
Mohamed Amr Mohamed Osama Abdelwahab
HARMONIC STRATEGY SUITE PRO MT5 Harmonic Strategy Suite Pro 는 MT5 전용으로 설계된 전문 하모닉 패턴 감지 및 실시간 백테스팅 대시보드입니다. 단순히 선만 그리는 기존의 패턴 스캐너와 달리, 차트 내에 정밀한 시뮬레이션 백테스팅 엔진을 내장하여 목표가 도달 확률을 계산하고 가독성을 극대화하기 위해 레이아웃을 동적으로 자동 제어합니다.  주요 기능 및 특징 드래그 가능한 양방향 대시보드:   패턴별 최대 100회의 최근 거래 이력을 기반으로 진입 도달률, T1/T2 승리 확률, 평균/합계 수익률 등의 통계 데이터를 실시간으로 자동 산출합니다. 차트 일괄 제어 (ON/OFF) 버튼:   대시보드 내의 ON/OFF 버튼을 클릭하는 것만으로 해당 패턴의 작도를 손쉽게 숨기거나 표시할 수 있습니다. 백그라운드에서의 백테스트 통계 계산은 그대로 유지됩니다. 엄격한 지정가 주문 백테스트:   실제 트레이딩 흐름을 그대로 구현합니다. 패턴 확정
Heiken_Ashi_Bars - MT5용 고급 추세 시각화 도구 개요 Heiken_Ashi_Bars 는 시장의 노이즈를 필터링하고 진정한 기본 추세를 강조하도록 설계된 강력하고 시각적으로 직관적인 사용자 지정 지표입니다. 기존의 캔들스틱 차트는 불규칙하여 거짓 신호와 섣불린 청산을 유발할 수 있습니다. 이 지표는 가격 데이터를 평균화하여 가격 움직임을 부드럽게 만들어 추세 지속, 반전 및 수익성 있는 진입 구간을 훨씬 쉽게 파악할 수 있도록 해줍니다. 주요 기능 및 장점 강력한 노이즈 감소: 사소한 가격 급등 및 횡보 노이즈를 필터링합니다. 명확한 시각적 신호: 색상으로 구분된 막대를 통해 강세 및 약세 모멘텀을 한눈에 파악할 수 있습니다. 리페인트 없음 (No Repaint): 막대가 마감되면 신호가 고정됩니다. 과거 막대를 다시 계산하지 않습니다. 고도로 최적화됨: 터미널 지연이 없도록 깔끔하게 코딩되었습니다. 다양한 활용: 모든 금융 상품(외환, 지수, 금속, 암호화폐)에서
TRI Visualizer
Yoshimi Mon 三 Ura
TRI Visualizer MT5 – Thermodynamic Market Analysis Overview The TRI (Thermal Range Indicator) Visualizer Enhanced is a rare market analysis indicator that goes beyond conventional technical analysis, applying principles of thermodynamics from physics. It interprets market price fluctuations as “thermodynamic energy,” enabling the highly accurate detection of subtle market changes that are often overlooked. Innovative Mechanisms 1. Dual Calculation Engines Classic TRI Mode Formula: |Close
Rainbow EA MT5
Jamal El Alama
Description : Rainbow EA MT5 is a simple Expert advisor based on   Rainbow MT5 indicator witch is based on Moving average with period 34. The indicator is incorporated in the EA, therefore, it is not required for the EA to operate, but if you wish, you can download it from   my product page . The Expert Advisor settings are as follows : Suitable for Timeframes up to H1 The parameters below can be set according to your trading rules. StopLoss ( Stop Loss in pips) TakeProfit ( Take Profit in pips
Multi Timeframe Smc Bias Finder Trading in alignment with higher timeframe structure is one of the most consistently profitable habits a trader can build. The difficulty has always been execution: switching between timeframes, manually reading structure, and keeping track of whether the Daily, 4-Hour and 1-Hour are all pointing in the same direction before committing to a position. Multi Timeframe Smc Bias Finder resolves that entirely. Three tools in one indicator: A live multi-timeframe bias d
Noize Absorption Index
Ekaterina Saltykova
Noize Absorption Index - is the manual trading system that measures the difference of pressure between bears forces and bulls forces. Green line - is a noize free index that showing curent situation. Zero value of index shows totally choppy/flat market.Values above zero level shows how powerfull bullish wave is and values below zero measures bearish forces.Up arrow appears on bearish market when it's ready to reverse, dn arrow appears on weak bullish market, as a result of reverse expectation.
Price Magnet — Price Density and Attraction Levels Indicator Price Magnet is a professional analytical tool designed to identify key support and resistance levels based on statistical Price Density. The indicator analyzes a specified historical period and detects price levels where the market spent the most time. These zones act as “magnets,” attracting price action or forming a structural base for potential reversals. Unlike traditional Volume Profile tools, Price Magnet focuses on price-time d
Structure King AI Signal
Shingala Gautamkumar
Structure King AI Signal Structure King AI Signal is a professional MetaTrader 5 trading indicator designed to help traders analyze market structure, trend direction, multi-timeframe confirmation and trade management from one clean dashboard. Key Features • Market Structure & Trend Analysis • BUY / SELL Signals • Multi-Timeframe (HTF) Confirmation • Entry Price Levels • Dynamic Stop Loss (SL) • TP1 / TP2 / TP3 Levels • ATR Volatility Analysis • ADX Trend Strength Filter • Adaptive Market Filter
숫자 시퀀스 중 하나를 "산불 시퀀스"라고 합니다. 가장 아름다운 새로운 시퀀스 중 하나로 인식되었습니다. 주요 특징은 이 시퀀스가 ​​가장 짧은 경우에도 선형 추세를 피한다는 것입니다. 이 지표의 기초를 형성한 것은 이 속성입니다. 금융 시계열을 분석할 때 이 지표는 가능한 모든 추세 옵션을 거부하려고 합니다. 그리고 그가 실패하는 경우에만 그는 추세의 존재를 인식하고 적절한 신호를 제공합니다. 이 접근 방식을 통해 새로운 트렌드가 시작되는 순간을 정확하게 결정할 수 있습니다. 그러나 거짓 긍정도 가능합니다. 숫자를 줄이기 위해 이 표시기에 추가 필터가 추가되었습니다. 새 막대가 열리면 신호가 생성됩니다. 어떤 경우에도 다시 그리기가 발생하지 않습니다. 표시 매개변수: Applied Price   - 적용된 가격 상수. Period Main   - 표시기의 기본 기간, 유효한 값은 5 - 60 이내입니다. Period Additional   - 추가 기간, 이 매개변수의 유효한
Your Trend Friend
Luigi Nunes Labigalini
5 (1)
The trend is your friend! Look at the color of the indicator and trade on that direction. It does not  repaint. After each candle is closed, that's the color of the trend. You can focus on shorter faster trends or major trends, just test what's most suitable for the symbol and timeframe you trade. Simply change the "Length" parameter and the indicator will automatically adapt. You can also change the color, thickness and style of the lines. Download and give it a try! There are big movements w
Royal Aurum Confluence는 어디서 진입하고 청산할지, 금 가격이 실제로 어디까지 움직일 수 있을지 더 이상 추측에 의존하고 싶지 않은 트레이더를 위해 개발된 MetaTrader 5 지표입니다. 출시 가격: $49 . 구매 20건마다 가격이 $10씩 인상되며, 최종 가격인 $199 에 도달할 때까지 적용됩니다. 다음 가격: $59 . Royal Aurum Companion 이 추가 비용 없이 포함됩니다. Royal Aurum Confluence와 함께 사용하도록 설계된 수동 주문 실행 및 포지션 관리 보조 도구입니다. 구매 후 MQL5 받은편지함을 통해 메시지를 보내 주세요. Companion 파일과 전체 워크플로 자료(세트 파일 및 사용자 가이드)를 24시간 이내에 전달해 드립니다. 많은 트레이더가 XAUUSD에서 손실을 보는 이유는 추세를 읽지 못해서가 아닙니다. 신호가 나온 뒤의 모든 판단을 감에 맡기기 때문입니다. 손절선을 너무 가까이 또는 너무 멀리 설정하고,
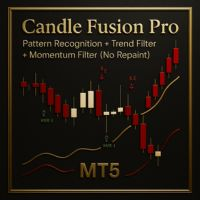
Candle Fusion Pro
Martin Alejandro Bamonte
Candle Fusion Pro — 패턴 인식 + 추세 필터 + 모멘텀 필터 (재도색 없음) 강력한 캔들 패턴을 감지하고 실시간 추세 및 모멘텀 분석을 통해 그 신뢰도를 확인하세요. Candle Fusion Pro 는 정밀한 가격 행동 , 추세 구조 및 다중 확인 을 활용하는 트레이더들을 위한 최고의 시각적 도구입니다. 핵심 기능 패턴 기반 진입 : 10개 이상의 고급 일본식 캔들 패턴 을 감지합니다: 슈팅스타 (레벨 2, 3, 4) 강세/약세 엔골핑 모닝스타 / 이브닝스타 도지 및 도지 스타 해머 (레벨 2, 3, 4) 관통선 및 어두운 구름 덮기 재도색 없음, 지연 없음 : 화살표 및 라벨은 캔들이 닫힌 후에만 고정되어 표시됩니다. 보이는 그대로입니다 . 실시간 확인 : 추세 필터 (시간 프레임에 따라 자동 조정) RSI 강도 라벨 : 색상 표시 (초록 <30, 주황, 빨강 >70) ADX 필터 : 추세 지속 또는 횡보 상태 식별 (임계값 25): 강한 추세 = 지속 , 약
Premium level Pro
Dmitriy Kashevich
Premium level is a unique indicator with more than 80% accuracy of correct predictions! This indicator has been tested for more than two months by the best Trading Specialists! The author's indicator you will not find anywhere else! From the screenshots you can see for yourself the accuracy of this tool! 1 is great for trading binary options with an expiration time of 1 candle. 2 works on all currency pairs, stocks, commodities, cryptocurrencies Instructions: As soon as the red arrow app
Eabotpro Signals
Dany Abou Haidar
Eabotpro Signals v3.0 A professional MetaTrader 5 indicator designed to deliver high-precision trading signals with real-time notifications, trade management tools, and a clean interface. "Recommended Base time frame is 4H Fibo From input . and trade time frame 1 mint , and 5 mint " Key Features: High-Accuracy Signals : Optimized for precision and consistency across different market conditions. Smart Trade Panel : Displays entry price, targets, stop levels, performance stats, and profit trackin
Trend Sniper Follow
Edoardo Centorame
Trend Sniper Follow 추세의 명확성, 구조 및 통제 Trend Sniper는 중장기 추세에 대한 명확하고 질서 있으며 노이즈가 적은 해석을 제공하도록 설계된 추세 분석 지표입니다. 주요 강점 깨끗하고 즉각적인 추세 해석 단순하지만 강력한 계층 구조 차트 위의 시각적 과부하 없음 Daily, Weekly 및 Monthly에 이상적 swing trading 및 trend following에 완벽 감정적 해석을 피하면서 시장 맥락에 맞춰 유지하는 데 도움 Trend Sniper Follow는 운영 타이밍 도구가 아니며 진입 또는 청산 신호를 제공하지 않습니다. 시장의 구조를 예측하는 것이 아니라 이해하고자 하는 사람을 위해 설계되었습니다. 어디서 그리고 어떻게 사용하는가 Trend Sniper Follow는 가격 차트에 직접 적용됩니다 가격과 같은 창에서 작동합니다 다른 중첩 지표와 함께 사용하도록 설계되지 않았습니다 이 선택은 전문적인 추세 분석에 이상적인 깨끗하고 읽기
이 제품의 구매자들이 또한 구매함
Trend Sniper X
Sarvarbek Abduvoxobov
4.86 (44)
Trend Sniper X 는 트레이더가 추세 방향과 잠재적 반전 지점을 명확하고 정확하게 포착할 수 있도록 도와주는 MetaTrader 5용 멀티 타임프레임 추세 추종 지표입니다. MT4용: https://www.mql5.com/en/market/product/193245 가격 정보: 현재 가격은 프로모션 할인가이며, 향후 업데이트 및 새로운 기능이 출시됨에 따라 변동될 수 있습니다. 보너스 혜택: 본 지표 전용 무료 자동매매 Assistant EA를 받으시려면 구매 후 작성자에게 메시지를 보내주시기 바랍니다. Code2Profit 채널 멀티 타임프레임 분석으로 시장을 마스터하세요! Trend Sniper X로 승률을 극대화하는 방법: 핵심 규칙 및 세션 팁 기술 사양 플랫폼 MetaTrader 5 지표 유형 멀티 타임프레임 추세 지표 운용 타임프레임 모든 차트 타임프레임 지원, 독립적으로 선택 가능한 상위 타임프레임(M1–MN1) 주요 상품 외환, 금(XAUUSD) 및 기타 C
새로운 왕의 등장 - 인디케이터 + 주문 관리 표시(TP1 + TP2 + TP3) + 선택형 텔레그램 시그널 전송 기능 포함 (무료) (완전한 트레이딩 및 시그널 시스템) 골드를 위한 최고의 EA: Gold Slayer 이 인디케이터는 고급 전략, 사용자 지정 가능한 주문 관리 시스템, 그리고 엔벨로프 확장을 결합한 평균 회귀(mean reversion) 시스템을 포함하고 있습니다. 또한 RSI와 같은 여러 지능형 확인 필터를 통해 높은 확률의 반전 진입 구간을 포착하여 BUY 및 SELL 시그널을 제공합니다. 단순히 거래 방법만 배우는 것이 아니라, 여러 포지션을 효과적으로 관리하고 이전에 수익 중인 오픈 포지션으로 손실 거래를 커버하는 방법까지 익힐 수 있습니다. M5 전용으로 설계 및 최적화되었으며, 유동성이 풍부해 시그널이 더 깔끔하고 신뢰도 높은 BTCUSD와 XAUUSD에서 뛰어난 성능을 발휘합니다. 이 인디케이터는 ATR 기반으로 자동 계산된 진입가, 손절가, 익절가와
Smart Trend Trading System — MetaTrader 5 구매 후 MQL5에서 저에게 메시지를 보내시면 Smart Universal Expert Advisor를 무료로 받으실 수 있으며, 온라인 강좌, PDF 매뉴얼 및 비공개 그룹 이용 권한도 함께 제공됩니다. STTS는 추세 방향, 진입·청산 신호, 반전 구간, 주요 가격 수준을 차트에 모아 보여줍니다. 시스템을 참고해 수동으로 거래하거나, 별도의 호환 EA를 연결하여 선택한 설정에 따라 자동으로 거래를 실행할 수 있습니다. 하나의 시스템, 네 가지 트레이딩 접근법 STTS의 트레이딩 접근법은 크게 네 가지로 나뉩니다. • 스캘핑 — 단기 신호와 시장 움직임을 살펴봅니다. • 추세 매매 — 방향을 평가하고 추세 안에서 기회를 찾습니다. • 반전 매매 — 잠재적인 전환 구간과 방향 변화를 파악합니다. • 거래량 매매 — 거래량 기반 정보로 시장 활동을 평가합니다. 진입·청산 화살표, 추세 정보, 지지·저항 수
SuperScalp Pro
Van Minh Nguyen
4.54 (37)
SuperScalp Pro - Professional Multi-Layer Confluence Scalping System SuperScalp Pro는 기존 Supertrend에 여러 지능형 확인 필터를 추가하여 기능을 강화한 고급 스캘핑 지표입니다. 잘못된 신호를 크게 줄이면서 성공 가능성이 더 높은 Buy/Sell 거래 기회를 식별하는 데 도움을 줍니다. 명확한 Buy 및 Sell 화살표가 차트에 직접 표시되며, ATR 기반 Stop Loss 및 Take Profit 레벨도 실시간으로 자동 계산됩니다. 구매 후 MQL5 메시지로 저에게 연락하시면 SuperScalp Pro Auto Trader EA를 무료로 받으실 수 있으며, 사용자 가이드와 비공개 그룹 이용 권한도 제공됩니다. 권장 설정 파일 다운로드: [Set File] 전체 문서는 제품 블로그에서 확인할 수 있습니다: [User Guide] 업데이트를 받으려면 공식 채널에 참여하세요: [Official Channel]
Gann Made Easy MT5
Oleg Rodin
5 (13)
Gann Made Easy 는 mr.의 이론을 사용하여 최고의 거래 원칙을 기반으로 하는 전문적이고 사용하기 쉬운 Forex 거래 시스템입니다. W.D. 간. 이 표시기는 Stop Loss 및 Take Profit Levels를 포함하여 정확한 BUY 및 SELL 신호를 제공합니다. PUSH 알림을 사용하여 이동 중에도 거래할 수 있습니다. 구매 후 거래 방법 안내 및 유용한 추가 지표를 무료로 받으시려면 저에게 연락주세요! 아마도 Gann 거래 방법에 대해 이미 여러 번 들었을 것입니다. 일반적으로 Gann의 이론은 초보자 거래자뿐만 아니라 이미 거래 경험이 있는 사람들에게도 매우 복잡한 것입니다. Gann의 거래 방식은 이론적으로 적용하기 쉽지 않기 때문입니다. 나는 그 지식을 연마하고 Forex 지표에 최고의 원칙을 적용하기 위해 몇 년을 보냈습니다. 표시기는 적용하기가 매우 쉽습니다. 차트에 첨부하고 간단한 거래 권장 사항을 따르기만 하면 됩니다. 지표는 지속적으로 시장 분석
Entry Points Pro for MT5
Yury Orlov
4.52 (152)
Entry Points Pro는 주문을 넣기 전에 어디에서 진입하고, 스탑을 어디에 두고, 어떤 랏으로 거래할지 보여 줍니다. 가격 지금 149 USD이며, 이 가격으로는 마지막 1카피입니다. 이후 가격은 199 USD로 오르고, 최종 가격은 349 USD입니다. 저는 시장에서 트레이딩으로 돈을 벌고 그것을 보여 드립니다. 그래서 이 인디케이터를 모두에게 팔 필요가 없습니다. 스스로 생각하는 트레이더를 위한 도구이지, 마법 버튼이 아닙니다. 화살표는 캔들이 마감될 때 나타나며 리페인팅되지 않습니다. 설정은 두 가지: 예치금과 거래당 리스크. 결제 전에 확인하세요: 무료 데모는 MT5 전략 테스터에서 작동하며 2분이면 됩니다. 구매 후에는 제가 직접 설정을 도와 드리겠습니다. 2019년, 저는 이 지표가 무엇을 할 수 있는지 전 세계에 보여 주었습니다. 실계좌에서 지표의 시그널에 따라 수동으로, 모두가 볼 수 있게 공개적으로 거래했습니다 — 계좌는 Myfxbook에서 모니터링되었고,
Ultra Indicator
Ihor Otkydach
5 (1)
ULTRA는 “올인원” 방식으로 작동하는 기술적 지표로, 시장을 독자적으로 분석하고, 매매 신호를 생성하며, 손절매 주문 설정 수준을 표시하고, 이익을 실현하거나 손실을 최소화하기 위해 포지션을 청산해야 할 시점을 제안합니다. 다시 말해, 시장을 분석하는 법을 모르거나, 가격 수준(손절매를 어디에 설정할지)을 파악하지 못하거나, 자금 관리에 어려움을 겪더라도 상관없습니다. ULTRA가 그 모든 것을 대신 해줄 테니까요! 구매자 특전 : ULTRA 지표를 구매하신 후, 저에게 비공개 메시지를 보내주시면 “ULTRA BOT”을 무료 선물로 드립니다. 이 도구는 해당 지표의 신호를 바탕으로 개설한 거래를 관리하는 데 도움을 주는 특별한 도구입니다(각 거래에 대해 손절매를 설정하고, 최상의 결과를 얻을 수 있도록 전략의 규칙에 따라 거래를 자동으로 청산해 줍니다).  또한 구매자분들께 다양한 자산에 바로 적용할 수 있는 설정값을 제공해 드리고 있으며, 이를 통해 지표가 최대 효율로 작동할
M1 Sniper MT5
Oleg Rodin
5 (7)
M1 SNIPER 는 사용하기 쉬운 거래 지표 시스템입니다. M1 시간대에 맞춰 설계된 화살표 지표입니다. 이 지표는 M1 시간대 스캘핑을 위한 단독 시스템으로 사용할 수 있으며, 기존 거래 시스템의 일부로도 사용할 수 있습니다. 이 거래 시스템은 M1 시간대 거래용으로 특별히 설계되었지만, 다른 시간대에도 사용할 수 있습니다. 원래는 XAUUSD와 BTCUSD 거래를 위해 이 방법을 설계했지만, 다른 시장 거래에도 유용하다는 것을 알게 되었습니다. 이 지표의 신호는 추세 방향과 반대로 거래될 수 있습니다. 저는 지표의 신호를 활용하여 양방향으로 거래할 수 있도록 돕는 특별한 거래 기법을 알려드립니다. 이 방법은 특별한 동적 지지선과 저항선 가격 영역을 활용하는 것을 기반으로 합니다. 구매하시면 M1 SNIPER 화살표 지표를 바로 다운로드하실 수 있습니다. 또한, 아래 스크린샷에 표시된 Apollo Dynamic SR 지표는 M1 SNIPER 도구를 사용하는 모든 사용자에게 무료로
다음 업데이트 — 버전 2.52 곧 출시! [신규] 시장 분석 및 트레이딩 워크플로를 향상시키기 위해 설계된 4가지 주요 신규 기능을 기대해 주세요. 트레이딩 요구 사항을 충족하도록 설계된 4가지 새로운 기능으로 시장 분석을 한 단계 더 발전시킵니다. 다음 기능을 소개합니다: 1. TRADE OVERVIEW DASHBOARD 2. CONFLUENCE AT ZONE 3. STRONG & WEAK HIGH/LOW 4. OTE 1. TRADE OVERVIEW DASHBOARD 시장 전체 상황을 더 쉽게 파악할 수 있도록 도와주는 대시보드입니다. 트레이딩 의사결정을 지원하는 가이드를 제공하며, 하나의 화면에서 시장을 분석하고 체계적으로 트레이딩을 계획할 수 있도록 도와줍니다. 멀티 타임프레임 시장 개요 (Multi-Timeframe Market Overview) 시장 방향과 가격 구조를 더욱 명확하게 파악 시장 상황을 빠르게 확인 체계적인 시장 분석 및 진입 계획을 위한 가이드 2. CO
Adaptive Price Action Engine 지표를 구매하면 EA(자동매매 프로그램)가 무료 멀티 타임프레임 기반 자기 최적화 추세 & 캔들 패턴 분석 시스템 시장은 끊임없이 변화하며, 모든 Price Action 패턴이 모든 시장 환경에서 동일한 가치를 가지는 것은 아닙니다. Adaptive Price Action Engine 은 변화하는 시장 환경에 적응할 수 있도록 설계되었으며, 추세 구조, 멀티 타임프레임 분석, 캔들 패턴 및 통계적 최적화 를 하나의 분석 프레임워크로 결합합니다. 두 가지 적응형 모드 Dual Alpha Trend Mode 낮은 타임프레임과 높은 타임프레임에서 적합한 Alpha Trend 파라미터를 자동으로 탐색하여, 최근 시장 움직임에 맞춰 추세 분석을 조정합니다. Candlestick + Alpha Mode Alpha Trend를 통한 시장 국면 분석과 22개의 상승 및 하락 캔들 패턴 을 결합합니다. 모든 패턴을 동일하게 취급하는 대신, 다양
FiboSniper Pro
Van Minh Nguyen
5 (4)
FiboSniper Pro – Multi-Filter Fibonacci System with Auto SL/TP and Control Panel FiboSniper Pro는 동적 Fibonacci Envelopes와 여러 확인 필터를 결합하여 선별된 Buy 및 Sell 신호를 생성하는 기술적 지표입니다. Fibonacci 레벨은 Moving Average와 ATR을 기반으로 계산된 후 ADX, EMA, RSI, ATR, Volume, Time 및 Candle 구조를 통해 필터링됩니다. 이 지표는 ATR 기반의 자동 Stop Loss 및 Take Profit 레벨을 차트에 직접 표시하며, 빠른 설정 조정을 위한 인터랙티브 Control Panel을 제공합니다. 구매 후 MQL5 메시지로 저에게 연락하시면 Auto Trader X를 무료로 받으실 수 있으며, 이 지표의 거래 신호를 자동화하는 방법에 대한 안내도 제공됩니다. User Guide 및 Set Files: [Click here
Auto Optimized SpeedAngle 은 지속적인 워크포워드 최적화(Walk-Forward Optimization, WFO)를 통해 곡선 적합(curve-fitting)을 제거한 기관 수준의 모멘텀 벡터화 시스템입니다. 시장 체제가 바뀔 때 성능이 떨어지는 정적 입력에 의존하는 대신, 이 지표는 표본 외(Out-of-Sample, OOS) 검증을 사용하여 매개변수를 동적으로 재보정하며, 표시되는 신호가 과거의 우연이 아닌 진정한 통계적 우위를 나타내도록 보장합니다. 핵심 기관용 프레임워크 워크포워드 최적화 엔진: 핵심 알고리즘은 수천 가지의 룩백(lookback) 및 임계값 조합을 지속적으로 스캔하며, 데이터를 인샘플(in-sample)과 표본 외(out-of-sample) 세트로 엄격하게 분리합니다. 미지의 데이터 환경에서 수학적 우수성이 증명된 경우에만 새로운 매개변수 구성을 채택합니다. 정량적 목적 함수: 순수한 총이익을 쫓는 대신, 최적화 엔진은 기관 수준의 안정성
ARICoins
Temirlan Kdyrkhan
ARICoin is a powerful trading companion designed to generate high-probability entry signals with dynamic TP/SL/DP levels based on volatility. Built-in performance tracking shows win/loss stats, PP1/PP2 hits, and success rates all updated live. Key Features: Buy/Sell signals with adaptive volatility bands Real-time TP/SL/DP levels based on ATR Built-in MA Filter with optional ATR/StdDev volatility Performance stats panel (Success, Profit/Loss, PP1/PP2) Alerts via popup, sound, push, or email Cust
Boba Analysis Suite
Trade Ready Solutions LLC
5 (2)
Boba Analysis Suite Boba Analysis Suite는 MetaTrader 5용 분석 지표입니다. 시장 구조, 주요 가격 영역, 전반적인 시장 상황을 하나의 차트 화면에 통합하여 표시합니다. 트레이더이자 트레이딩 코치로서의 실무 경험을 바탕으로 개발되었으며, 시장 방향 평가, 주요 가격 수준 식별, 여러 시간대의 종합적인 분석 등 체계적인 분석 과정을 지원합니다. 시장 맥락을 고려한 분석 개별 신호의 의미는 시장 상황에 따라 달라집니다. Boba Analysis Suite는 현재 차트 상황을 더 넓은 시장 구조와 연결하고, 사전에 정한 규칙에 따라 매매 아이디어를 검토할 수 있도록 돕습니다. 주요 분석 기능은 다음과 같습니다. 추세 및 시장 구조: 시장 방향과 관련 구조적 맥락을 평가합니다. 주요 가격 영역 및 수준: 추가 분석이 필요한 중요한 영역을 차트에 시각적으로 표시합니다. 여러 시간대: 서로 다른 시간대의 정보를 통합하여 전반적인 시장 상황을 평가합니다.
ScalpPoint
Temirlan Kdyrkhan
ScalpPoint is a powerful trading companion designed to generate high-probability entry signals with dynamic TP/SL/DP levels based on volatility. Built-in performance tracking shows win/loss stats, PP1/PP2 hits, and success rates — all updated live. Key Features: Buy/Sell signals with adaptive volatility bands Real-time TP/SL/DP levels based on ATR Built-in MA Filter with optional ATR/StdDev volatility Performance stats panel (Success, Profit/Loss, PP1/PP2) Alerts via popup, sound, push, or emai
Scalper Vault MT5
Oleg Rodin
5 (1)
Scalper Vault는 당일 매매(intraday trading)에서 일관된 성과를 내고자 하는 트레이더를 위해 설계된, 강력하고 모든 기능을 갖춘 트레이딩 시스템입니다. 이 고정밀 지표는 외환(Forex) 및 바이너리 옵션 트레이더 모두에게 기관급 분석을 제공하는 독립적인 종합 트레이딩 시스템 역할을 합니다. 구매 후 저에게 연락해 주시면, 트레이딩 팁과 함께 특별한 보너스를 제공해 드립니다! Scalper Vault는 추측에 의존하거나 복잡한 수동 분석을 할 필요를 없애주며, 사용하기 쉬운 트레이딩 기법을 통해 오직 매매 실행에만 집중할 수 있도록 돕습니다. 정확한 추세 추종 신호: 핵심 알고리즘이 시장 구조를 분석하여, 지배적인 시장 추세 방향과 일치하는 고확률 신호만을 제공함으로써 잘못된 진입을 획기적으로 줄여줍니다. 정밀한 고점 및 저점 탐지: 시장의 움직임이 소진되는 지점을 스캔하여 잠재적인 반전 구간을 식별합니다. 간(Gann) 이론 기반의 매수/매도 구간: 수학적
Apex Patterns PRO 인디케이터 구매 시 - 기반 Expert Advisor 무료 제공. 자체 최적화 차트 패턴 및 브레이크아웃 분석 시스템 기존의 패턴 스캐너는 고정된 파라미터에 의존하므로 시장 변동성과 구조가 변화할 때 성능이 저하되는 경우가 많습니다. Apex Patterns PRO는 구조적 차트 패턴 인식, 모멘텀 필터링, 통계적 자체 최적화를 하나의 분석 프레임워크로 결합하여 변화하는 시장 환경에 적응하도록 설계되었습니다. 적응형 스캐닝 엔진 자체 최적화 패턴 모드 최근 과거 데이터를 바탕으로 적절한 패턴 파라미터를 자동으로 탐색하여, 정적인 설정 대신 현재 시장 행보에 맞춰 인디케이터의 구조 감지 방식을 적응시킵니다. 스마트 브레이크아웃 필터링 클래식 패턴 인식과 모멘텀, 거래량, 프라이스 액션 지표를 결합합니다. 모든 브레이크아웃을 동일하게 다루는 대신, 시장의 기저 구조를 평가하여 현재 통계적 환경에 부합하는 셋업을 식별합니다. 주요 기능 리페인트 없는 고
Crystal Heikin Ashi Signals
Muhammad Jawad Shabir
5 (5)
Crystal Heikin Ashi Signals—Professional Trend & Signal Detection Indicator Advanced Heikin Ashi Visualization with Intelligent Signal System for Manual & Automated Trading Final Price: $149 ---------> Price goes up $10 after every 10 sales . Limited slots available — act fast . Overview User Guide PDF Crystal Heikin Ashi Signals is a professional-grade MetaTrader 5 indicator that combines pure Heikin Ashi candle visualization with an advanced momentum-shift detection system. Designed for both m
Trend Catcher ind mt5
Ramil Minniakhmetov
5 (18)
트렌드 캐처 인디케이터 트렌드 캐처 인디케이터는 개발자가 자체 개발한 맞춤형 적응형 트렌드 분석 지표들을 조합하여 시장 가격 움직임을 분석합니다. 단기적인 노이즈를 제거하고 근본적인 모멘텀 강도, 변동성 확대, 가격 구조 움직임에 집중하여 진정한 시장 방향을 파악합니다. 또한 이동 평균, RSI, 변동성 필터와 같은 맞춤형 지표들을 활용하여 가격을 평활화하고 트렌드를 필터링합니다. 실제 운영 모니터링 및 기타 제품은 다음 링크에서 확인하실 수 있습니다:   https://www.mql5.com/en/users/mechanic/seller 텔레그램에서는 EA나 설정 파일을 판매하지 않습니다. 사기이니 주의하세요. 모든 설정 파일은 블로그에서 무료로 제공됩니다. 중요! 구매 후 즉시 연락 주시면 사용 방법 및 보너스를 드립니다!
Volatility Master for MetaTrader is a real-time dashboard tool that scans up to  50 symbols  to identify high-volatility , trending markets instantly. With bullish/bearish signals, customizable alerts, and a user-friendly interface, it helps you avoid range-bound conditions and focus on high-probability trades. Clarity leads to confidence. Trade confidently and protect your capital effectively with this powerful dashboard. We don't offer free or bonus indicators in exchange of reviews from you.

SIO Oscillator
Davit Beridze
SIO Oscillator: 자기 최적화 세미분산 불균형 오실레이터 지표를 구매하시면 이를 기반으로 한 전문가 어드바이저(EA)를 무료로 받으실 수 있습니다. 대부분의 오실레이터는 모든 가격 움직임을 똑같이 취급합니다. SIO는 상승 압력과 하락 압력을 분리하여 둘 사이의 불균형을 측정하고, 매수자와 매도자 중 어느 쪽이 실제로 시장을 주도하고 있는지 보여줍니다. 불균형이 극단에 도달하면 SIO는 진입가, 손절(Stop Loss), 익절(Take Profit) 수준이 포함된 명확한 신호를 표시합니다. SIO의 차별점은 고정된 설정에 의존하지 않는다는 것입니다. 내장된 자기 최적화 엔진이 현재 종목과 시간 프레임에 맞는 파라미터를 지속적으로 탐색하고, 사용하기 전에 검증합니다. 두 가지 신호 모드 평균 회귀(Mean Reversion): 불균형의 극단에서 거래하며 균형으로의 복귀를 노립니다. 추세 추종(Trend Following): 지속적이고 우세한 불균형의 방향으로 거래합니다. 자
Dynamic Forex28 Navigator MT5
Bernhard Schweigert
5 (1)
다중 통화 강도 및 모멘텀 지표 MT5 Dynamic Forex28 Navigator는 오랫동안 사랑받아 온 저희 지표의 진화 버전으로, 세 가지 기능을 하나로 결합했습니다: Advanced Currency Strength28 Indicator (리뷰 700개) Advanced Currency IMPULSE with ALERT (리뷰 530개) CS28 Combo Signals (최근 보너스) 두 이전 지표는 MQL5 Market에서 합계 1,200개가 넘는 리뷰를 받았으며 2016년부터 MT4 커뮤니티의 필수품이었습니다. Dynamic Forex28 Navigator MT5는 검증된 동일한 로직을 그대로 이어갑니다. MetaTrader 5를 위해 완전히 다시 제작 – MT5의 네이티브 다중 심볼 아키텍처를 최대한 활용하도록 설계되었습니다. 사용 설명서: https://www.mql5.com/en/blogs/post/758844 MT4 버전을 찾고 계신가요? 여기를 클릭하세요: ht
Neuro Poseidon MT5
Daria Rezueva
4.68 (53)
Neuro Poseidon is a new indicator by Daria Rezueva. It combines precise trading signals with adaptive TP/SL levels - creating best possible trades as a result! Message me and get  Neuro Poseidon Assistant  as a gift to automize your trading process! What makes it stand out? 1. Proven profitability on all assets and timeframes 2. Only confirmed BUY and SELL signals present on the chart 3. Adaptive TP & SL levels generated by the software for each trade 4. Easy to understand - suitable for al
AriFocus
Temirlan Kdyrkhan
AriFocus - Non-Repainting Buy/Sell Signals AriFocus - one clear signal. AriFocus marks buy and sell signals directly on the chart and suggests a stop-loss level for each one. Every signal is confirmed on bar close and never repaints. - Buy/sell arrows, confirmed on bar close - Suggested stop-loss level for every signal - Trend band and candle coloring to show direction at a glance - 10 ready-made presets, or your own settings (14 calculation methods) - Pop-up, push and email alerts with entr
통화 강도 마법사는 성공적인 거래를 위한 올인원 솔루션을 제공하는 매우 강력한 지표입니다. 표시기는 여러 시간 프레임의 모든 통화 데이터를 사용하여 이 또는 해당 외환 쌍의 힘을 계산합니다. 이 데이터는 특정 통화의 힘을 확인하는 데 사용할 수 있는 사용하기 쉬운 통화 지수 및 통화 전력선의 형태로 표시됩니다. 필요한 것은 거래하려는 차트에 표시기를 부착하는 것뿐입니다. 표시기는 거래하는 통화의 실제 강세를 보여줍니다. 지표는 또한 추세와 거래할 때 유리하게 사용할 수 있는 구매 및 판매 거래량 압력의 극한값을 보여줍니다. 지표는 또한 피보나치에 기반한 가능한 대상을 보여줍니다. 표시기는 PUSH 알림을 포함한 모든 유형의 알림을 제공합니다. 구매 후 연락주세요. 나는 당신과 거래 팁을 공유하고 당신에게 무료로 훌륭한 보너스 지표를 줄 것입니다! 나는 당신에게 행복하고 유익한 거래를 기원합니다!
Advance AI Scanner
Mohamed Samsudeen
5 (1)
Advance AI Scanner is a multi-symbol analysis indicator for MetaTrader 5. It scans Forex pairs, metals, energy, stock indices and cryptocurrencies at the same time and rates each instrument with its own self-training model. It explains in plain English what moved each market and why, and it estimates how far upcoming economic news usually moves each symbol, measured on your broker's own price history. $199 instead of $499. 10 copies left at this price. One time purchase  Installation and User
Azimuth Pro
Ottaviano De Cicco
5 (7)
Azimuth Pro V2: Synthetic Fractal Structure and Confirmed Entries for MT5 Overview Azimuth Pro is a multi-level swing structure indicator by Merkava Labs . Four nested swing layers, swing-anchored VWAP, ABC pattern detection, three-timeframe structural filtering, and closed-bar confirmed entries — one chart, one workflow from micro-swings to macro-cycles. This is not a blind signal product. It is a structure-first workflow for traders who care about location, context, and timing. Halloween P

SkyHammer Signal Pro
Shengzu Zhong
5 (4)
SkyHammer Signal Pro Entry, SL, TP 레벨이 고정되는 전문 No-Repaint 추세 신호 인디케이터 SkyHammer Signal Pro는 명확하고 고정되며 검증 가능한 신호를 원하는 트레이더를 위해 설계된 구조적인 추세 및 모멘텀 신호 인디케이터입니다. 특히 M1 및 M5 같은 낮은 시간대에서 가장 효과적으로 작동합니다. 이 인디케이터는 시장의 고점이나 저점을 예측하려고 하지 않습니다. 대신 신호를 생성하기 전에 확인된 시장 구조, 추세 방향, 모멘텀 강도, 건강한 변동성, 그리고 목표까지의 충분한 공간을 기다립니다. 주요 기능 고정 신호 메커니즘 신호가 확인되면 화살표, Entry, Stop Loss, TP1, TP2 레벨이 차트에 영구적으로 고정됩니다. 이후 캔들 움직임 때문에 신호가 사라지거나, 이동하거나, 변경되지 않습니다. 이를 통해 트레이더는 각 신호를 명확하게 검토할 수 있으며, 실시간 시장에서 신호가 사라지는 일반적인 문제를 피할 수 있습니다
Break and Retest Hunter
Mohamed Hassan
4 (4)
Break and Retest Hunter is a powerful MetaTrader 5 indicator designed to automatically identify support and resistance levels, breakout structures, and potential retest opportunities in real time. Bonus Indicator: After purchasing Break and Retest Hunter , contact me to receive Trade Indicator Assistant EA completely free as a bonus utility. $65 for the next 10 copies . Next price is $120.  Combining adaptive market analysis, clear BUY/SELL signals, Fibonacci-based profit targets, and a premiu
Bill Williams Advanced
Siarhei Vashchylka
5 (11)
Bill Williams Advanced is designed for automatic chart analysis using Bill Williams' "Profitunity" system. The indicator analyzes four timeframes at once. Manual (Be sure to read before purchasing) Advantages 1. Analyzes the chart using Bill Williams' "Profitunity" system. Signals are displayed in a table in the corner of the screen and on the price chart. 2. Finds all known AO and AC signals, as well as zone signals. Equipped with a trend filter based on the Alligator. 3. Finds "Divergence Bar
제작자의 제품 더 보기
Trend Signal Navigator EA – free companion EA for the Trend Signal Navigator indicator This EA trades the confirmed, non-repainting signals of the Trend Signal Navigator indicator automatically, with professional risk and trade management. It is free: you don't need to send a private message or wait for a "bonus EA". How it works Live and demo charts : the EA reads the signals, stop loss and targets of the Trend Signal Navigator indicator through iCustom (default path Market\Trend Signal Navigat
FREE
Overview SR Confluence Pro is a professional MetaTrader 5 indicator for support & resistance and chart pattern analysis. It combines dual S&R engines (high-volume box engine + multi-timeframe pivot engine), automatic detection of 16+ classic chart patterns , and a confluence scoring system that rates how closely price structure and S&R levels align. Every zone is back-tested on the chart history — touches, bounces, breaks, false breaks and bounce rate are combined into a 0–100 strength score — a
A chart overlay indicator for traders who want a structured view of Smart Money Concepts, market structure shifts, order block patterns, fair value gaps, equal highs and lows, and key multi-timeframe price levels directly inside MetaTrader 5. BOS and CHoCH · Internal and Swing Structure · Order Block Finder · Input-Controlled FVG Colors · EQH and EQL · Premium and Discount Zones Product Overview SMC Price Action Patterns is designed to convert raw price action into a clear, visual market map. T
FREE
MACD Divergence Radar Pro Multi-Symbol Divergence Scanner & Visual Dashboard for MetaTrader 5 Regular & Hidden Divergence 20+ Pairs Simultaneous Scan Entry / SL / TP Levels History Statistics One-Click Chart Opening Auto Oscillator Sub-Window Overview MACD Divergence Radar Pro is a professional-grade divergence detection indicator that continuously scans multiple currency pairs and timeframes in real time. It identifies both regular and hidden MACD divergences — bullish and bearish — and presen
Professional account protection for prop-firm challenges and funded accounts. It monitors drawdown, open risk, news windows, trading sessions, manual trades, profit targets, and challenge progress in real time, then warns, locks, de-risks, deletes orders, or closes managed exposure according to your rules. Two draggable on-chart panels — Economic Calendar and Performance Stats — keep news planning and account analytics on the chart without leaving MT5. Built for Prop-Firm Traders This EA does no
VoidFlow IFVG Trade Assistant Pro is a manual-first MetaTrader 5 trading panel for Inverse Fair Value Gap (IFVG) setups. It finds fair value gaps, confirms when price closes through them, scores every setup from 0 to 100, draws a complete trade plan and lets you place the order with one click and one confirmation. Automatic entries are available as an option you switch on yourself. Video walk-through: see the video on this page. Free demo: download it and run it in the Strategy Tester (the demo
ICT Market Structure Pro ICT Market Structure Pro is a Smart Money Concepts / ICT trading tool designed to automatically draw the most important structural and liquidity elements directly on the chart. The indicator helps traders read price action through an institutional lens by mapping market structure shifts, liquidity pools, order blocks, imbalances, premium/discount zones, and key ICT session windows in one place. It supports both single-timeframe and multi-timeframe analysis modes, with a
Trade Assistant Risk Calculator is an all-in-one floating trading panel (Expert Advisor) designed for professional manual traders on MetaTrader 5. It combines Visual Chart Trading , Automatic Risk Calculation , and Advanced Position Management into a single, compact interface. Stop calculating lot sizes manually. Stop guessing your Risk:Reward ratio. Simply drag lines on the chart, and the EA calculates the exact lot size to match your risk percentage, equity, or money target. Important Notes Th
Trade Assistant Risk Calculator is an all-in-one floating trading panel Expert Advisor for MetaTrader 5, built for professional manual traders. It combines visual chart trading , automatic risk calculation , and advanced position management in one compact interface. Stop calculating lot sizes manually. Stop guessing your Risk:Reward ratio. Drag the planning lines on the chart and the EA calculates the exact lot size for your selected risk percentage, equity, fixed-money risk, or fixed-lot workfl
MT5 Indicator · All Markets · Non-Repainting Signals · Entry / SL / TP1-TP3 · MTF + Scanner Momentum Pulse colors every candle by the real momentum behind it, not by price alone. Each bar is scored on five dimensions and placed in one of nine strength states . On top of that you get buy/sell signals with Entry, Stop Loss and three Take Profit levels , a multi-timeframe bias dashboard , a multi-symbol scanner , a forward test of every past signal with win rate and profit factor, and a risk-based
Supertrend core · 11 click-to-toggle confirmation filters · Multi-timeframe trend dashboard · Entry / SL / TP1-TP3 levels · Higher-timeframe filter · Trend cloud · 5,000-bar performance simulation with profit factor & drawdown TrendGuard Pro is a professional-grade MT5 scalping indicator that fortifies every entry signal with up to 11 independent confirmation filters . False breakouts are systematically eliminated before an arrow ever appears on the chart, letting you trade only the highest-pro
ICT Market Structure EA ICT Market Structure EA trades fair value gaps in the direction of market structure, only inside the ICT Silver Bullet hours, and only when the H4 and D1 structure agree. One EA on one chart trades a whole portfolio — by default EURUSD, XAUUSD, USTEC and US500 . Its higher-timeframe context uses the same detection code as the indicator ICT Market Structure Pro (swings, BOS / CHoCH, order blocks, FVGs, premium / discount). The default portfolio and settings were checked wi
Price Action 10 Setups EA Price Action 10 Setups EA automates ten classic bar-by-bar price-action setups — the patterns that discretionary price-action traders consider the most reliable: major trend reversals, final flags, breakouts, High 2 / Low 2 pullbacks, wedges, channels, measured moves, trading-range reversals, opening reversals and magnet (breakout) tests. Every setup is a fully coded rule set with a precise entry, stop and target, so the EA trades the patterns the same way every time. O
MACD Divergence Radar EA MACD Divergence Radar EA trades MACD divergences automatically. It uses the same signal engine as the indicator MACD Divergence Radar Pro — price pivots compared with the MACD histogram (OsMA) or the MACD main line, regular and hidden divergences, bullish and bearish — and turns every freshly confirmed divergence into a trade with a stop beyond the divergence pivot and a fixed reward-to-risk target. One EA on one chart can trade a whole portfolio; by default EURUSD, GBPU
TrendGuard Pro Auto EA is a fully automated trend-following Expert Advisor built on the TrendGuard Pro signal engine. It enters when the Supertrend flips and the confirmation filters agree, protects every trade with an ATR stop loss, can bank profits in steps at TP1 / TP2 / TP3, lets winners run with an ATR trailing stop, and exits on the opposite signal. It trades the chart symbol, or a whole portfolio of symbols from one chart, and is controlled from an interactive on-chart dashboard. Signal e
Price Action 10 Setups Indicator Price Action 10 Setups Indicator finds ten classic bar-by-bar price-action setups on your chart and turns every one of them into a complete trade plan: entry, stop loss and target , drawn on the chart, tracked bar by bar and summarised in a modern dashboard with per-setup statistics, a multi-symbol scanner and alerts. The detection is the same code as in Price Action 10 Setups EA (the automated version on the MQL5 Market): the indicator shows a signal exactly whe
Momentum Pulse EA trades the signals of the Momentum Pulse indicator automatically. The complete Momentum Pulse signal engine is built into the EA: every closed bar is coloured in one of nine momentum states, and a change of state becomes a buy or sell signal with its own Entry, Stop Loss and three take-profit levels. The EA takes those trades with risk-based position sizing, banks profit in steps at TP1 / TP2 / TP3 and manages the rest with breakeven and an ATR trailing stop. One chart can trad
Harmonic patterns with an honest track record. The indicator finds Gartley, Bat, Alt Bat, Butterfly, Crab, Deep Crab, Shark, Cypher, 5-0 and AB=CD patterns on your chart and on dozens of symbols and timeframes at once, draws the XABCD shape with its Potential Reversal Zone (PRZ) and Fibonacci ratios, gives entry, stop loss and three targets, and shows how often each pattern actually worked on each symbol: PRZ hold rate, TP1 and TP2 hit rate and average result in R , measured with exactly the sam
Currency Strength Matrix measures the strength of the 8 major currencies from all 28 pairs , plus gold and any indices you add, and shows it three ways on one chart: a multi-timeframe heatmap (M5 to D1), strength lines in a sub-window, and an automatic strongest-vs-weakest pair picker . Click any cell or pair and the chart switches to it. Closed bars never repaint, and the indicator shows you how its own picks behaved on the history you have loaded. How strength is measured Each currency is comp
Bitcoin Trend Rider EA Bitcoin Trend Rider EA is a trend-following and volatility-breakout Expert Advisor for BTCUSD , ETHUSD and other crypto CFDs. It stays out of sideways and dead markets, enters only when a trend is confirmed, puts a hard ATR stop on every order and lets winning trends run with a chandelier trailing stop. No grid, no martingale, no averaging down, no hedging tricks. Everything is visible: every input is in the Inputs window, the ready-made setups are listed below, and the lo
Gold Edge Portfolio EA trades XAUUSD with six independent, simple strategies at the same time . Each engine has its own on/off switch, its own magic number and its own risk per trade, and every trade is placed with a hard stop loss . There is no grid, no martingale, no averaging and no hedging — one position per engine at most. What makes it different is transparency : a dashboard on the chart shows the live state and the real statistics of every engine — trades, win rate, profit factor, net pro
Session Breakout Portfolio EA A session-range breakout portfolio for gold, the Nikkei and the yen, traded from one chart. Every market has a quiet session and an active open. The EA builds the range in the quiet session (Asian range, pre-open or opening range), in the exchange's own time zone with automatic daylight saving, and trades the breakout at the active session open with OCO stop orders. One stop-protected trade per market per day. No grid, no martingale, no averaging. Default portfolio
Trend Signal Navigator – trend, signals, targets and honest statistics in one indicator Trend Signal Navigator is an all-in-one trend signal system for MetaTrader 5. It shows the trend direction and regime, gives confirmed non-repainting BUY/SELL signals with an adaptive stop loss and three take-profit targets , marks reversal zones and key levels, and measures how its own signals performed on your chart in a live statistics panel. No hidden rules: every number in the panel can be re-counted fro
Evening Cross MeanReversion EA — Institutional Multi-Pair FX Cross Mean-Reversion Portfolio Evening Cross MeanReversion EA is a professional, non-grid, non-martingale multi-currency mean-reversion Expert Advisor engineered for the post-London evening session and the calm Asian liquidity window. By attaching the EA to a single M15 chart (for example, EURNZD M15 ), it simultaneously monitors and trades up to 8 liquid FX cross pairs ( EURNZD, GBPCAD, GBPJPY, AUDNZD, GBPCHF, EURCHF, GBPAUD, EURCAD )
EA Performance Ledger shows what every Expert Advisor on your account really earns. MetaTrader shows one balance for the whole account; when several EAs, manual trades and copied signals share it, you cannot see which one carries the account and which one drains it. The Ledger reads the account history, rebuilds every closed position and splits the results by EA, symbol, strategy tag, direction and manual vs automated trading, in one clear dashboard. Read-only. The Ledger never places, modifies
Local Trade Copier Pro copies trades between MetaTrader 5 terminals running on the same Windows PC or VPS . One EA, two modes: run it as Master on the account that trades and as Receiver on every account that should follow. Positions, pending orders, SL/TP changes, partial closes and closes are copied within a few hundred milliseconds including the broker's execution (median 333 ms in our live test), through the terminals' shared Common Files folder: no DLL, no internet connection, no extra soft
Currency Strength Matrix EA — Strength Exhaustion on all 28 FX pairs Currency Strength Matrix EA measures the strength of the 8 major currencies ( EUR, GBP, AUD, NZD, USD, CAD, CHF, JPY , optionally plus gold) from all 28 currency pairs on three timeframes, and trades the moment when the strongest and the weakest currency are stretched too far. It is the automated companion of our Currency Strength Matrix Pro indicator and uses the same strength engine. Attach it to one chart (any symbol, any ti
Turn your MT5 account into a signal channel. TradeCast posts every trade action of your account to up to three Telegram channels, groups or private chats: new trades, pending orders, stop-loss and take-profit changes, breakeven, partial and full closes with the result in money, pips and R , a chart screenshot, and daily, weekly and monthly performance summaries. Trades opened by hand, by any Expert Advisor or from the MT5 mobile app are all detected, because TradeCast watches the account itself.
Custom Charts Pro builds seconds charts (S1 … S3600, any value), Renko , Range bars and Tick charts as real MetaTrader 5 custom symbols, from your broker's real ticks . It fills the history first, then keeps every chart updated live, for as many symbols and chart types as you like, from one control panel. The generated charts are normal MT5 charts: your indicators, templates, drawings and Expert Advisors work on them, and so does the Strategy Tester . Chart types Seconds : bars of N seconds (S1,
EA Robustness Lab tells you whether an Expert Advisor's results are robust or overfitted. A good backtest is not proof: it can come from a lucky order of trades, a few outsized wins, costs that were too optimistic, parameters fitted to the past, or a market regime that is gone. The Lab takes the closed trades of a strategy, puts them through Monte Carlo, walk-forward, stability, regime and optimisation tests, compares live trading with the backtest, and sums it all up in one robustness score fro
필터:
리뷰 없음
리뷰 답변