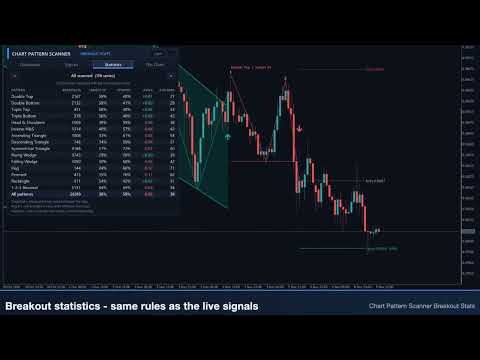
Chart Pattern Scanner Breakout Stats
- インディケータ
- バージョン: 1.0
- アクティベーション: 10

All classic chart patterns, with a track record. The indicator finds double and triple tops and bottoms, head & shoulders and inverse head & shoulders, ascending, descending and symmetrical triangles, rising and falling wedges, flags, pennants, rectangles and 1-2-3 reversals on your chart and on dozens of symbols and timeframes at once. Every pattern is drawn with its neckline or boundary lines, the breakout level, the invalidation (stop) level and the measured-move target - and the panel shows how often that pattern actually reached its target on this symbol and timeframe: target-hit rate, stop rate and average result in R, measured with exactly the same non-repainting rules as the live signals.
The complete manual is on this page: no private messages needed. Example set files are listed at the end.
Why it is different
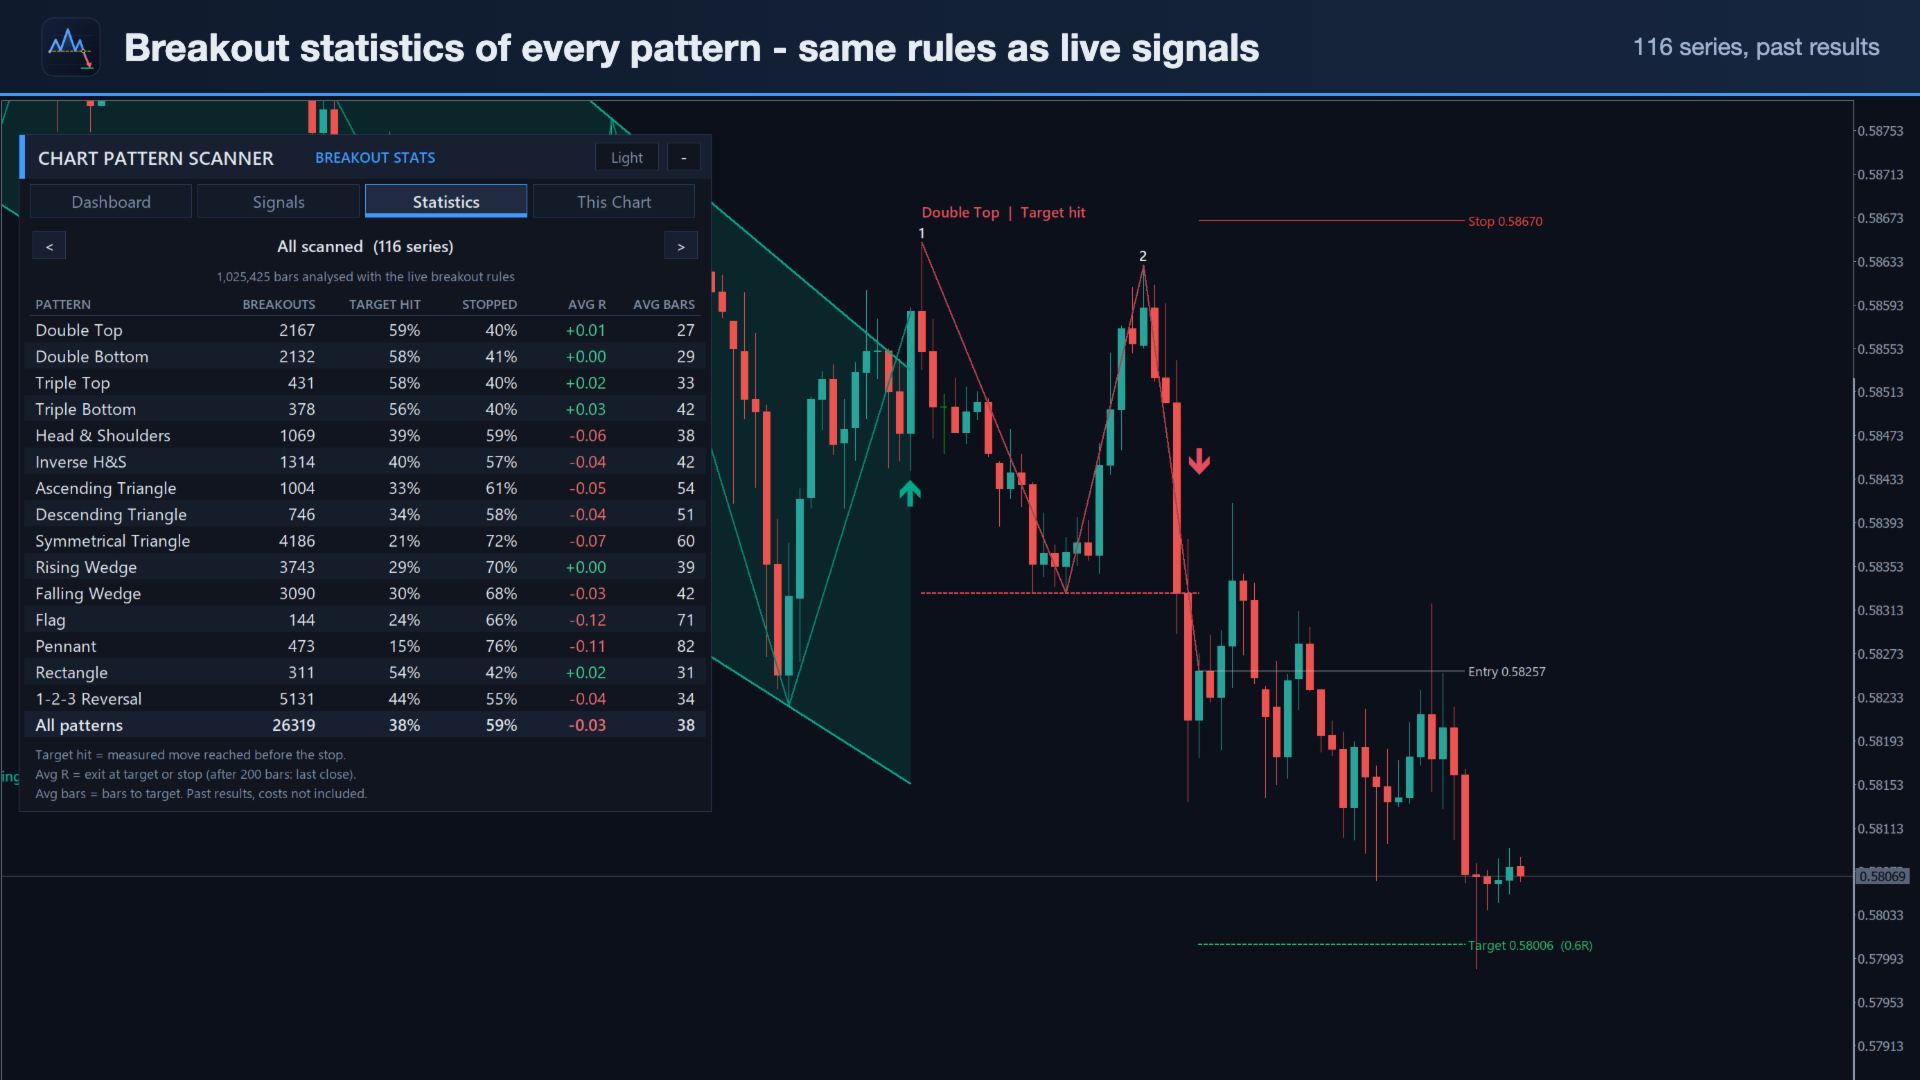
- Breakout statistics built in. For each of the 15 patterns, on this chart, on every dashboard symbol and timeframe and on all of them together: number of breakouts, how many reached the measured move before the stop, how many were stopped, the average result in R and the average number of bars to the target. Every signal shows the target-hit rate of that pattern on that symbol next to it.
- Written breakout rules, no repainting. A pattern is shown as forming once its swings are confirmed, and becomes a breakout only on a closed bar beyond the neckline or boundary. From that bar on it is frozen: never moved, never deleted. A setup that fails (close beyond the invalidation side) or runs out of time simply disappears from the forming list - it is never redrawn as something else.
- One clear level set per pattern: breakout level, stop beyond the invalidation level, one measured-move target and the reward:risk ratio.
- All 15 classic patterns, detector, dashboard and statistics in one product, light on the terminal: a symbol is re-analysed only when it closes a new bar.
Patterns
| Pattern | Shape | Breakout | Stop | Target (measured move) |
|---|---|---|---|---|
| Double Top / Double Bottom | two equal peaks (troughs) with a prior trend | close beyond the neckline (the trough between them) | beyond the peaks | pattern height |
| Triple Top / Triple Bottom | three equal peaks (troughs) | close beyond the neckline | beyond the peaks | pattern height |
| Head & Shoulders / Inverse | head clearly beyond two similar shoulders, sloped neckline | close beyond the neckline | beyond the right shoulder | head to neckline |
| Ascending / Descending Triangle | flat resistance (support) and rising support (falling resistance) | close beyond the flat side | last swing inside the pattern | widest part of the triangle |
| Symmetrical Triangle | falling highs, rising lows | close beyond either line | last opposite swing | widest part |
| Rising / Falling Wedge | both lines rising (falling) and converging | down (up) | last swing inside the pattern | widest part |
| Flag / Pennant | fast pole, then a parallel (flag) or converging (pennant) pause | with the pole | last swing inside the pattern | pole length |
| Rectangle | flat support and flat resistance | close beyond either line | last opposite swing | rectangle height |
| 1-2-3 Reversal | trend into point 1, reaction to 2, weaker retest 3 | close beyond point 2 | beyond point 3 | distance 1-2 |
Detection and breakout rules
- Swings come from a zigzag of confirmed pivots (a pivot needs Swing Depth bars on each side and a minimum size in ATR). Two pattern sizes are searched by default (depth 5 and 10).
- Equal peaks and flat lines use a tolerance in % of the pattern height; patterns must be at least Minimum Pattern Height × ATR tall. Reversals need a prior trend into the pattern.
- Triangles, wedges and rectangles need five touches (three on one line). Flags and pennants need a pole at least twice the flag height that is not retraced by more than 50 %.
- A breakout is the first closed bar beyond the line, within the breakout window (pattern width, and before the apex of a triangle or wedge). A close beyond the invalidation side first, or a new extreme of the last swing, cancels the setup. A breakout bar that has already covered half of the target is skipped.
- Entry = close of the breakout bar. Stop = invalidation level + 0.2 ATR (at least 0.3 ATR from the entry). Target = breakout level ± measured move × Target.
- Outcome: the target hit before the stop is a win, the stop first is a loss, a bar touching both counts as a loss; after Max Bars to resolve the result is the last close in R.
Dashboard
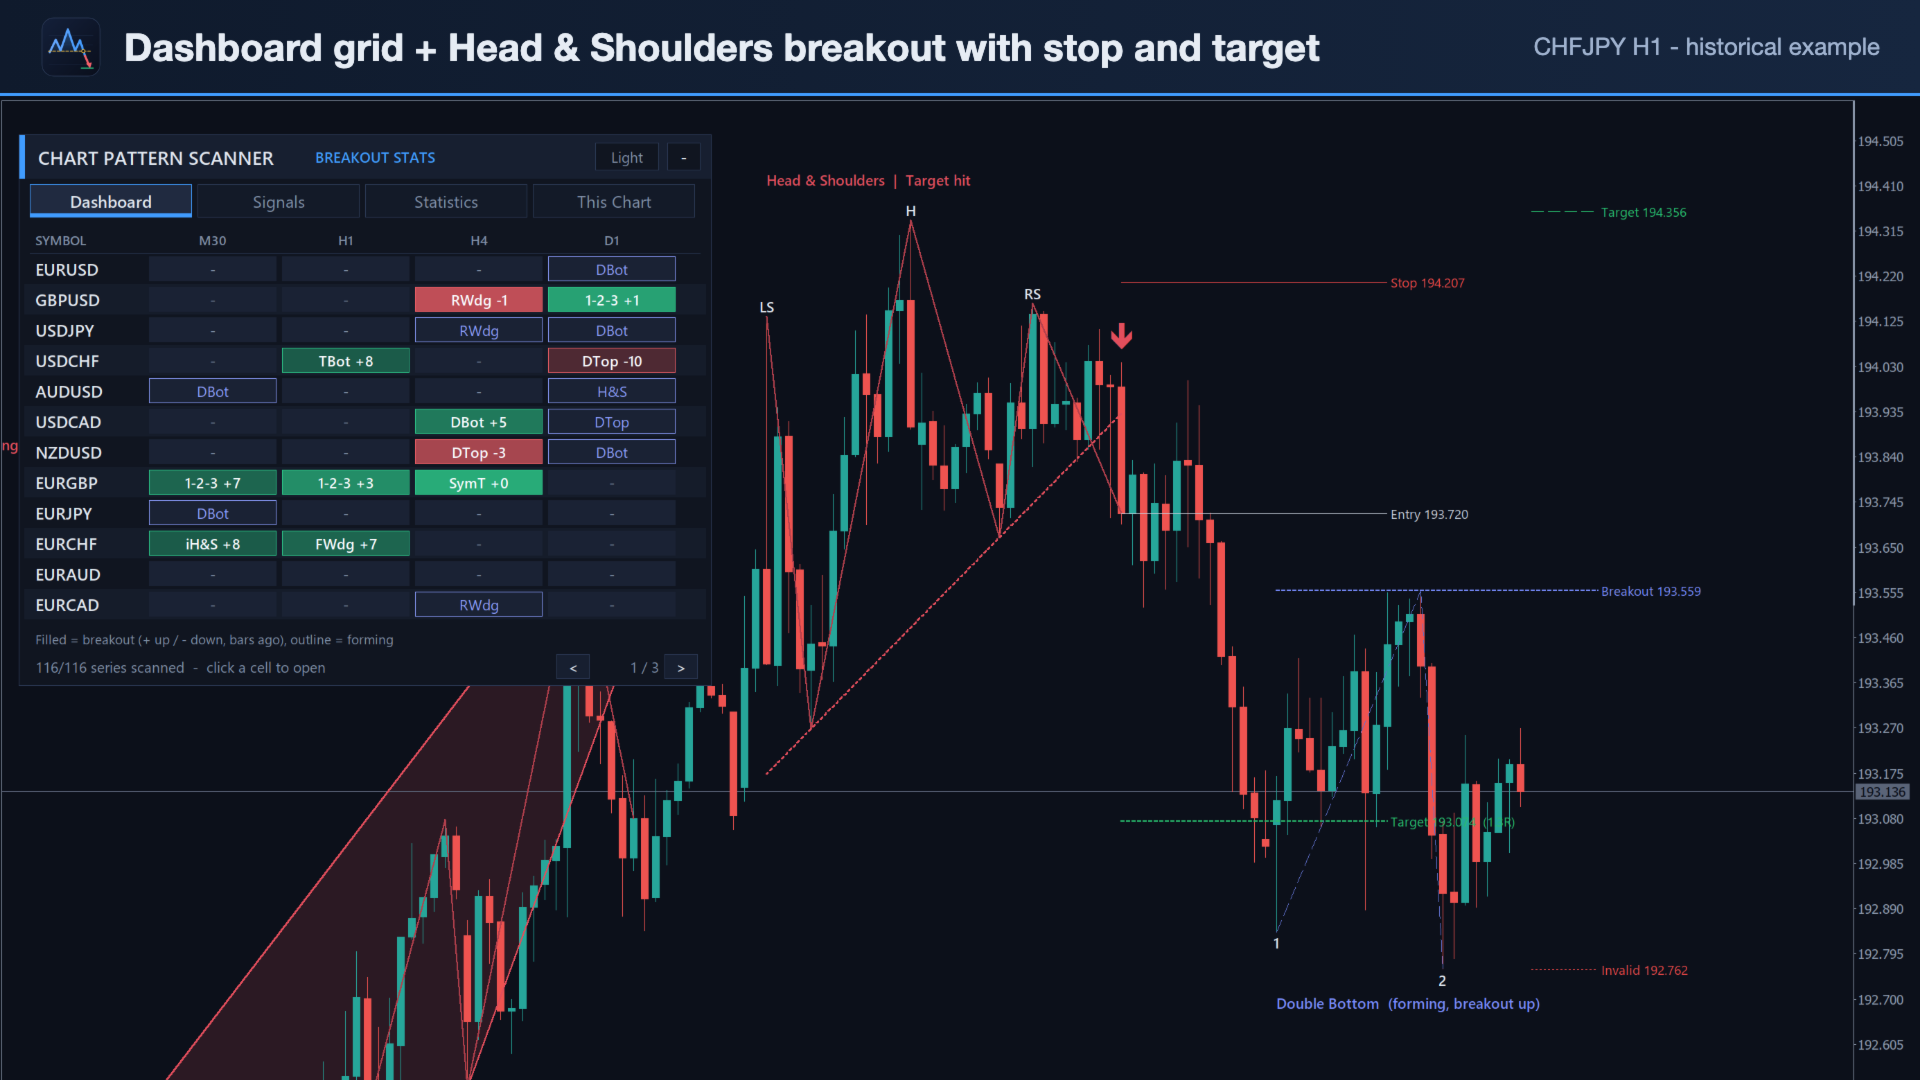
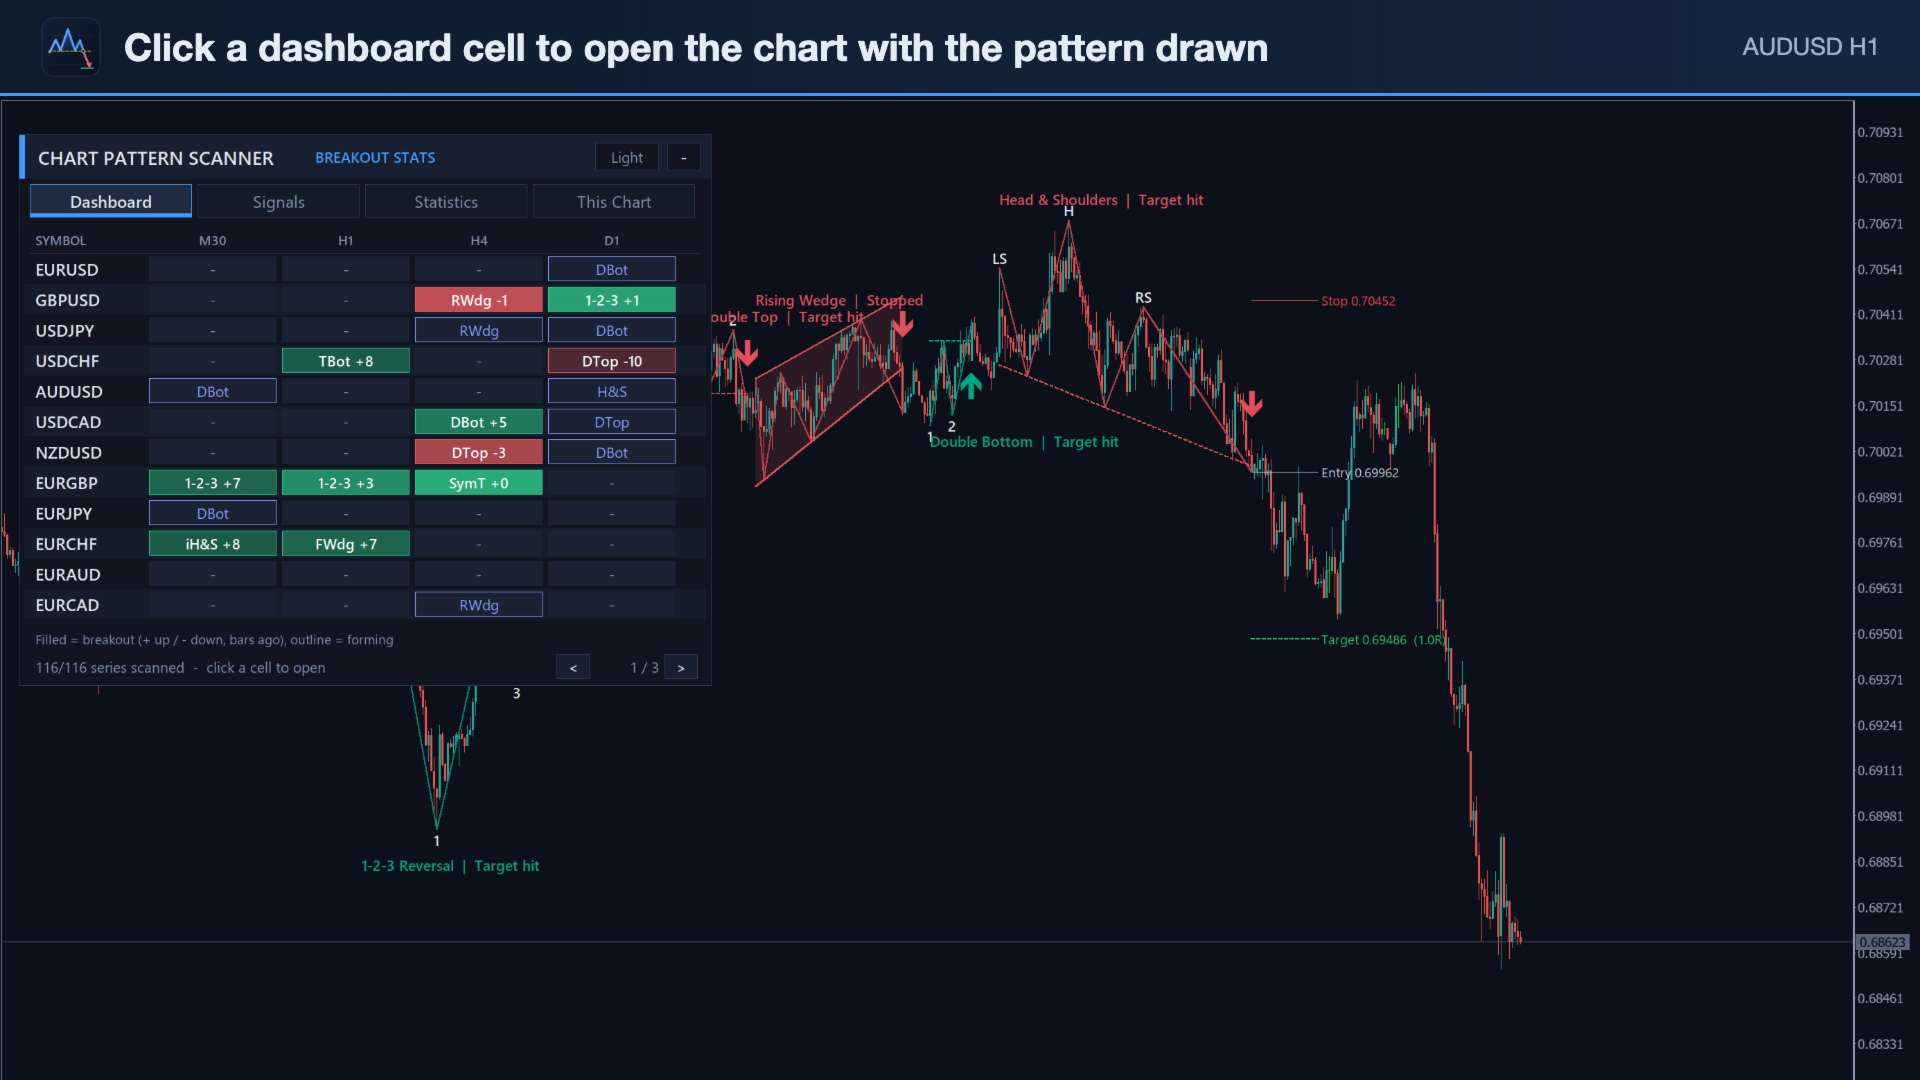
A grid with one row per symbol and one column per timeframe (default M30, H1, H4, D1 and 28 pairs + gold; any list works, broker suffixes such as .a or m are found automatically). A filled cell is a breakout: green up, red down, with the pattern code and the bars since the breakout; the colour fades as it ages. An outlined cell is a forming pattern. Hover a cell for details and the statistics of that pattern on that symbol; click a cell to open the chart (or switch this chart) with the pattern, levels and target drawn.
Signals tab
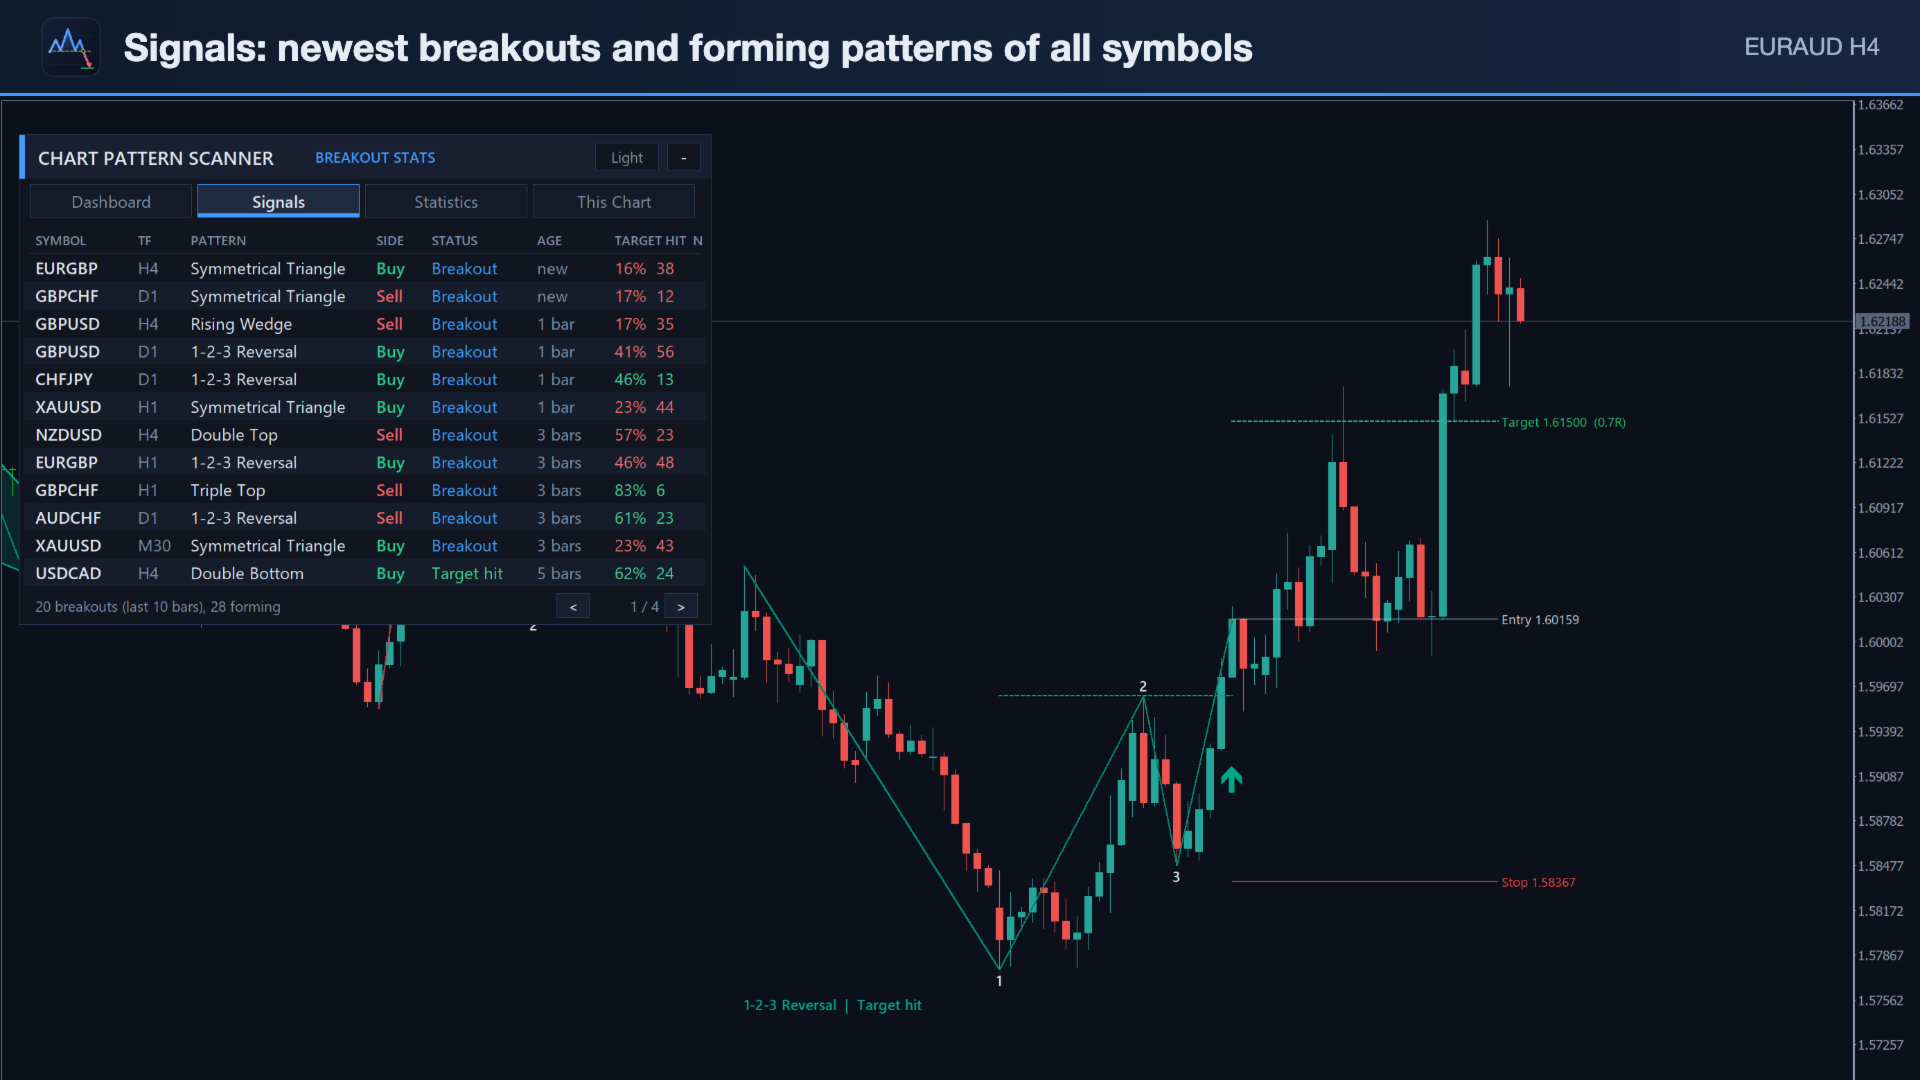
The newest breakouts and forming patterns of all dashboard symbols in one sorted list: symbol, timeframe, pattern, side, status (breakout / target hit / stopped / forming), age and the target-hit rate with the number of cases. Click a row to open the chart.
Statistics tab
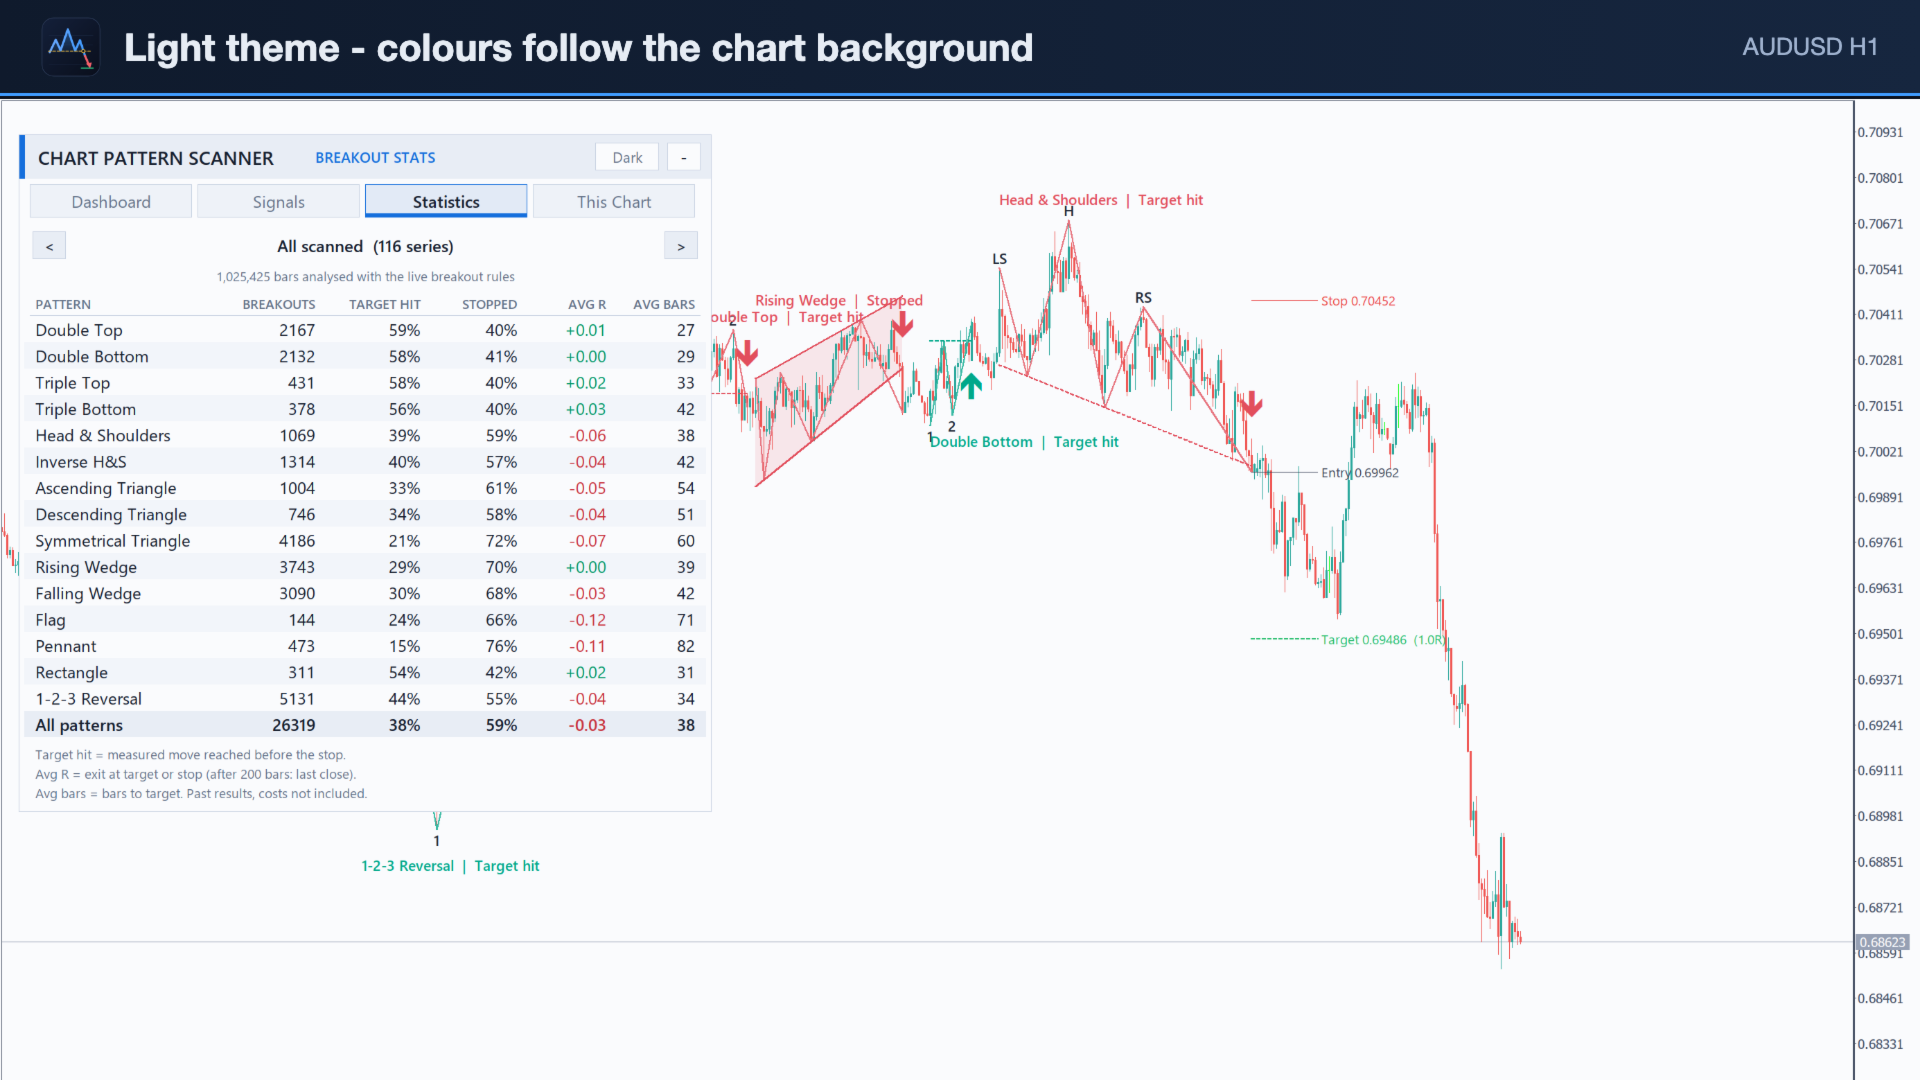
Per pattern: breakouts, target hit %, stopped %, average R and average bars to the target. Switch the scope with the arrows: this chart, any single dashboard symbol/timeframe, or all scanned series together.
This Chart tab
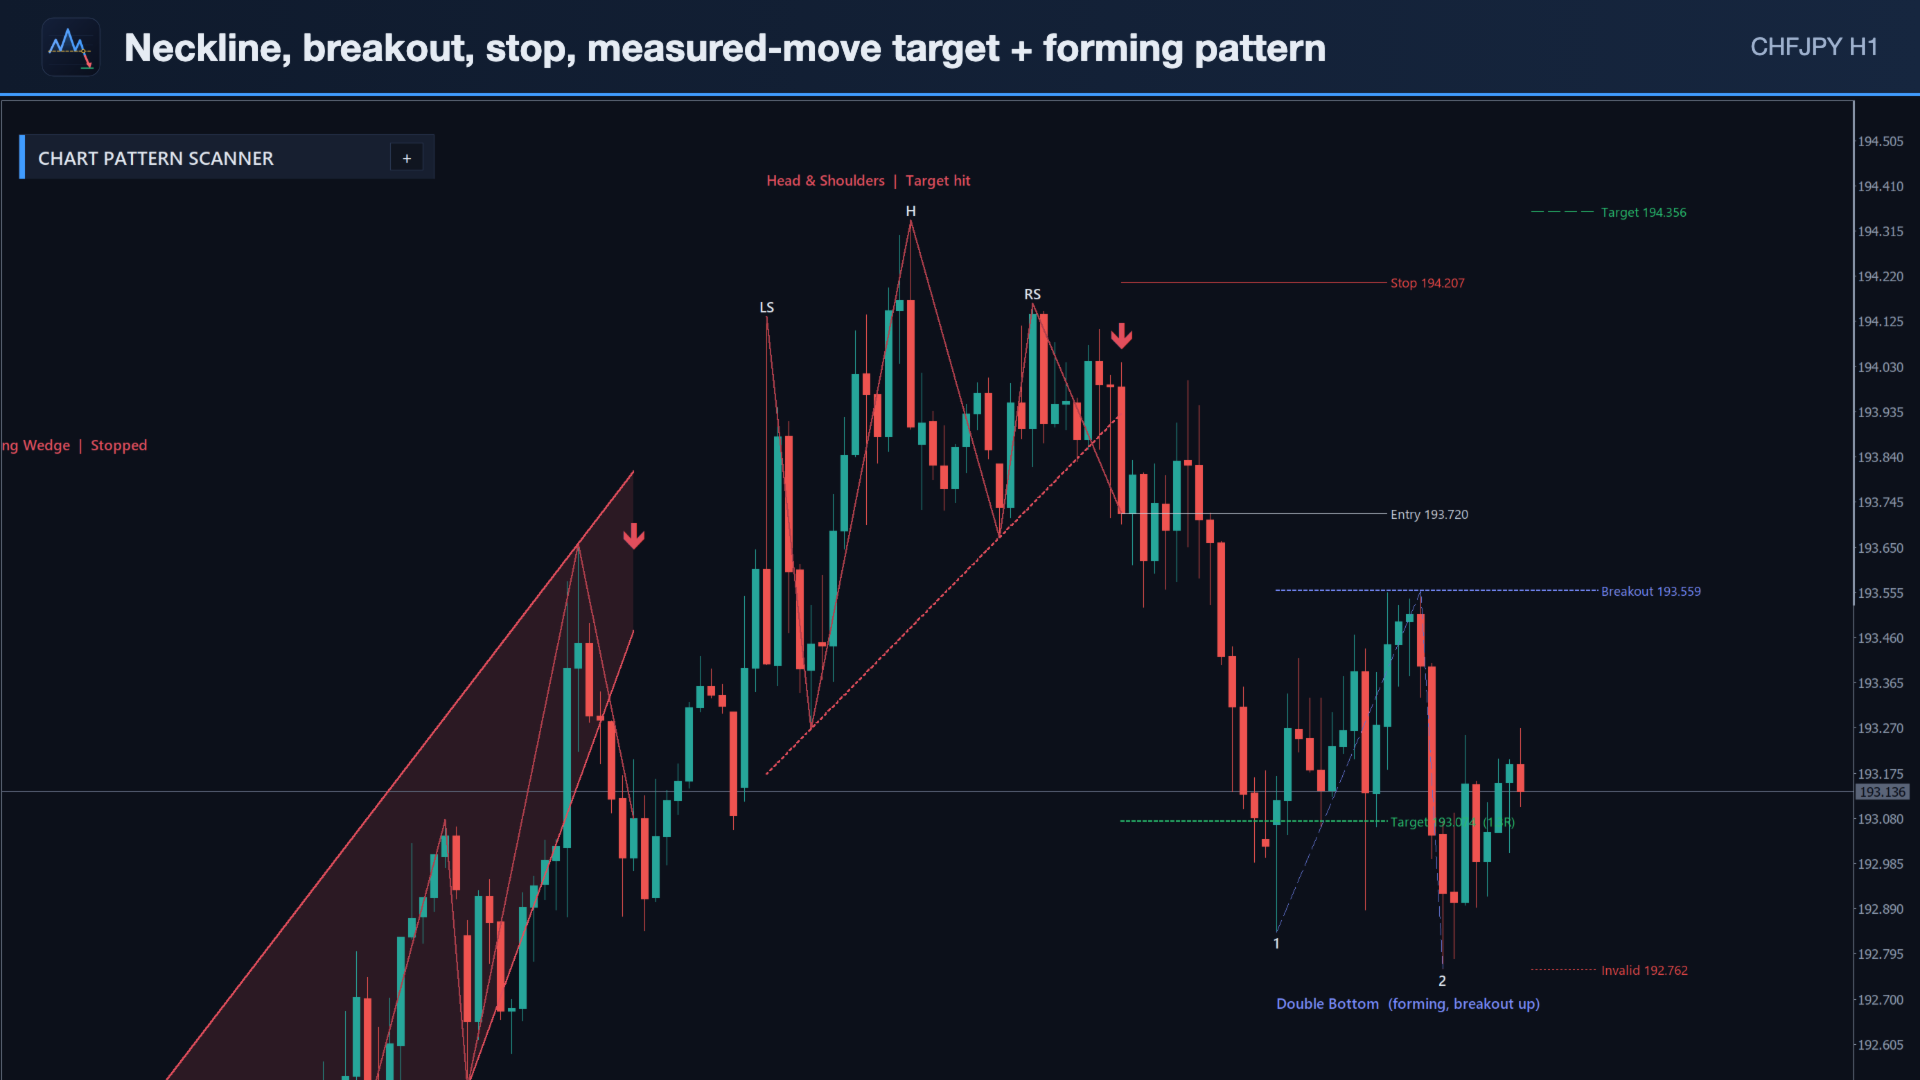
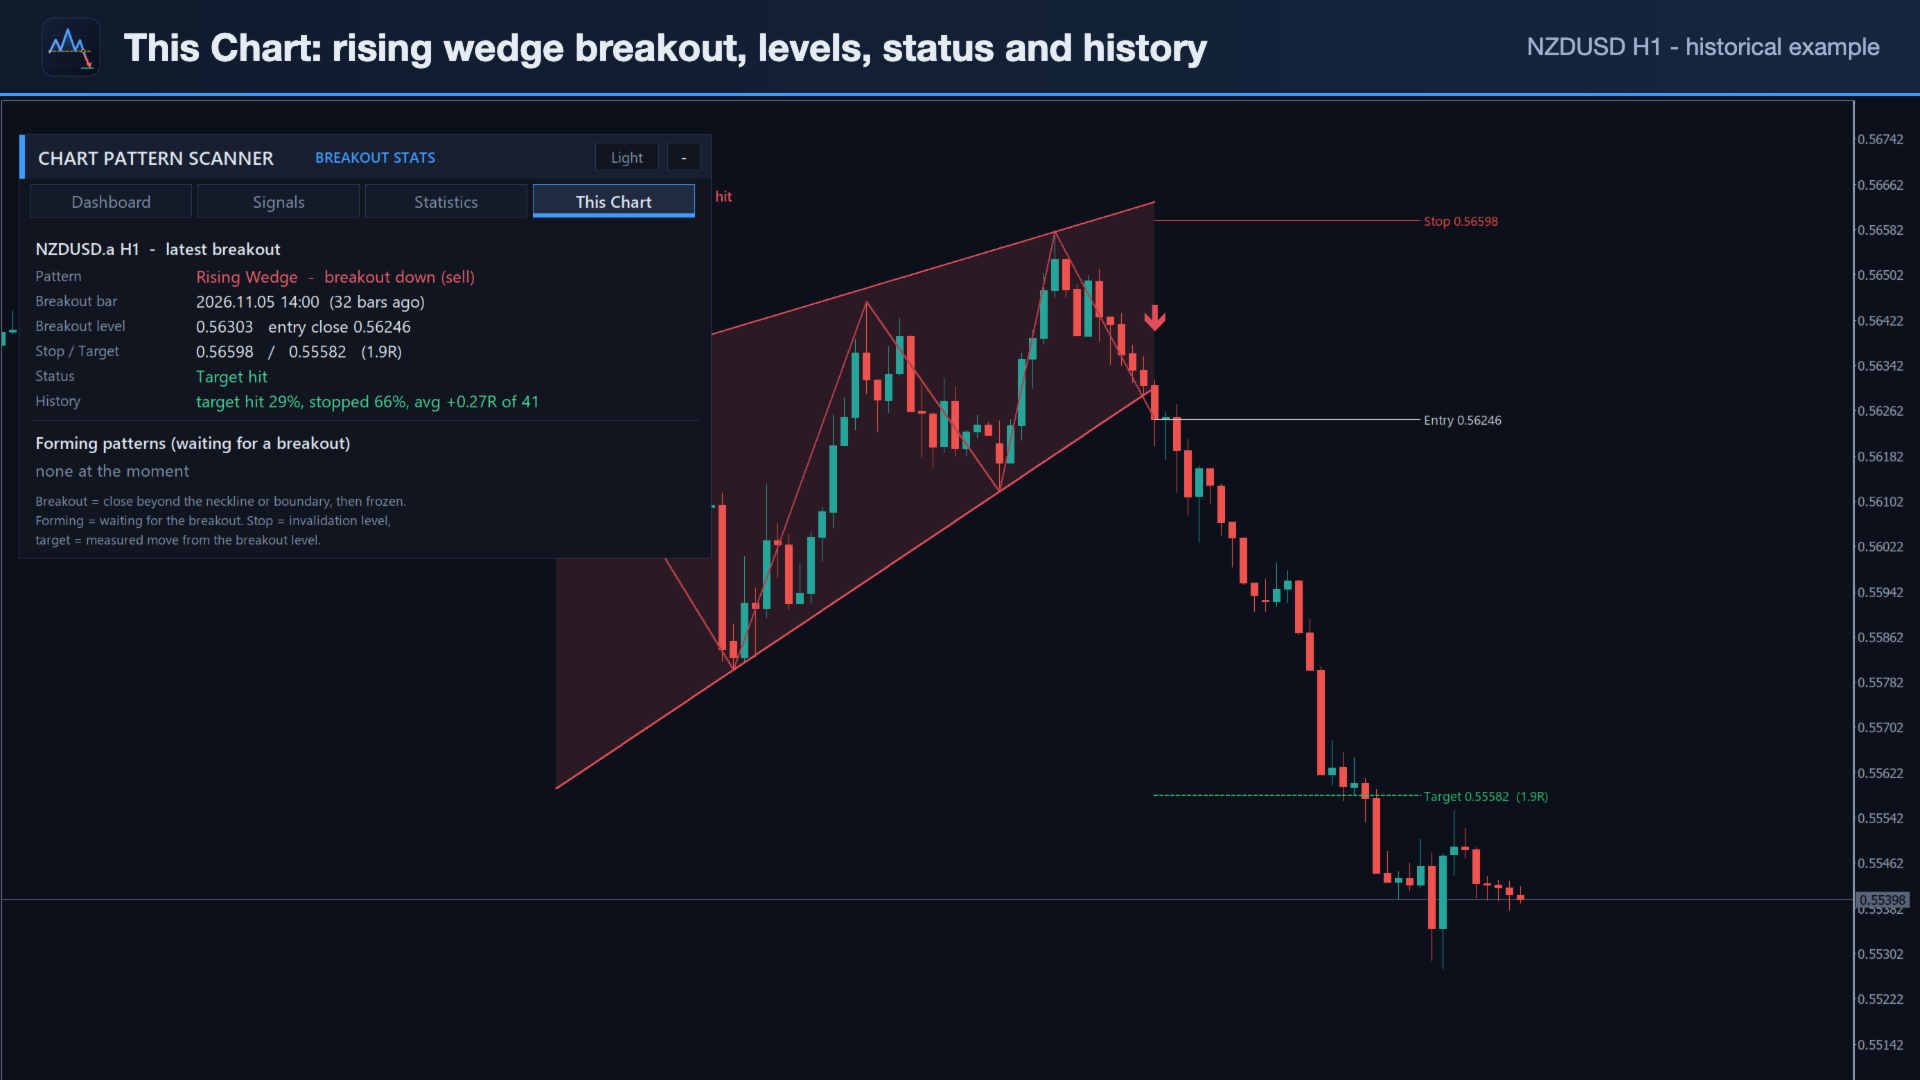
The latest breakout on this chart with its breakout level, entry, stop, target, reward:risk, status and history, plus the forming patterns with their breakout levels.
Chart drawing
- Outline through the swing points (labels LS / H / RS, 1 / 2 / 3), neckline or boundary lines, a light fill for triangles, wedges, flags, pennants and rectangles.
- Breakout arrow, result label (target hit / stopped / active), and for the latest breakout the entry, stop and target lines with prices and R.
- Forming patterns in their own colour with the breakout level(s), the projected target and the invalidation level.
- Patterns drawn on the chart never overlap in time, so the picture stays readable; all colours are inputs.
Alerts
On a confirmed breakout (and optionally on a new forming pattern), for this chart and all dashboard symbols: popup, push notification, e-mail and sound. The message contains the pattern, side, entry, stop, target and the history of that pattern on that symbol.
Panel
Dark and light themes (automatic or one click), DPI scaling, movable by its header, minimisable; position, tab and theme are remembered per chart.
Buffers for Expert Advisors
On the breakout bar of every signal: 0 = signal (+1 buy, -1 sell), 1 = pattern type (0 Double Top, 1 Double Bottom, 2 Triple Top, 3 Triple Bottom, 4 Head & Shoulders, 5 Inverse H&S, 6 Ascending Triangle, 7 Descending Triangle, 8 Symmetrical Triangle, 9 Rising Wedge, 10 Falling Wedge, 11 Flag, 12 Pennant, 13 Rectangle, 14 1-2-3 Reversal), 2 = entry, 3 = stop loss, 4 = target, 5 = breakout level. Empty value elsewhere. Values never change once written; read bar 1 (the last closed bar).
Main inputs
| Input | Default | Meaning |
|---|---|---|
| Pattern families (8 switches) | all on | double, triple, H&S, triangles, wedges, flags/pennants, rectangles, 1-2-3 |
| Pattern Sizes / Swing Depth | Small + Medium / 5 | swing sizes searched |
| Minimum Swing | 1.0 × ATR | ignore tiny swings |
| Equal-Level / Flat-Line Tolerance | 15 % | of the pattern height |
| Minimum Pattern Height | 1.5 × ATR | ignore small patterns |
| Reversals need a prior trend | true | double/triple/H&S only after a move into them |
| Breakout close beyond the line by | 0 × ATR | stricter breakouts when raised |
| Stop beyond the invalidation level | 0.2 × ATR | stop buffer |
| Target | 1.0 × measured move | e.g. 0.7 for a closer target |
| Breakout must come within | 1.0 × pattern width | breakout window |
| History Bars / Max Bars to resolve | 10 000 / 200 | statistics |
| Breakouts drawn / Show Forming | 6 / true | chart drawing |
| Symbols / Timeframes | 28 pairs + XAUUSD / M30,H1,H4,D1 | dashboard (empty symbols = Market Watch, up to 8 timeframes) |
| Show breakouts up to | 10 bars | age limit in the dashboard |
| Cell / Row Click | open chart | or switch this chart |
| Alerts | breakout: popup | popup, push, e-mail, sound, forming alert |
| Theme / Font Size | Auto / 9 | panel look |
Example settings
- Default - all patterns, two sizes, M30-D1 dashboard.
- Swing H4/D1 - Pattern Sizes = Small + Medium + Large, Timeframes = H4,D1.
- Intraday - Timeframes = M15,M30,H1, Show breakouts up to = 6 bars.
- Reversals only - switch off Triangles, Wedges, Flags and Pennants, Rectangles.
- Closer target - Target = 0.7 × measured move (more targets hit, smaller wins).
Installation
- Attach the indicator to any chart (one chart is enough for the whole dashboard).
- Keep the dashboard symbols in Market Watch or let the indicator add them; the first scan loads the history of every symbol and timeframe (a minute or two).
- For push alerts enter your MetaQuotes ID in Tools > Options > Notifications; for e-mail configure Tools > Options > Email.
Notes
- The free demo runs in the Strategy Tester: the dashboard there contains only the tested symbol (the tester provides no other symbols).
- Statistics are computed on your broker's history in your terminal. They describe the past and are not a promise of future results; spread and commission are not included.
- This is an analysis tool. It does not open trades.