SR Confluence Pro

Overview

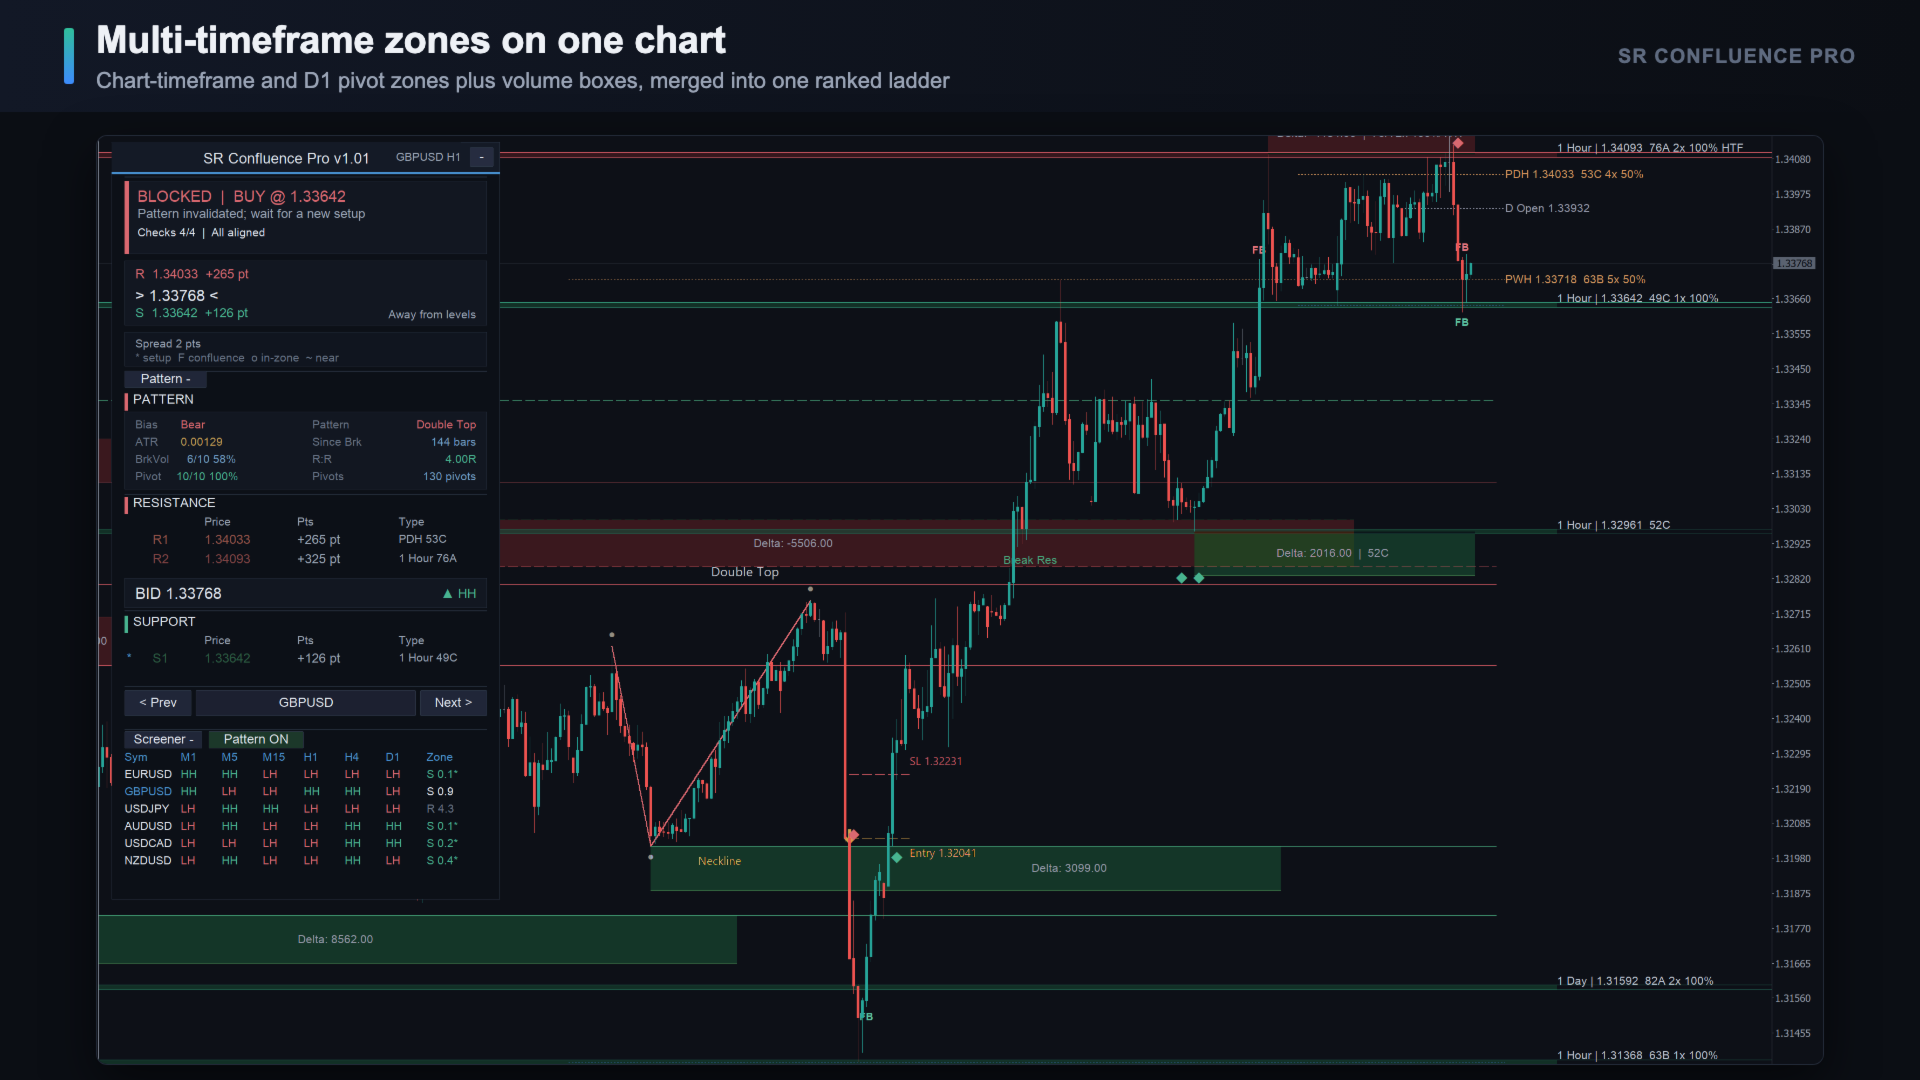
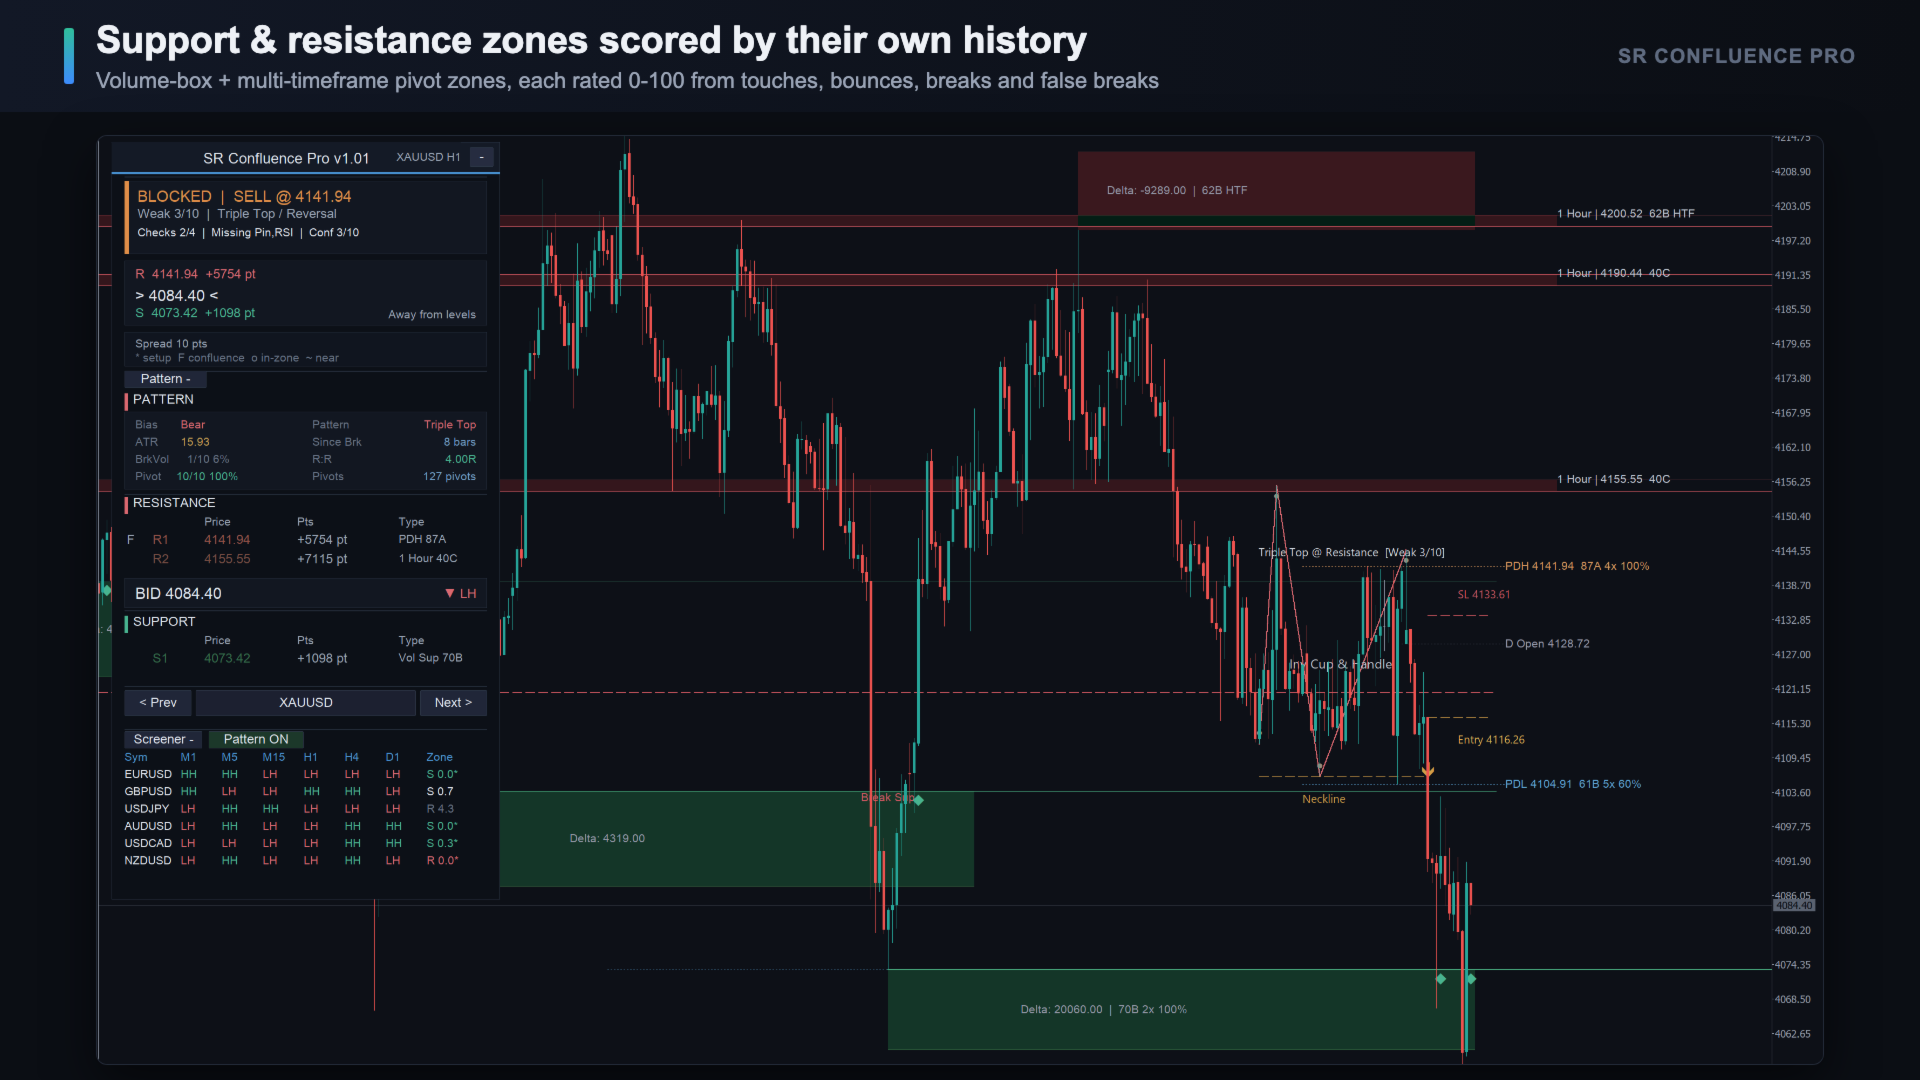
SR Confluence Pro is a professional MetaTrader 5 indicator for support & resistance and chart pattern analysis. It combines dual S&R engines (high-volume box engine + multi-timeframe pivot engine), automatic detection of 16+ classic chart patterns, and a confluence scoring system that rates how closely price structure and S&R levels align. Every zone is back-tested on the chart history — touches, bounces, breaks, false breaks and bounce rate are combined into a 0–100 strength score — and the previous day / week / month highs and lows are added as key levels. Zones, scores, pattern structures, break/retest and false-break events, and high-quality setups are displayed directly on the chart.

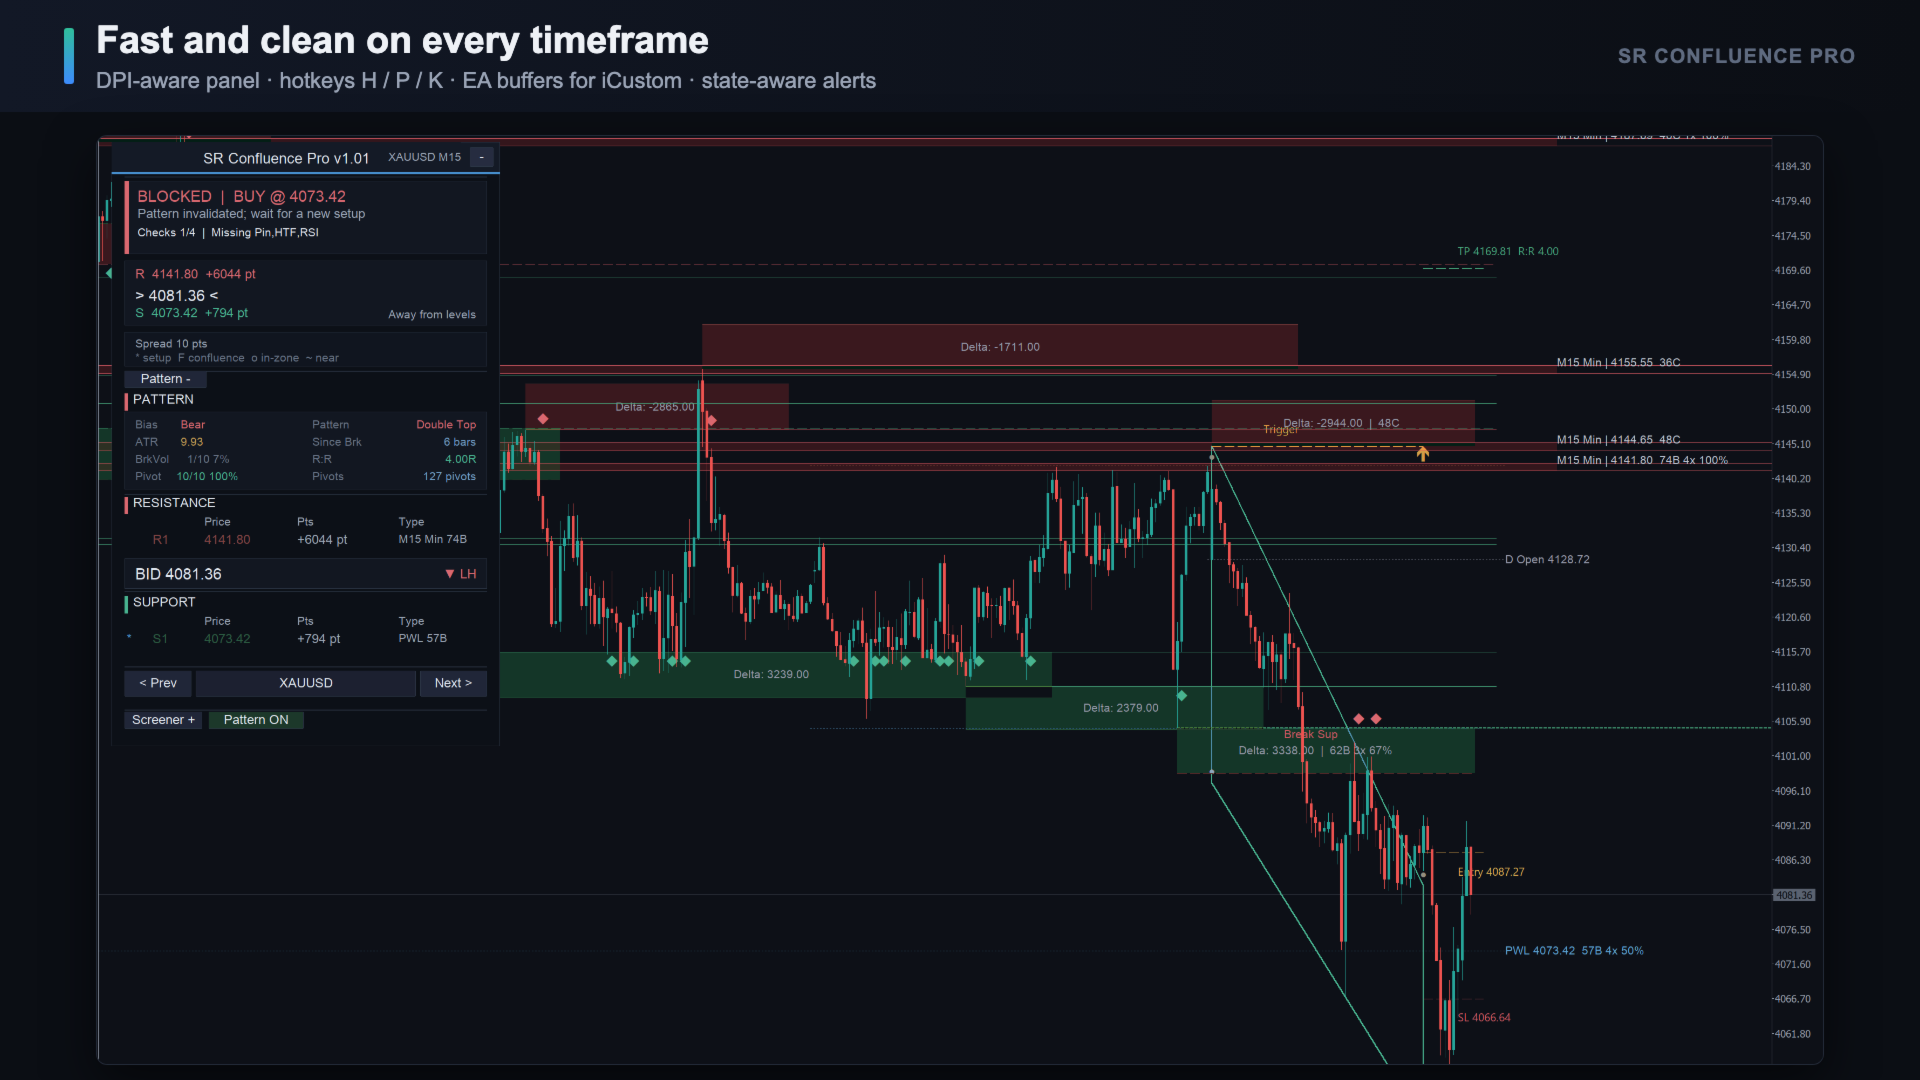
A fast, DPI-aware draggable dashboard, a multi-symbol structure and zone screener, a symbol navigator, hotkeys, EA buffers and a state-aware alert system make it suitable for intraday trading, swing trading, and multi-timeframe confluence analysis.

Dual-Engine S&R

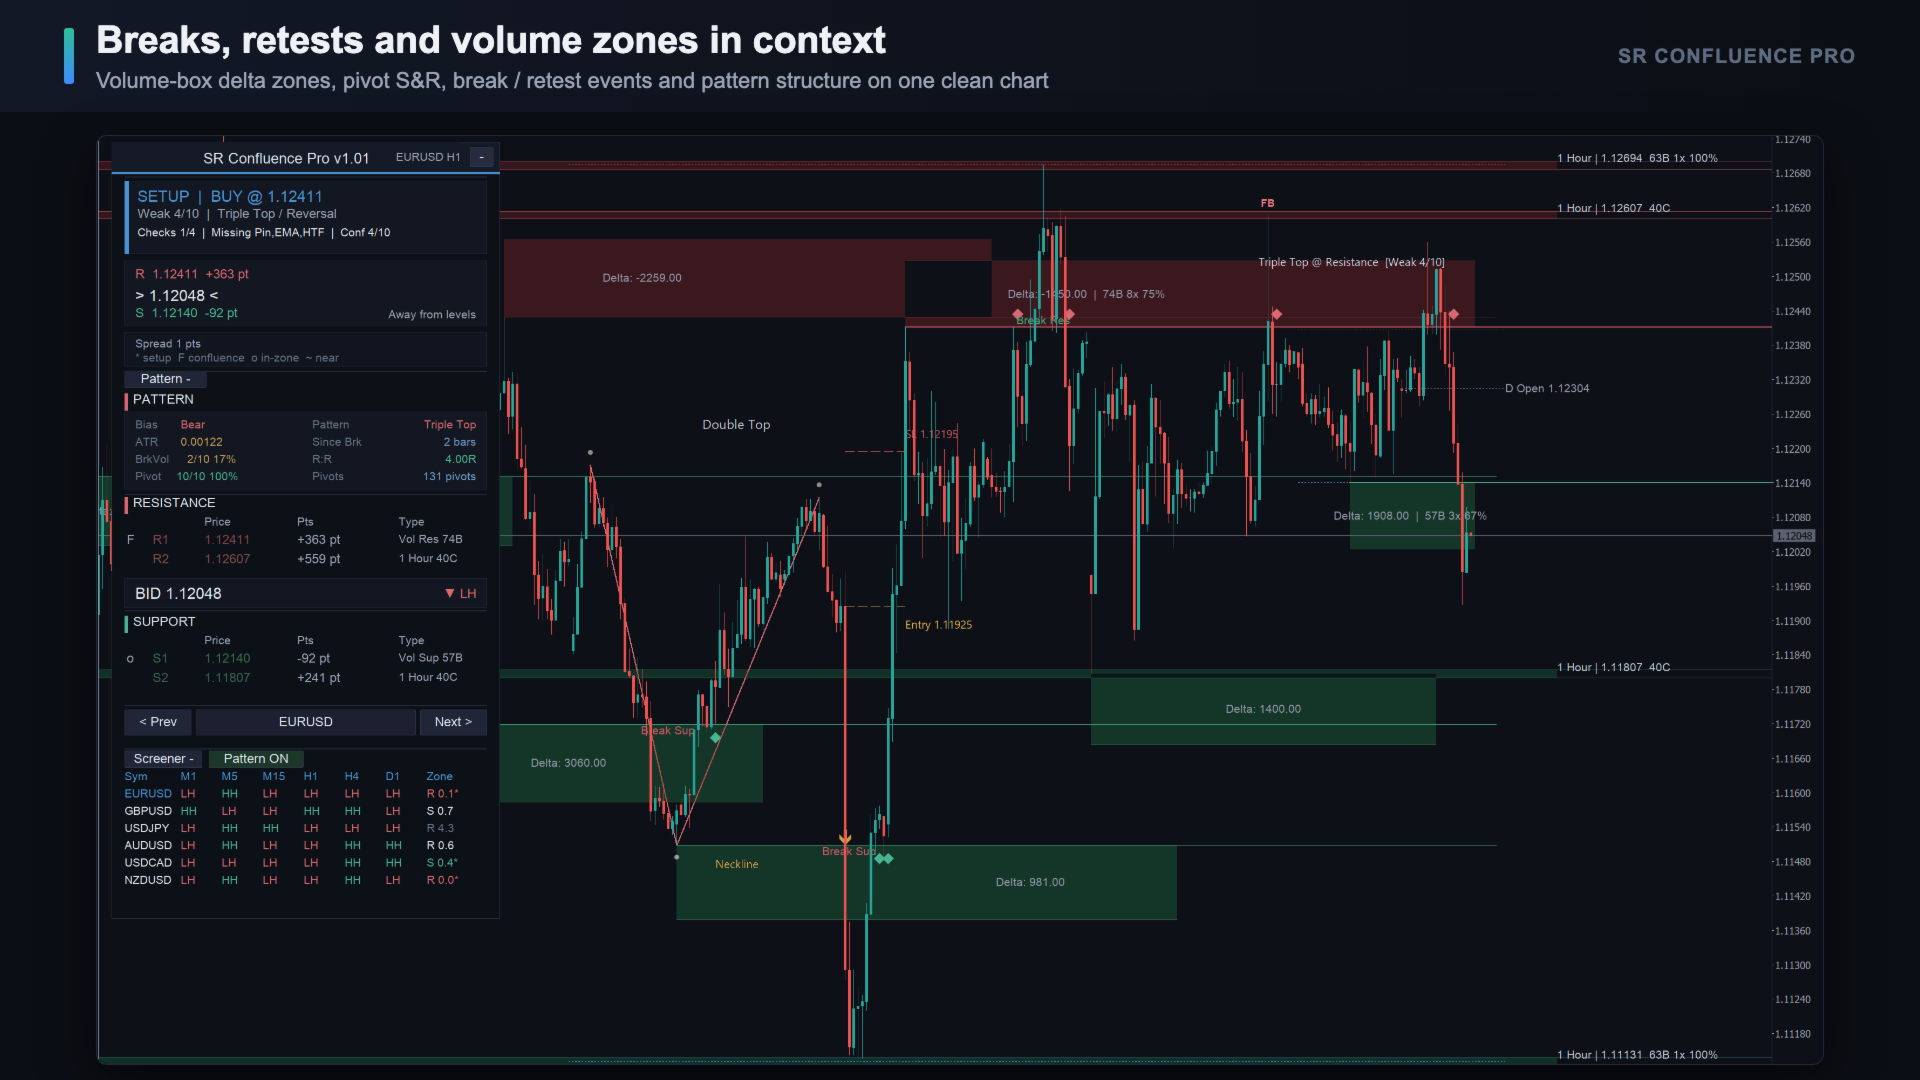
  • High-volume box support & resistance (Volume Box)
  • Multi-timeframe pivot S&R (MTF Pivot)
  • Zone or line display modes
  • Break (B) and retest (R) labels
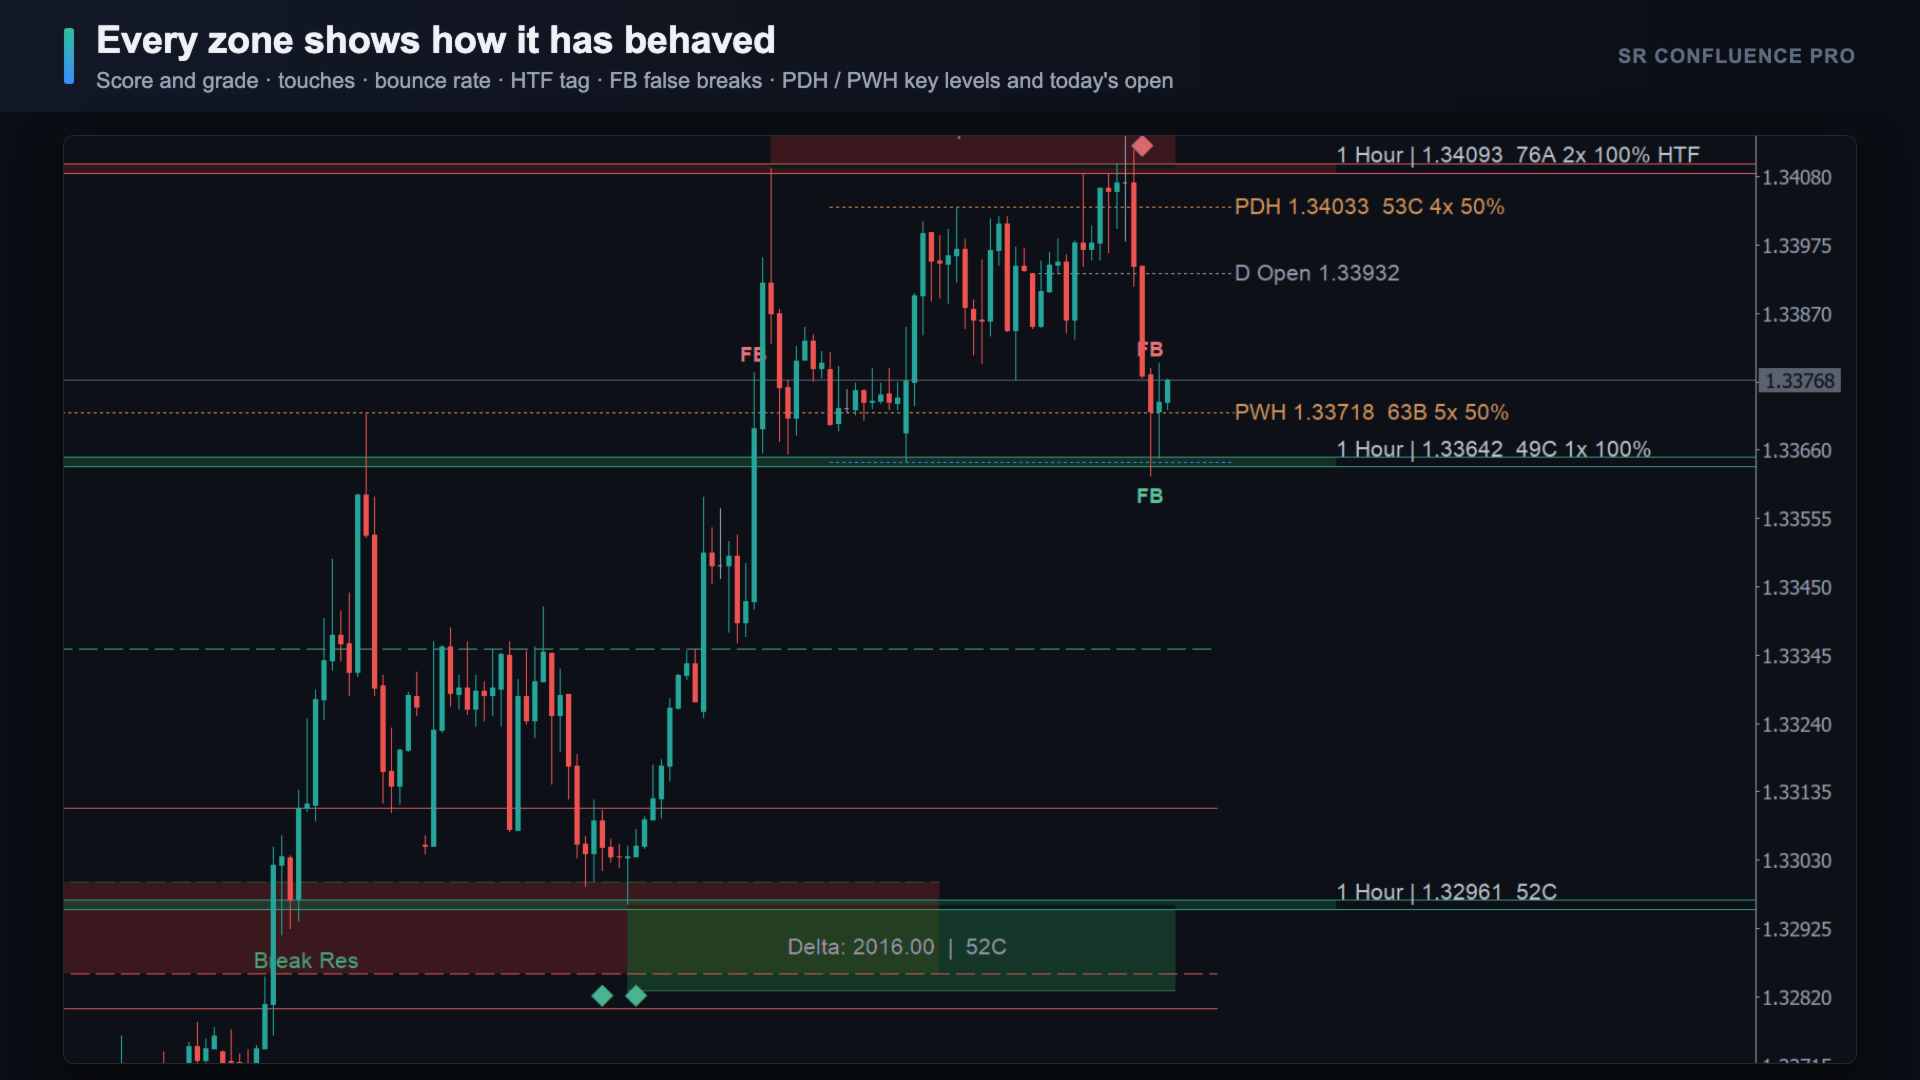
  • Strength score 0–100 with touches and bounce rate on every zone
  • False-break (FB) markers and PDH / PDL / PWH / PWL key levels

Patterns & Confluence

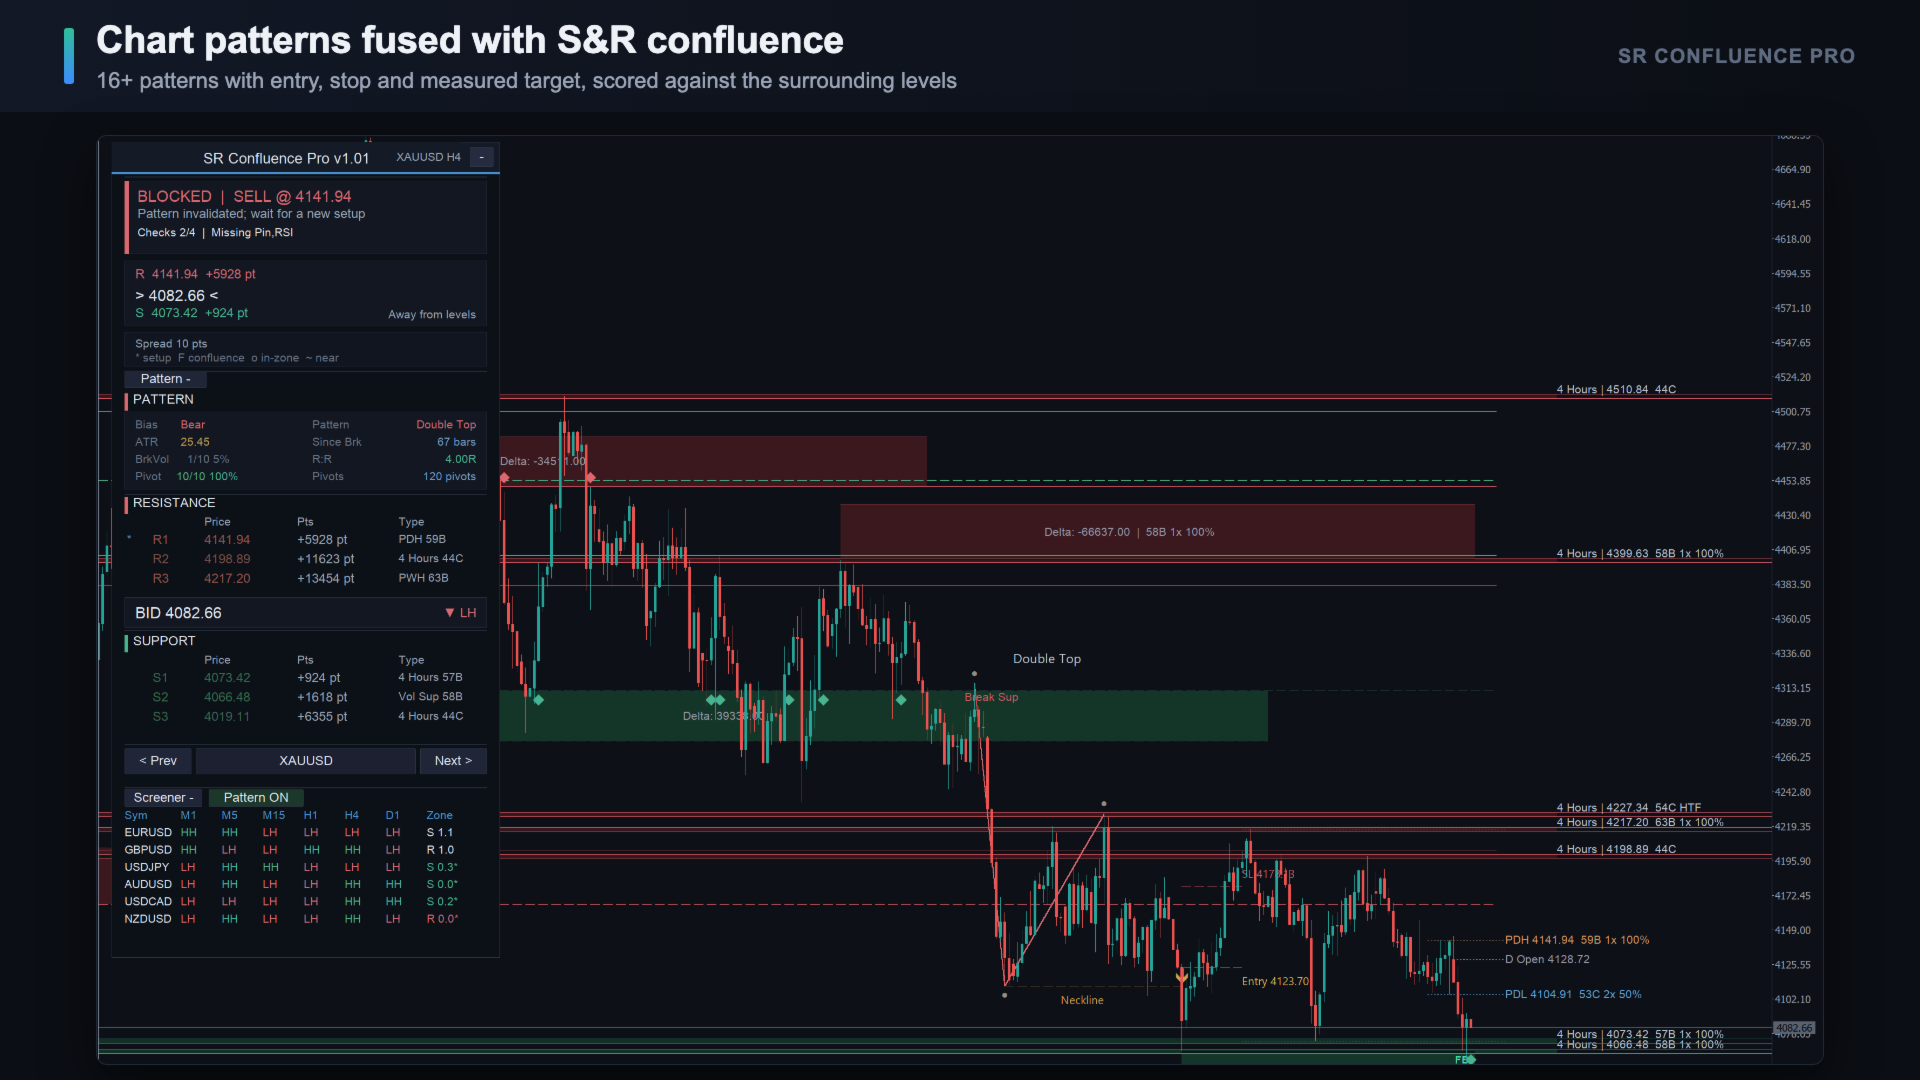
  • 16+ chart patterns detected automatically
  • Entry, stop, and target lines drawn on chart
  • Confluence score from 0 to 10
  • Levels / Patterns / Fusion analysis modes

Features

Volume Box S&R Engine

  • Identifies high-volume price zones using delta volume filtering
  • ATR-adaptive box width with dynamic support/resistance zones
  • Zone invalidation, breakout coloring, and event markers
  • Configurable lookback period, volume filter length, and box width multiplier

MTF Pivot S&R Engine

  • Builds S&R structure from pivot highs and lows
  • Up to three timeframe slots (e.g. current chart, D1, W1)
  • Strength grading (levels 1–3) and wick or close invalidation modes
  • Break labels B and retest labels R
  • Optional volume filter to reduce false breaks
  • Lines or zones display style with fully customizable colors

Level Strength Analytics

Every active support and resistance zone is replayed against the closed bars of the chart since it formed:

  • Touches — separate visits of price to the zone
  • Bounces — touches followed by a move of at least the bounce distance (ATR) away from the zone
  • Breaks — touches that closed through the zone
  • False breaks — wicks that pierced the zone and closed back on the original side (liquidity sweeps)
  • Bounce rate — bounces as a percentage of resolved touches
  • Higher-timeframe confluence — the zone sits on a higher-timeframe level or a key period level
  • All factors, plus timeframe, pivot strength, zone source and freshness, form a 0–100 strength score with grade A (75+), B (55+) or C
  • The score is shown on the zone label (e.g. H4 | 2350.10 82A 4x 75%), in the panel ladder and in the tooltips
  • False breaks are marked FB on the chart and can trigger an alert
  • An optional minimum score filters entry signals that come from weak zones

Key Levels

  • Previous day high / low (PDH / PDL), previous week high / low (PWH / PWL) and previous month high / low (PMH / PML)
  • Today's open line
  • Only periods above the chart timeframe are drawn; each line starts where its period began and carries its strength score
  • Key levels take part in the panel ladder, level touch / break alerts, higher-timeframe confluence and the confluence engine

Pattern Detector

The indicator scans and draws the following patterns (each can be enabled or disabled individually):

ReversalContinuationConsolidation
Double top / double bottom
Triple top / triple bottom
Head & shoulders / inverse H&S
Bull flag / bear flag
Bull pennant / bear pennant
Cup & handle / inverse cup
Rising wedge / falling wedge
Triangles
Rectangles
  • ATR and percentage breakout thresholds with configurable confirmation bars
  • Automatic entry, stop, and measured target lines
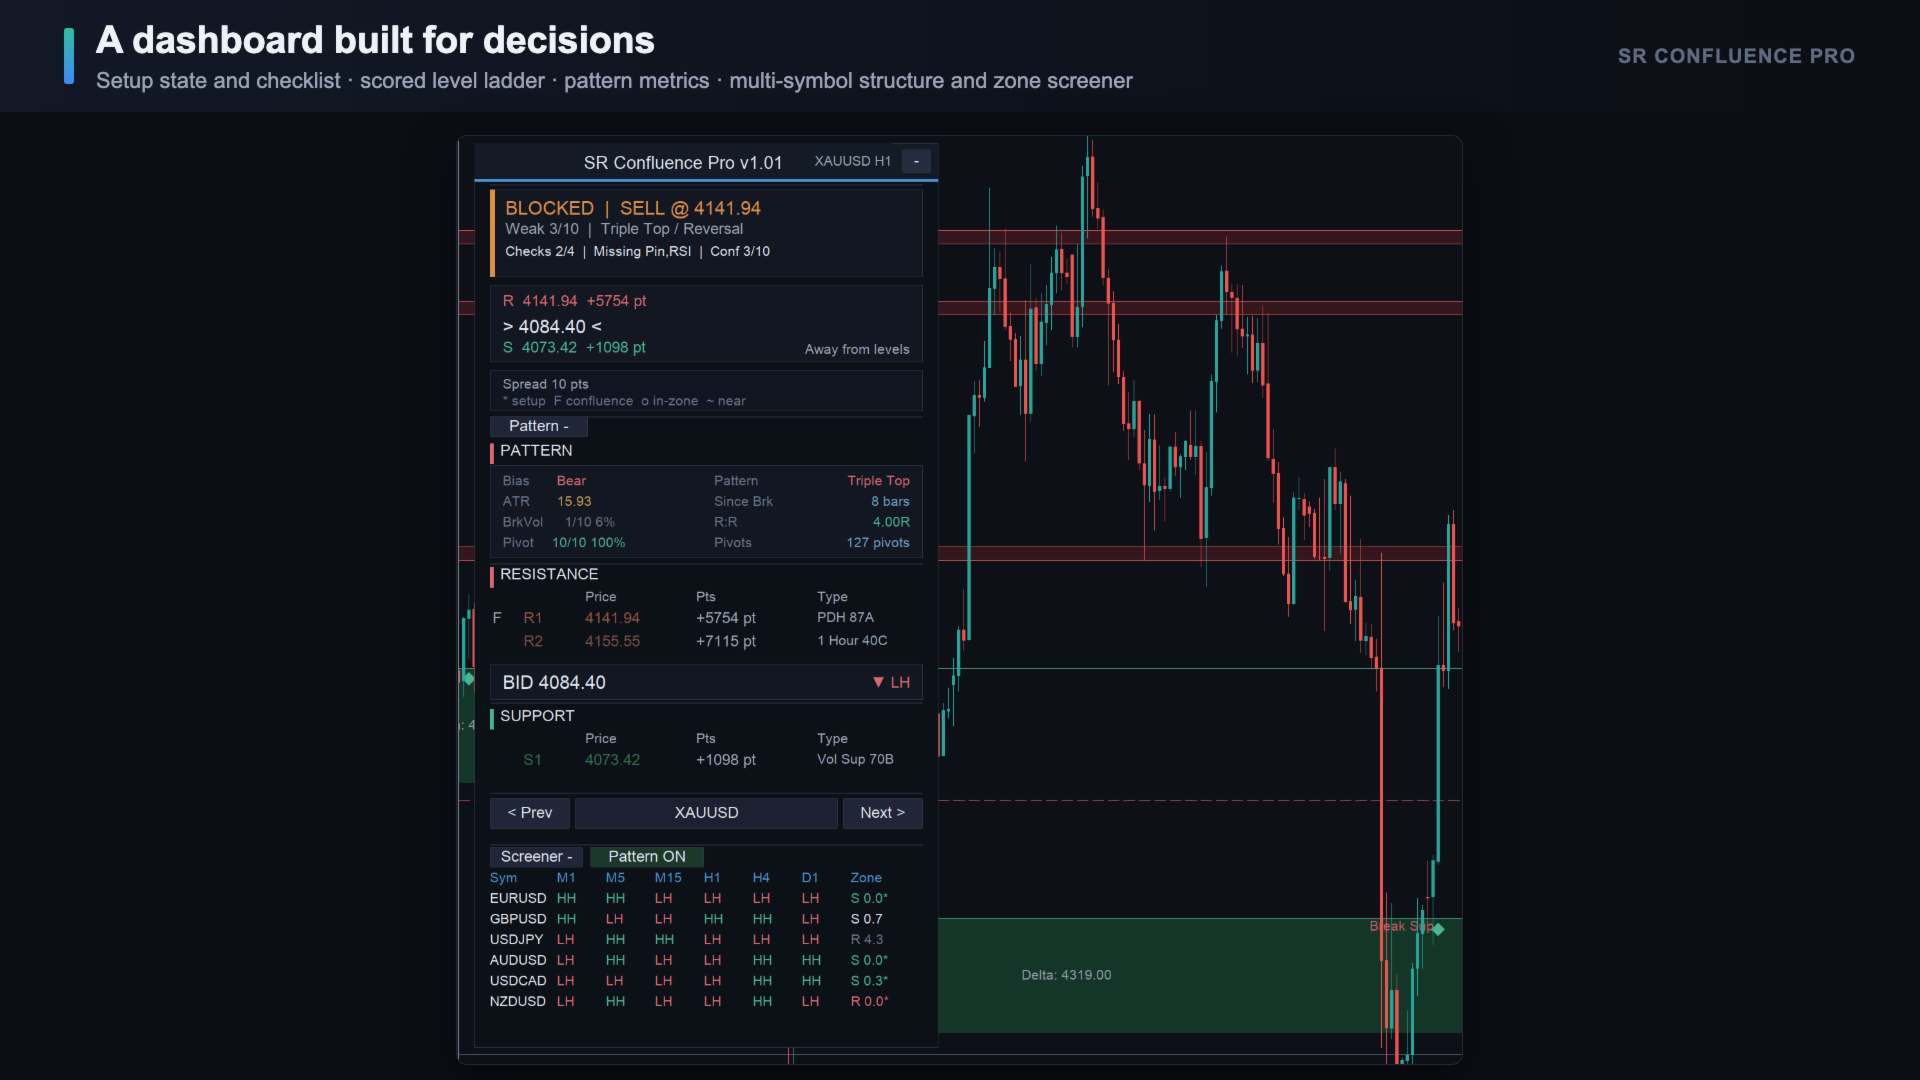
  • Pattern metrics in the dashboard (bias, ATR, breakout age, breakout volume, risk:reward, and pivot quality)
  • Cooldown period to avoid repeated labels in the same area

Confluence Engine

  • Scores spatial overlap between S&R levels and chart patterns (0–10)
  • Grades: Strong (≥7), Moderate (≥5), Weak (≥3)
  • Three analysis modes:
    • Levels — S&R levels only
    • Patterns — chart patterns only
    • Fusion — S&R + pattern confluence (recommended)
  • On-chart confluence labels when pattern and S&R overlap

Dashboard & Tools

  • Draggable panel — live price position, trend state, S&R ladder with strength scores, and signal checklist
  • Multi-symbol screener — Higher High / Lower Low structure on M1–D1 plus a Zone column with the distance (in ATR) to the nearest swing support or resistance; click a symbol to open it
  • Symbol navigator — switch symbols from within the panel
  • Cross-chart sync — sync view and settings across chart windows
  • Adaptive colors — adjusts to dark or light chart themes
  • Foreground panel — chart lines, zones, and patterns remain behind the dashboard
  • Automatic object recovery — restores expected S&R objects after timeframe or chart changes
  • Clean Visual preset — reduces chart noise and can hide overlapping Volume Box objects when MTF levels are available
  • Hotkeys — H hides / shows all drawings, P collapses / expands the panel, K toggles key levels
  • DPI-aware layout — the panel keeps its proportions on high-resolution screens and with Windows display scaling
  • Lightweight rendering — the panel only rewrites objects that changed, so the chart stays responsive on every tick

EA Buffers & Data Window

Eight buffers can be read with iCustom / CopyBuffer and are shown in the Data Window:

BufferValue
0 / 1Nearest support price / its strength score
2 / 3Nearest resistance price / its strength score
4Trade-ready signal: 1 buy, −1 sell (on the signal bar)
5 / 6 / 7Signal entry / stop loss / take profit

Level values are written to the live bar as they are known at that time; empty values are EMPTY_VALUE.

Signal Preview

  • Panel shows setup readiness with confirmation filters (pin bar, EMA, HTF trend, RSI)
  • Buy/sell arrows on chart when a tradeable confluence setup passes the configured quality filters
  • Suggested entry, stop, and target levels for visual reference only — no orders are placed

Alerts

All alert types share the master switch Enable all alerts and can deliver popup, sound, email, and push notifications. Alerts are state-aware: the indicator establishes a silent baseline when it is attached, rebuilt, or moved to another timeframe, then notifies only when a new event or state transition occurs.

Alert typeWhen it fires
Pattern detectedA new confirmed chart pattern is recognized (e.g. Double Top with entry / SL / TP levels)
Pattern breakoutA freshly confirmed pattern with a recent neckline / boundary breakout (within the last few bars)
Confluence setupActive S&R + pattern overlap with score ≥ Min confluence score (tradeable and watch-only setups)
Trade-ready signalA tradeable confluence setup passes the signal-quality filters and produces a valid entry / SL / TP plan
Level touchPrice transitions from away to near / inside an S&R zone
Level breakPrice transitions through a support or resistance zone boundary
False breakThe closed candle wicked through a zone and closed back on the original side (bullish rejection at support, bearish at resistance)
  • Pattern alerts fire when a new pattern is added (not on every bar while the same pattern remains visible)
  • Pattern detected and pattern breakout alerts are independent; when both are enabled, both relevant events can be delivered
  • Confluence alerts include grade and score; non-tradeable setups are marked (watch) and the same unchanged setup is not repeatedly sent
  • Trade-ready alerts are independent of chart arrows; disabling arrow drawing does not disable the alert
  • Level touch/break alerts are transition-based, so price remaining near or beyond a level does not generate repeated alerts
  • With Alert once per new bar only, the previous closed candle's high/low detects touches and its close confirms breaks
  • With new-bar-only mode disabled, level transitions are evaluated live using the chart's Bid price
  • Attaching the indicator, changing timeframe, or re-enabling the pattern detector does not backfill historical alerts
  • Custom alert sound file (place .wav in MQL5\Sounds\)

Quick Start

Recommended setup

  1. Enable Volume Box S&R and MTF Pivot S&R
  2. Enable Pattern Detector and Show pattern metrics in panel
  3. Set Analysis mode to Fusion and watch confluence scores on chart
  4. Open the info panel to view the S&R ladder and HH-LL screener
  5. Enable Enable all alerts and turn on pattern, breakout, confluence, trade-ready, and/or level alerts as needed

Panel controls

  • Drag the title bar to move the panel (position can be remembered)
  • Use the collapse button to save screen space
  • Collapse or expand the screener and pattern-metrics sections independently
  • Use Pattern ON/OFF to enable or pause pattern and confluence analysis from the panel
  • Use the symbol navigator to jump between symbols in your watch list, or click a symbol in the screener
  • Hotkeys: H drawings, P panel, K key levels

Reading the chart

  • Green zones/lines — support
  • Red zones/lines — resistance
  • B — horizontal break
  • R — retest after break
  • FB — false break: wick through the zone, close back on the original side
  • 82A 4x 75% on a zone label — strength score and grade, touches, bounce rate
  • Dotted PDH / PDL / PWH / PWL lines — previous period highs and lows
  • Pattern box with entry/stop/target lines — confirmed pattern structure
  • Confluence label — S&R and pattern overlap in the same zone, with score
  • Row markers in the panel: * active setup, F fusion anchor, o inside zone, ~ near zone

Key Parameters

Volume Box S&R

ParameterDescription
Lookback PeriodNumber of bars used to build volume boxes
Delta Volume Filter LengthSmoothing length for delta volume
Adjust Box Width (ATR mult)Box width = ATR × multiplier

MTF Pivot S&R

ParameterDescription
Pivot LengthLeft/right bar count for pivot detection
Min strength to displayMinimum level strength shown (1–3)
Invalidation modeWick pierce or close pierce
MTF slot 1/2/3Three independent timeframe slots
StyleLines or zones

Pattern Detector

ParameterDescription
Symmetry tolerance (%)Allowed asymmetry in pattern shape
Level tolerance (%)Alignment tolerance for key levels
Breakout threshold (ATR)ATR multiple required to confirm breakout
Min risk:rewardMinimum R:R to accept a pattern
Max patterns displayedMaximum patterns shown on chart at once

Confluence

ParameterDescription
Analysis modeLevels, Patterns, or Fusion
Min confluence scoreMinimum score (0–10) for chart label and confluence alert
Zone overlap tolerance (ATR)How close S&R and pattern zones must be to overlap
Show confluence chart labelDisplay pattern @ S&R label on the chart
Alert on confluence setupNotify when confluence score reaches the minimum
Alert when pattern is detectedNotify when a new confirmed pattern appears
Alert on fresh pattern breakoutNotify when a new breakout event is confirmed; it can fire alongside the generic pattern alert
Fusion: pattern required for reversalsReversal setups need a matching pattern

Signal Preview

ParameterDescription
Min confirmation scoreMinimum filter score (pin bar, EMA, HTF, RSI) out of 4
Signal proximity to level (ATR)How close price must be to a level for a signal
Require pin-bar rejectionRequire a pin bar on the signal bar
SL buffer beyond zone (ATR)Stop distance below/above the S&R zone
TP target (R multiple)Take-profit distance as a multiple of stop distance

Display & Alerts

ParameterDescription
Draw S/R zones on chartShow S&R zones on the chart
Draw buy/sell entry arrowsShow signal arrows for tradeable confluence setups that pass filters
Show info panelDisplay the dashboard panel
HH-LL screener in panelMulti-symbol structure screener in panel
Enable all alertsMaster switch for every alert type and delivery channel
Popup / Sound / Email / PushDelivery channels; sound uses the file in MQL5 Sounds folder
Alert on level touchNotify when price transitions into the proximity or body of an S&R zone
Alert on level breakNotify when price transitions beyond an S&R zone boundary
Alert once per new bar onlyEvaluate level alerts once per new bar using the previous candle high/low for touches and close for breaks
Alert when a trade-ready signal appearsNotify when confluence and signal-quality filters produce a valid trade-ready entry / SL / TP plan

Clean Visual Preset

ParameterDescription
Cleaner visual presetKeep the dual S&R engines visible while reducing secondary chart annotations
Clean mode MTF min strengthRaise the minimum MTF pivot strength shown while Clean Visual mode is active
Hide volume-box objects when MTF levels are visibleDisplay MTF S&R only when both engines would otherwise overlap on the chart

Clean Visual mode suppresses MTF break/retest labels to prioritize the most important zones and price structure.

Level Strength Analytics

ParameterDescription
Analyse touches, bounces & breaks per levelTurns the statistics, strength score and false-break detection on or off
Show strength score on level labelsAdds score, touches and bounce rate to the zone labels
Bars analysed per levelHow much chart history is replayed for each zone
Bounce distance that counts as a hold (ATR)Move away from the zone required to count a touch as a bounce
Min level score for entry signalsSignals from zones below this score are skipped (0 = off)
Mark false breaks (FB) on chartShow false-break markers on recent bars
Alert on a new false breakNotify when the closed candle forms a false break

Key Levels

ParameterDescription
Previous day / week / month high & lowMaster switch and one switch per period
Today's open lineDraw the current day's open
Key high / low / open colorsLine and label colors

Hotkeys

ParameterDescription
Hotkeys: H drawings, P panel, K key levelsEnable keyboard shortcuts on the chart

Usage Tips

  • Timeframes: H1 and H4 work well for swings; M15 and M30 for intraday. Use higher-timeframe S&R (D1/W1) for bias and lower timeframes for entries.
  • Dual engines: Volume Box captures volume clusters; MTF Pivot captures structural pivots. Run both and let the confluence engine rank overlapping zones.
  • Confluence score: Scores of 5+ are worth watching; 7+ indicate high-confidence overlap. Enable pattern and confluence alerts so you are notified even when you are not watching the chart.
  • Pattern alerts: Pattern detection and breakout are separate events. Reloading, changing timeframe, or re-enabling the pattern detector establishes a silent baseline and does not re-alert an already visible historical pattern.
  • Level alerts: New-bar-only mode is recommended for cleaner, close-confirmed alerts. Disable it when live intrabar touch and break transitions are preferred.
  • Strength score: Grade A zones (75+) with several bounces and a high bounce rate are the most reliable reaction areas; a high false-break count marks zones where liquidity is regularly swept before price reverses.
  • Key levels: A volume or pivot zone that sits on PDH / PDL or PWH / PWL is flagged as higher-timeframe confluence and scores higher.
  • Tuning: Volatile symbols may need wider ATR-based settings (box width, breakout threshold, stop buffer).
  • Multiple charts: Enable cross-chart sync to control view mode and screener list across all open instances.

FAQ

Why are no patterns showing on the chart?

Check that Enable pattern detector is on. The current bar may not meet minimum pattern size (ATR or percentage), or the pattern may not yet be confirmed. Enable Show unconfirmed patterns temporarily to diagnose.

S&R levels look too crowded — what can I do?

Increase Min strength to display on MTF Pivot, widen the Volume Box Box Width, enable Cleaner visual preset, or hide Volume Box objects when MTF levels are visible.

What does the strength score mean?

It summarises how the zone has behaved since it formed: timeframe and pivot strength, how many times price touched it and bounced, how often it broke, false breaks, higher-timeframe confluence and freshness. Hover a zone label or a ladder row to see every factor. Scores are recalculated on each new bar.

Alerts are not firing

Check the following:

  • Enable all alerts is on
  • The specific alert type is enabled (pattern detected, pattern breakout, confluence, trade-ready, level touch, level break, or false break)
  • Pattern: Enable pattern detector must be on; patterns require breakout confirmation before they alert
  • Confluence: active score must be ≥ Min confluence score; use Fusion or Patterns mode (not Levels-only)
  • Trade-ready: the confluence setup must be tradeable and pass the configured pin-bar, EMA, HTF, RSI, score, and risk filters
  • Levels: if Alert once per new bar only is on, the previous closed candle is evaluated when a new bar begins
  • Email/push: configure Tools → Options → Notifications in MT5

I see a pattern on chart but got no pattern alert

Pattern alerts fire only for a new detection or breakout event. If the pattern was already present when the indicator was attached, rebuilt, or moved to another timeframe, it is intentionally treated as the current baseline and no historical alert is sent. Wait for the next new setup or breakout. The same unchanged pattern will not alert repeatedly while it remains active.

Why did a candle touch or cross a level without an alert?

With Alert once per new bar only enabled, level events are evaluated when the next bar begins. A wick can trigger a touch, but a break requires the previous candle to close beyond the zone. The indicator also alerts on state transitions only, so it will not repeatedly notify while price remains near or beyond the same level.

Does this indicator place trades?

No. SR Confluence Pro is analysis-only. It draws levels, patterns, and signal previews on the chart. All trading decisions and order execution remain entirely with you.

Disclaimer

This product is provided for technical analysis and educational purposes only. It does not constitute investment advice or a guarantee of future results. Financial markets involve risk. Past pattern or level performance does not predict future outcomes. The developer is not liable for any direct or indirect loss arising from use of this indicator.
추천 제품
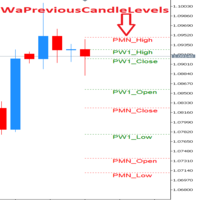
Previous Candle Levels MT5
Wachinou Lionnel Pyrrhus Sovi Guidi
1 (1)
Previous Candle Levels MT5 shows the previous candle levels, it shows the previous candle Open High Low Close levels (OHLC Levels) in different time frame. It's designed to help the trader to analyse the market and pay attention to the previous candle levels in different time frame.  We all know that the OHLC Levels in Monthly, Weekly and Daily are really strong and must of the time, the price strongly reacts at those levels. In the technical analysis, the user can use them as a support and res
FREE
아시아 레인지는 누구나 그립니다. Session Liquidity Sweep Stats는 그 레벨에 보통 무슨 일이 일어나는지 를 알려줍니다. 각 세션의 고점과 저점은 세션이 끝나는 순간부터 추적되며, 모든 접촉은 직접 고정한 판정 시간대에서 세 가지 답 중 하나로 결론이 납니다. 레벨이 스윕(swept) 되어 가격이 반전했는가, 돌파(broken) 되어 가격이 계속 갔는가, 아니면 닿기만 하고 그날 안에 아무것도 정해지지 않았는가. 동작 아시아 세션이 마감되면 그 고점과 저점이 차트에 그려집니다. 런던이 마감되면 런던의 고저가 추가됩니다. 이후 각 레벨을 봉 단위로 감시하며, 가격이 닿는 순간 질문이 열립니다. 버틸 것인가, 뚫릴 것인가. 닿은 봉에서 두 개의 기준을 잡고 서로 경쟁시킵니다. 그 봉의 꼬리 끝 을 종가로 넘으면 돌파 — 움직임이 이어진 것입니다. 닿기 직전 마지막 반대 봉의 시가 를 종가로 되돌리면 스윕 — 유동성이 취해지고 가격이 반전한 것입니다. 먼저 결론난 쪽
AccountStatsPanel
Nguyen Nam Tuan
# Account Stats Panel — Professional Trading Statistics for MetaTrader 5 A complete, canvas-rendered statistics dashboard for your trading account. Track your real risk day by day: maximum equity drawdown (eDD), drawdown %, traded volume and closed profit — organized into daily and monthly tables, plus a smooth interactive profit chart. All data is measured tick-by-tick in real time and saved locally, so your statistics survive terminal restarts. ## KEY FEATURES **Live Account Info** - Leverage
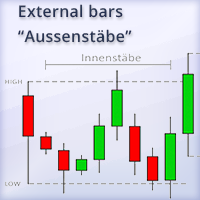
Aussenstab Markttechnik
Alexander Josef Zeidler
This indicator shows external bars ("Aussenstäbe") in the chart in candle form. The colors of the candles can be set individually. Also different colors for bearish and bullish bars are possible. In addition, the color of the wicks or outlines is also adjustable. Outside bars are mentioned e.g. by Michael Voigt in the book "Das große Buch der Markttechnik". All other candles are inner bars.
BW Indicators
Sergei Gurov
A tool for creating Bill Williams indicators Our tool provides the ability to set Bill Williams indicators on a chart with a mouse click. - The Awesome Oscillator (AO) indicator helps to assess the driving force of the trend. - Alligator indicator — determines the current state of the trend and possible entry and exit points. - Fractals indicator — helps to identify significant levels  - Accelerator Oscillator (AC) indicator — shows the change in trend acceleration. - Market Facilitation Index
FREE
CandleTimer Countdown MT5
Robby Suhendrawan
4 (1)
Candle Timer Countdown (CTC) – 미니멀하고 정밀한 캔들 타이머 Candle Timer Countdown(CTC)은 차트에서 현재 캔들의 남은 시간을 표시하는 가볍고 방해되지 않는 MetaTrader 지표입니다. 단순함과 명확성을 염두에 두고 설계된 이 도구는 트레이더가 차트를 복잡하게 만들지 않고 캔들 마감을 파악할 수 있도록 도와줍니다. 주요 특징: 실시간 캔들 카운트다운: 현재 캔들이 마감되기까지 몇 초가 남았는지 항상 확인하세요. 모든 시간대에서 작동합니다. 미니멀한 디스플레이: 타이머가 차트에 깔끔하게 배치되며 사용자 지정 가능한 글꼴, 색상 및 위치를 사용합니다. 완전한 사용자 지정 가능: 글꼴 유형(예: Arial) 글꼴 크기 글꼴 색상 X 및 Y 오프셋(화면 위치 조정용) 깔끔한 통합: 다른 도구이나 EA를 방해하지 않고 부드럽게 실행됩니다. 쉬운 설정을 위한 간단한 입력: 매개변수 설명 Text Color 선호하는 타이머 색상 선택 Font Na
FREE
Summary (What Changed & Why It Matters) Traditional FVG indicators suffer from three structural flaws : Detection and mitigation are coupled Wicks and bodies are treated identically Partial mitigation is not preserved This indicator introduces a new FVG model where: Detection ≠ Mitigation Wick interaction ≠ Body acceptance FVGs decay progressively , not instantly This transforms FVGs from a static drawing tool into a dynamic price-acceptance model .
UTS Prime Zones
Dawid Aaron Zinserling
️ UTS Prime Zones  — The Ultimate Multi-Timeframe Support & Resistance Engine UTS Prime Zones  is an advanced, institutional-grade indicator that automatically maps out the most critical Support and Resistance zones across two different timeframes simultaneously . Stop drawing lines by hand. Stop guessing where the market will reverse. UTS Prime Zones uses a sophisticated fractal and ATR-based algorithm to identify high-probability "zones" (areas, not just single lines) where price is highly l
Unlock powerful insights into market direction with this Volume Weighted Moving Average (VWMA) indicator for MetaTrader 5. Key Features: Multi-Timeframe VWMA Analysis: Quickly see if the price is above or below the Volume Weighted Moving Average on M5, M10, M15, M30, H1, and D1 timeframes , all in a single glance. Real-Time Cross Alerts: Receive instant visual arrows and customizable sound notifications when price crosses above or below your chosen VWMA period. Precision Retest Detectio
This indicator detects IDRN4 and IDNR7 two powerful patterns on 28 pairs on new daily bar. IDNR4 is the acronym for "Inside Day Narrow Range 4" where "Inside Day" is a lower high and higher low than the previous bar and "Narrow Range 4" is a bar with the narrowest range out of the last 4 bars so "Narrow Range 7" out of the last 7 bars. Hence, ID/NR4 and better ID/NR7 are an objective criterion for identifying days of decreased range and volatility. Once we find an ID/NR4 or an ID/NR7 pattern, we
MQL5 블로그 = https://www.mql5.com/en/blogs/post/775942 MT4 버전 = https://www.mql5.com/en/market/product/196315 MT5 버전 = https://www.mql5.com/en/market/product/196316 'Reversal Probability(반전 확률)'는 과거의 시장 반전 지점(피벗)이 집중된 가격대를 식별하기 위해 설계된 고급 시장 분석 지표입니다. 이 지표는 단일 지지선이나 저항선에 의존하는 대신, 확정된 시장 피벗을 기반으로 동적인 반전 확률을 산출하고 이를 유의미한 가격대로 구성합니다. 이를 통해 트레이더는 과거에 반전 움직임이 집중되었던 구간과 현재 가격이 해당 구간 대비 어디에 위치해 있는지 파악할 수 있습니다. 이 지표는 피벗 분석, 가격 밀도 프로파일링, 동적 지지 및 저항, 클러스터 시각화, 그리고 전문가급 다중 심볼 대시보드를 하나의 트레이딩 작업 공간에 통합하여 제공
Elektra Power Law
AMMIRELLA GROUP (PTY) LTD
Elektra Power Law draws a trendline where you ask for one, and fits it to the whole population of swing points inside your selection instead of to the two points under your cursor.   You hold CTRL and drag across the stretch of chart you want measured. The indicator finds every swing pivot in that range and fits a line through them using a repeated median of the slopes between all pairs of pivots. A single unusual bar therefore moves the line very little, which is the difference between this and

Moonshine Pivot Trend is a trend indicator for MT4 and MT5 whose trailing stop sits still for days at a time. On gold H1 it produced 153 signals in four and a half years, about 33 a year. If that sounds low, that's the argument I want to make before you look at a screenshot and decide something is broken. Most ATR trend tools centre their band on the current candle, so every new bar moves the anchor and a quiet stretch nudges you out of a trend that never broke. This one anchors to confirmed swi

Session Highlighter and Killzones draws clean colored boxes for the Asia, London and New York trading sessions, plus optional London and New York killzone windows. Time of day is a large part of context in forex, and seeing each session range on the chart explains a lot of what price is doing. Each session box marks the high and the low of that session for the last several days, and the boxes sit behind the candles so the chart stays readable. The session hours are set in server time and are ful
FREE
Oracle Harmonic Patterns 는 모든 타임프레임에서 가틀리 하모닉 패턴 전체를 자동으로 감지하며, 내장된 품질 필터를 통해 단순히 “비슷해 보이는” 패턴이 아닌 실제 컨플루언스(다중 확인) 로 검증된 셋업만 표시합니다. 하모닉 패턴을 수동으로 찾는 것은 매우 시간이 많이 걸리는 작업입니다. 5개의 반전 포인트, 정확한 피보나치 비율, 그리고 여러 독립적인 신호가 같은 지점에서 수렴할 때 비로소 의미를 가지는 잠재적 반전 구역(PRZ) . 이 인디케이터는 모든 측정을 자동으로 수행하며, 패턴이 엄격한 검증을 통과했을 때만 신호를 생성합니다. 감지 가능한 패턴 Gartley (가틀리) — 클래식 반전 패턴 Bat (박쥐) — B 포인트가 작고, D 포인트가 깊으며, 스탑이 컴팩트함 Butterfly (나비) — 시작점을 넘어서는 확장으로, 극단에서의 반전에 적합 Crab (게) — 가장 정확한 패턴 중 하나로, 극단적인 피보나치 확장을 가짐 Shark (상어) — 현대적
Session Indicator — Forex Trading Sessions Visualizer Overview Session Indicator   is a professional MT5 indicator that displays the four major forex trading sessions (Sydney, Tokyo, London, New York) as colored horizontal bands on your chart. Never miss a trading session again! Free Product   |   Works on Any Broker   |   Auto-Detects Timezone Features Auto-Detects Broker GMT Offset Works automatically on any MT5 broker (XM, IC Markets, FXCM, etc.) No manual timezone configuration needed Label
FREE
Simple Candle Timer
Mativenga Geoffrey Mativenga
Simple Candle Timer Overview: The Simple Candle Timer is a simple, yet powerful, tool for traders who want to stay informed about the time remaining until the next candle appears on their chart. Whether you are trading on minute charts or higher timeframes, this indicator ensures you never miss a new candle formation. Features: Real-Time Countdown Timer: Displays the time left until the current candle closes and a new one starts. The timer updates smoothly every 100 milliseconds for precision
Pin Bars MT5
Yury Emeliyanov
Main purpose:   "Pin Bars"   is designed to automatically detect pin bars on financial market charts. A pin bar is a candle with a characteristic body and a long tail, which can signal a trend reversal or correction. How it works:   The indicator analyzes each candle on the chart, determining the size of the body, tail and nose of the candle. When a pin bar corresponding to predefined parameters is detected, the indicator marks it on the chart with an up or down arrow, depending on the directi
FREE
Mimosa
Kun Jiao
MimosaGold(미모사) — MetaTrader 5용 금 자동매매 프로그램 Tulip FinTech · 버전 1.0 개요 MimosaGold는 금만을 대상으로 하는 MetaTrader 5용 자동매매 시스템입니다. 단일 전략이 아니라 10개의 독립적인 "레그(leg)"를 동시에 운용합니다. 각 레그는 고유한 시간 프레임, 고유한 진입 필터, 고유한 손절과 이익실현 단계, 고유한 시간 청산, 고유한 매직 넘버와 주문 코멘트를 가집니다. 각 레그가 동시에 보유하는 포지션은 최대 1개입니다. 전체 시스템은 단일 EX5 파일입니다. EMA, ATR, RSI, ADX, 볼린저, 돈치안, VWAP, 세션 범위, 일봉 파생 시리즈 등 모든 지표가 EA 내부에 구현되어 있습니다. 외부 DLL, 외부 지표 파일, 서드파티 라이브러리가 전혀 필요하지 않습니다. 모든 신호는 인과적이며 리페인트되지 않습니다. 현재 봉의 신호는 확정된 봉만으로 계산하고, 판단 시점 오른쪽의 데이터는 절대 사용하지 않습니
Range Predictor MT5
Suvashish Halder
Introducing the   Range Predictor : Your Ultimate Guide to Future Trading Ranges!   Imagine having the power to see into the future of market moves— Range Predictor   brings this dream to life. Designed to deliver real-time,   predictive support and resistance levels , this tool goes beyond standard indicators, offering trend direction insights and precise range   forecasts . Whether you're a day trader or a swing trader, the   Range Predictor   is your all-in-one toolkit for mastering the ma
Market Hours Pro
Musa Terrance Khosa
Market Hours Pro shows Tokyo, London, and New York trading sessions directly on your MT5 chart, including scheduled overlap periods. It’s designed to give you a clear view of global market timing so you can plan trades, spot high-activity periods, and align strategies with standard Forex hours. How It Works Displays scheduled session times visually on your chart. Highlights session overlaps for London/New York and Tokyo/London. Automatically adjusts times for your timezone or broker time. Shows
Session Time Monitor shows the Sydney, Tokyo, London and New York trading sessions directly on your chart. The GMT offset of your trade server is detected automatically, so there is no offset parameter to configure. Each region is handled with its own daylight saving rule: European, United States and Southern Hemisphere schedules all change on different dates, and the display follows each of them independently. The panel shows the server time, GMT, your local time, the detected server offset,
FREE
Aegis XAU Extreme Edition Overview Aegis XAU Extreme Edition is a trend-following Expert Advisor designed exclusively for XAUUSD M1 . Rather than trading throughout the entire day, it focuses only on carefully selected trading sessions identified through extensive historical testing. By avoiding statistically unfavorable hours, the EA aims to improve overall trading efficiency while maintaining consistent long-term performance. The strategy combines: EMA Trend Filter EMA Pullback Entry ADX Tr
Pattern Recognition EA
Claudiu-georgian Zavera
Pattern Recognition EA - From Learn to Earn. The market repeats itself. This EA finds every past repeat of the current candle sequence - and lets history vote the direction. ONE SHAPE. EVERY REPEAT IN HISTORY VOTES. The last N candles on your signal timeframe form a shape. The EA scans the history you choose - a fixed number of bars or everything your broker provides - for the SAME shape, and checks what happened next, every single time. Only when enough repeats exist AND a clear majority of t
If you like this product, please give it a  5 star rating as a token of appreciation. This indicator draws vertical lines marking key Forex trading sessions (Asian, London, New York) for a configurable number of past days. These “Silver Bullet” lines help traders quickly visualize session start and end times on the chart. DaysToDisplay: How many previous days’ session lines to show. Session colors: Customizable line colors for each session. Session start hours: Local server hours for each sessi
FREE
The initial price is 92.25 USD, the future price is 250 USD Universal advisor with the use of economic and fundamental news " Smart News Trade ". Trading tactics are based on tracking the dynamics of the market and accelerating the price movement. Not guessing, not forecasting, only calculations with clear guidelines for the direction of positions. The work is carried out with pending orders, a stop loss is used to protect funds. A VPS server is required for smooth operation. Ease of use: Ther
Prime Vortex Pro (MT5) — Multi-Layer Confluence Trend & Reversal Signal Indicator Built natively for MetaTrader 5. Fewer signals. Stronger confluence. Why Prime Vortex Pro Exists Most signal indicators fire on nearly every candle — dozens of arrows a day, most of them noise that pulls traders into weak, low-probability setups. Prime Vortex Pro flips that approach: silence is the default. A signal only appears when multiple, independent layers of market evidence — trend, trend strength, market st
LevelPAttern MT5 is a technical indicator based on the daily levels and Price Action patterns. The indicator is based on the standard ZigZag indicator + reversal candlestick pattens, such as Star, Hammer (also knows as Pin bar), Engulfing and others. The indicator generates audio and text notifications when a pattern is formed and a level is touched. It also supports sending email and push notifications. Indicator operation features It is suitable for working with any CFD and FOREX trading inst
Awesome Oscillator by Bill Williams with the ability to fine-tune and replace the averaging algorithms of the indicator, which significantly expands the possibilities of using this oscillator in algorithmic trading and brings it closer in its properties to such an indicator as the MACD. To reduce price noise, the final indicator is processed with an additional Smooth averaging. The indicator has the ability to give alerts, send mail messages and push signals when the direction of movement of th
The   ATR indicator   is a helpful tool for measuring the range of bars. It quickly and easily helps evaluate the ATR's current spread (range), which is especially useful for VSA traders. The indicator for classifying the range of bars (candles) uses the moving average and its multiples. Accordingly, the area where the volume is located (relative to the moving average) is labeled as ultra-low, low, average, high, very high, or ultra-high. Our ATR indicator is rendered as a histogram. This indic
이 제품의 구매자들이 또한 구매함
Trend Sniper X
Sarvarbek Abduvoxobov
4.86 (43)
Trend Sniper X 는 트레이더가 추세 방향과 잠재적 반전 지점을 명확하고 정확하게 포착할 수 있도록 도와주는 MetaTrader 5용 멀티 타임프레임 추세 추종 지표입니다. MT4용: https://www.mql5.com/en/market/product/193245 가격 정보: 현재 가격은 프로모션 할인가이며, 향후 업데이트 및 새로운 기능이 출시됨에 따라 변동될 수 있습니다. 보너스 혜택: 본 지표 전용 무료 자동매매 Assistant EA를 받으시려면 구매 후 작성자에게 메시지를 보내주시기 바랍니다. Code2Profit 채널 멀티 타임프레임 분석으로 시장을 마스터하세요! Trend Sniper X로 승률을 극대화하는 방법: 핵심 규칙 및 세션 팁 기술 사양 플랫폼 MetaTrader 5 지표 유형 멀티 타임프레임 추세 지표 운용 타임프레임 모든 차트 타임프레임 지원, 독립적으로 선택 가능한 상위 타임프레임(M1–MN1) 주요 상품 외환, 금(XAUUSD) 및 기타 C
새로운 왕의 등장 - 인디케이터 + 주문 관리 표시(TP1 + TP2 + TP3) + 선택형 텔레그램 시그널 전송 기능 포함 (무료) (완전한 트레이딩 및 시그널 시스템) 골드를 위한 최고의 EA: Gold Slayer 이 인디케이터는 고급 전략, 사용자 지정 가능한 주문 관리 시스템, 그리고 엔벨로프 확장을 결합한 평균 회귀(mean reversion) 시스템을 포함하고 있습니다. 또한 RSI와 같은 여러 지능형 확인 필터를 통해 높은 확률의 반전 진입 구간을 포착하여 BUY 및 SELL 시그널을 제공합니다. 단순히 거래 방법만 배우는 것이 아니라, 여러 포지션을 효과적으로 관리하고 이전에 수익 중인 오픈 포지션으로 손실 거래를 커버하는 방법까지 익힐 수 있습니다. M5 전용으로 설계 및 최적화되었으며, 유동성이 풍부해 시그널이 더 깔끔하고 신뢰도 높은 BTCUSD와 XAUUSD에서 뛰어난 성능을 발휘합니다. 이 인디케이터는 ATR 기반으로 자동 계산된 진입가, 손절가, 익절가와
Smart Trend Trading System — MetaTrader 5 구매 후 MQL5에서 저에게 메시지를 보내시면 Smart Universal Expert Advisor를 무료로 받으실 수 있으며, 온라인 강좌, PDF 매뉴얼 및 비공개 그룹 이용 권한도 함께 제공됩니다. STTS는 추세 방향, 진입·청산 신호, 반전 구간, 주요 가격 수준을 차트에 모아 보여줍니다. 시스템을 참고해 수동으로 거래하거나, 별도의 호환 EA를 연결하여 선택한 설정에 따라 자동으로 거래를 실행할 수 있습니다. 하나의 시스템, 네 가지 트레이딩 접근법 STTS의 트레이딩 접근법은 크게 네 가지로 나뉩니다. • 스캘핑 — 단기 신호와 시장 움직임을 살펴봅니다. • 추세 매매 — 방향을 평가하고 추세 안에서 기회를 찾습니다. • 반전 매매 — 잠재적인 전환 구간과 방향 변화를 파악합니다. • 거래량 매매 — 거래량 기반 정보로 시장 활동을 평가합니다. 진입·청산 화살표, 추세 정보, 지지·저항 수
Zoryk Gold
Reda El Koutbane
4.76 (17)
ZORYK — MetaTrader 5용 XAUUSD 전문 신호 및 트레이드 플래닝 시스템 이런 경험이 있을 것입니다. 골드를 분석하고 진입을 기다린 뒤 마침내 포지션을 열었지만 가격이 곧바로 반대 방향으로 움직입니다. 너무 일찍 청산하거나 Stop Loss를 옮기거나 몇 초 동안 망설입니다. 그 후 시장은 내가 없이도 처음 예상했던 목표까지 정확히 움직입니다. 문제는 항상 방향이 아니었습니다. 진짜 문제는 불확실성이었습니다. 정확한 진입 위치를 몰랐습니다. 어느 지점에서 원래의 트레이드 아이디어가 무효가 되는지 몰랐습니다. 가까운 수익을 확보해야 할지 더 큰 움직임을 기다려야 할지 판단하기 어려웠습니다. 현재 setup이 정말 강한지 아니면 단지 새로운 거래를 억지로 찾고 있는지도 확신하기 어려웠습니다. 골드는 매우 빠르게 움직입니다. 명확한 계획이 없다면 좋은 분석도 몇 초 만에 나쁜 결정으로 바뀔 수 있습니다. ZORYK는 이 문제를 해결하기 위해 개발되었습니다.
M5 Sniper
MeanFX
5 (3)
당신의 트레이딩 우위를 한눈에 확인하세요! M5 Sniper 는 MeanFX의 새로운 지표입니다. 정확한 트레이딩 신호 와 적응형 TP/SL 레벨 을 결합하여, 결과적으로 가능한 최고의 통계적 트레이딩을 만들어냅니다! 5회 구매마다 가격이 인상되며, 다음 가격은 69$입니다. 구매 후 저에게 메시지를 보내주시면 팁/가이드와 보너스 EA를 제공해 드립니다. 무엇이 이 지표를 특별하게 만들까요? Gold XAUUSD에서 검증된 통계적 성과 ( 거의 모든 자산에서 작동 하며, 일관된 결과 없이 모든 것을 다루려고 하기보다는 하나의 타임프레임을 완전히 익히는 데 집중합니다) 각 심볼당 하루 1~8회의 트레이드 와 높은 승률을 제공하며, 모든 통계적 우위를 우리의 편으로 가져갑니다. 차트에는 확인된 BUY 및 SELL 신호만 표시됩니다. 각 트레이드에 대해 지표가 생성하는 적응형 TP 및 SL 레벨 평균 승률 75%+ 평균 Signal Ratio 최소 1.1+ 알람 및 알림이 휴대폰 으로도
SuperScalp Pro
Van Minh Nguyen
4.54 (37)
SuperScalp Pro - Professional Multi-Layer Confluence Scalping System SuperScalp Pro는 기존 Supertrend에 여러 지능형 확인 필터를 추가하여 기능을 강화한 고급 스캘핑 지표입니다. 잘못된 신호를 크게 줄이면서 성공 가능성이 더 높은 Buy/Sell 거래 기회를 식별하는 데 도움을 줍니다. 명확한 Buy 및 Sell 화살표가 차트에 직접 표시되며, ATR 기반 Stop Loss 및 Take Profit 레벨도 실시간으로 자동 계산됩니다. 구매 후 MQL5 메시지로 저에게 연락하시면 SuperScalp Pro Auto Trader EA를 무료로 받으실 수 있으며, 사용자 가이드와 비공개 그룹 이용 권한도 제공됩니다. 권장 설정 파일 다운로드: [Set File] 전체 문서는 제품 블로그에서 확인할 수 있습니다: [User Guide] 업데이트를 받으려면 공식 채널에 참여하세요: [Official Channel]
SMC Intraday Formula
VividMind Digital Solutions
5 (26)
먼저 솔직하게 말하겠습니다. 어떤 인디케이터도 단독으로 당신을 수익성 있게 만들어주지 않습니다. 누군가 그렇게 말한다면, 그는 당신에게 꿈을 파는 것입니다. 완벽한 매수/매도 화살표를 보여주는 모든 인디케이터는 완벽하게 보이도록 만들 수 있습니다 — 단지 올바른 과거 구간을 확대하고 승리한 거래만 캡처하면 됩니다. 우리는 그렇게 하지 않습니다.  SMC Intraday Formula는 도구입니다. 시장 구조를 읽고, 가장 높은 확률의 가격 구간을 표시하며, 현재 스마트 머니의 흐름이 어떻게 보이는지 아주 단순한 언어로 보여줍니다. 최종 결정은 여전히 당신이 합니다. 실행도 당신이 합니다. 하지만 이제는 희망이 아니라 정확성으로 거래하게 됩니다. 우리는 이 인디케이터를 지난 약 3년 동안 골드(XAUUSD) 및 주요 외환 통화쌍의 데이 트레이딩 스캘핑에 사용해 왔습니다. M1, M5, M15, M30에서 우리의 핵심 도구입니다. 이 도구는 미래를 예측하려 하지 않습니다 — 지금 형성
Entry Points Pro for MT5
Yury Orlov
4.52 (152)
전설이 돌아왔습니다: Entry Points Pro 10. MQL5 마켓 Top-3 자리를 3년간 지켜온 전설적인 지표의 재출시입니다. 두 버전 합산 600개 이상의 리뷰, 매일 이 지표로 거래하는 수천 명의 트레이더, 28,000회 이상의 데모 다운로드   MT4+MT5 . 지난 5년간 여러분이 남긴 리뷰를 하나도 빠짐없이 읽었고, 약속 대신 그 답을 버전 10에 담았습니다. 1999년부터 시장에서 활동하며 정직함과 자신의 평판, 그리고 고객을 소중히 여기는 개발자가 만들었습니다. Entry Points Pro의 진입 시그널은 절대 리페인팅되지 않습니다. 그리고 이번에는 개발자의 말뿐이 아니라 검증 가능한 사실입니다: 확정 시그널은 캔들 종가에서만 표시되며, 자동화 테스트에서 리페인팅 0건 이 확인되었습니다(EURUSD, XAUUSD, BTCUSD에서 2,486,568회의 불변조건 검사 — 위반 0건). 검증 방법은 공개되어 있으니 전략 테스터에서 직접 재현해 보실 수 있습니다.
GoldenX Entry MT5
VividMind Digital Solutions
5 (17)
GoldenX Entry는 MT5용 인디케이터로, 적응형 Smart Entry Trend 알고리즘, 신호 스코어링 시스템, 시장 레짐 감지 기능, 그리고 변동성 필터를 포함합니다. 각 신호에는 계산된 진입 레벨, 3개의 익절(TP1, TP2, TP3) 레벨, 그리고 손절(Stop-Loss) 레벨이 포함됩니다. 이 인디케이터는 다양한 시장 환경에 적응하도록 설계된 다중 분석 레이어 구조 위에 구축되어 있으며, 내장 최적화기와 통계 추적 시스템을 결합합니다. 또한 Risk-to-Reward(RR) 지표와 과거 거래 행동 기반의 정량 분석을 제공합니다. 시작은 간단합니다 — 선택한 타임프레임에서 최적화기를 실행한 뒤 차트에서 바로 인디케이터를 사용하면 됩니다. 핵심 기능 GoldenX Entry는 하나의 차트에서 신호 엔진, 트레이드 관리 기능, 그리고 과거 통계 추적을 통합합니다: - 내장 최적화기: 최적화기는 차트에서 원클릭으로 실행됩니다. 200개의 파라미터 조합을 두 단계 탐색
Auto Optimized SpeedAngle 은 지속적인 워크포워드 최적화(Walk-Forward Optimization, WFO)를 통해 곡선 적합(curve-fitting)을 제거한 기관 수준의 모멘텀 벡터화 시스템입니다. 시장 체제가 바뀔 때 성능이 떨어지는 정적 입력에 의존하는 대신, 이 지표는 표본 외(Out-of-Sample, OOS) 검증을 사용하여 매개변수를 동적으로 재보정하며, 표시되는 신호가 과거의 우연이 아닌 진정한 통계적 우위를 나타내도록 보장합니다. 핵심 기관용 프레임워크 워크포워드 최적화 엔진: 핵심 알고리즘은 수천 가지의 룩백(lookback) 및 임계값 조합을 지속적으로 스캔하며, 데이터를 인샘플(in-sample)과 표본 외(out-of-sample) 세트로 엄격하게 분리합니다. 미지의 데이터 환경에서 수학적 우수성이 증명된 경우에만 새로운 매개변수 구성을 채택합니다. 정량적 목적 함수: 순수한 총이익을 쫓는 대신, 최적화 엔진은 기관 수준의 안정성
ARIPoint
Temirlan Kdyrkhan
1 (4)
ARIPoint is a powerful trading companion designed to generate high-probability entry signals with dynamic TP/SL/DP levels based on volatility. Built-in performance tracking shows win/loss stats, PP1/PP2 hits, and success rates all updated live. Key Features: Buy/Sell signals with adaptive volatility bands Real-time TP/SL/DP levels based on ATR Built-in MA Filter with optional ATR/StdDev volatility Performance stats panel (Success, Profit/Loss, PP1/PP2) Alerts via popup, sound, push, or email Cu
Gann Made Easy MT5
Oleg Rodin
5 (12)
Gann Made Easy 는 mr.의 이론을 사용하여 최고의 거래 원칙을 기반으로 하는 전문적이고 사용하기 쉬운 Forex 거래 시스템입니다. W.D. 간. 이 표시기는 Stop Loss 및 Take Profit Levels를 포함하여 정확한 BUY 및 SELL 신호를 제공합니다. PUSH 알림을 사용하여 이동 중에도 거래할 수 있습니다. 구매 후 거래 방법 안내 및 유용한 추가 지표를 무료로 받으시려면 저에게 연락주세요! 아마도 Gann 거래 방법에 대해 이미 여러 번 들었을 것입니다. 일반적으로 Gann의 이론은 초보자 거래자뿐만 아니라 이미 거래 경험이 있는 사람들에게도 매우 복잡한 것입니다. Gann의 거래 방식은 이론적으로 적용하기 쉽지 않기 때문입니다. 나는 그 지식을 연마하고 Forex 지표에 최고의 원칙을 적용하기 위해 몇 년을 보냈습니다. 표시기는 적용하기가 매우 쉽습니다. 차트에 첨부하고 간단한 거래 권장 사항을 따르기만 하면 됩니다. 지표는 지속적으로 시장 분석
M1 Sniper MT5
Oleg Rodin
5 (7)
M1 SNIPER 는 사용하기 쉬운 거래 지표 시스템입니다. M1 시간대에 맞춰 설계된 화살표 지표입니다. 이 지표는 M1 시간대 스캘핑을 위한 단독 시스템으로 사용할 수 있으며, 기존 거래 시스템의 일부로도 사용할 수 있습니다. 이 거래 시스템은 M1 시간대 거래용으로 특별히 설계되었지만, 다른 시간대에도 사용할 수 있습니다. 원래는 XAUUSD와 BTCUSD 거래를 위해 이 방법을 설계했지만, 다른 시장 거래에도 유용하다는 것을 알게 되었습니다. 이 지표의 신호는 추세 방향과 반대로 거래될 수 있습니다. 저는 지표의 신호를 활용하여 양방향으로 거래할 수 있도록 돕는 특별한 거래 기법을 알려드립니다. 이 방법은 특별한 동적 지지선과 저항선 가격 영역을 활용하는 것을 기반으로 합니다. 구매하시면 M1 SNIPER 화살표 지표를 바로 다운로드하실 수 있습니다. 또한, 아래 스크린샷에 표시된 Apollo Dynamic SR 지표는 M1 SNIPER 도구를 사용하는 모든 사용자에게 무료로
Adaptive Price Action Engine 지표를 구매하면 EA(자동매매 프로그램)가 무료 멀티 타임프레임 기반 자기 최적화 추세 & 캔들 패턴 분석 시스템 시장은 끊임없이 변화하며, 모든 Price Action 패턴이 모든 시장 환경에서 동일한 가치를 가지는 것은 아닙니다. Adaptive Price Action Engine 은 변화하는 시장 환경에 적응할 수 있도록 설계되었으며, 추세 구조, 멀티 타임프레임 분석, 캔들 패턴 및 통계적 최적화 를 하나의 분석 프레임워크로 결합합니다. 두 가지 적응형 모드 Dual Alpha Trend Mode 낮은 타임프레임과 높은 타임프레임에서 적합한 Alpha Trend 파라미터를 자동으로 탐색하여, 최근 시장 움직임에 맞춰 추세 분석을 조정합니다. Candlestick + Alpha Mode Alpha Trend를 통한 시장 국면 분석과 22개의 상승 및 하락 캔들 패턴 을 결합합니다. 모든 패턴을 동일하게 취급하는 대신, 다양
Power Candles MT5
Daniel Stein
4.58 (12)
Power Candles V3 - 자체 최적화 강도 지표 파워 캔들 V3는 적용된 모든 차트에서 통화 및 상품의 강세를 실행 가능한 거래 계획으로 전환합니다. 단순히 캔들에 색상을 입히는 대신, 백그라운드에서 실시간 자동 최적화를 수행하여 현재 보고 있는 종목에 대한 최적의 손절매, 익절 및 신호 임계값을 제공합니다. 한 번의 클릭으로 실시간 거래에 적용할 수 있으며, 진입점, 손절매 및 익절 선이 정확한 가격에 맞춰 차트에 표시되고, 방향과 함께 알림이 발령됩니다. 이 도구는 Stein Investments 에코시스템의 일부입니다. 18개 이상의 도구와 함께 당신의 1대1 AI 트레이딩 멘토 Max.  항상 대기 중, 모든 인디케이터를 깊이 있게 이해, 무언가를 차근차근 생각해보고 싶은 순간에 도움을 줍니다.  https://stein.investments 에서 만나보세요 매 종가 바마다 3,000회 이상의 트레이딩 시뮬레이션. 9가지 강도 상태. 2가지 전략을 병렬로 테스트.
다음 업데이트 — 버전 2.52 곧 출시! [신규] 시장 분석 및 트레이딩 워크플로를 향상시키기 위해 설계된 4가지 주요 신규 기능을 기대해 주세요. 트레이딩 요구 사항을 충족하도록 설계된 4가지 새로운 기능으로 시장 분석을 한 단계 더 발전시킵니다. 다음 기능을 소개합니다: 1. TRADE OVERVIEW DASHBOARD 2. CONFLUENCE AT ZONE 3. STRONG & WEAK HIGH/LOW 4. OTE 1. TRADE OVERVIEW DASHBOARD 시장 전체 상황을 더 쉽게 파악할 수 있도록 도와주는 대시보드입니다. 트레이딩 의사결정을 지원하는 가이드를 제공하며, 하나의 화면에서 시장을 분석하고 체계적으로 트레이딩을 계획할 수 있도록 도와줍니다. 멀티 타임프레임 시장 개요 (Multi-Timeframe Market Overview) 시장 방향과 가격 구조를 더욱 명확하게 파악 시장 상황을 빠르게 확인 체계적인 시장 분석 및 진입 계획을 위한 가이드 2. CO
Boba Analysis Suite
Trade Ready Solutions LLC
5 (2)
Boba Analysis Suite Boba Analysis Suite는 MetaTrader 5용 분석 지표입니다. 시장 구조, 주요 가격 영역, 전반적인 시장 상황을 하나의 차트 화면에 통합하여 표시합니다. 트레이더이자 트레이딩 코치로서의 실무 경험을 바탕으로 개발되었으며, 시장 방향 평가, 주요 가격 수준 식별, 여러 시간대의 종합적인 분석 등 체계적인 분석 과정을 지원합니다. 시장 맥락을 고려한 분석 개별 신호의 의미는 시장 상황에 따라 달라집니다. Boba Analysis Suite는 현재 차트 상황을 더 넓은 시장 구조와 연결하고, 사전에 정한 규칙에 따라 매매 아이디어를 검토할 수 있도록 돕습니다. 주요 분석 기능은 다음과 같습니다. 추세 및 시장 구조: 시장 방향과 관련 구조적 맥락을 평가합니다. 주요 가격 영역 및 수준: 추가 분석이 필요한 중요한 영역을 차트에 시각적으로 표시합니다. 여러 시간대: 서로 다른 시간대의 정보를 통합하여 전반적인 시장 상황을 평가합니다.
FiboSniper Pro
Van Minh Nguyen
5 (4)
FiboSniper Pro – Multi-Filter Fibonacci System with Auto SL/TP and Control Panel FiboSniper Pro는 동적 Fibonacci Envelopes와 여러 확인 필터를 결합하여 선별된 Buy 및 Sell 신호를 생성하는 기술적 지표입니다. Fibonacci 레벨은 Moving Average와 ATR을 기반으로 계산된 후 ADX, EMA, RSI, ATR, Volume, Time 및 Candle 구조를 통해 필터링됩니다. 이 지표는 ATR 기반의 자동 Stop Loss 및 Take Profit 레벨을 차트에 직접 표시하며, 빠른 설정 조정을 위한 인터랙티브 Control Panel을 제공합니다. 구매 후 MQL5 메시지로 저에게 연락하시면 Auto Trader X를 무료로 받으실 수 있으며, 이 지표의 거래 신호를 자동화하는 방법에 대한 안내도 제공됩니다. User Guide 및 Set Files: [Click here
Tokyo mt5 Indicator
Vasiliy Strukov
5 (12)
Tokyo Indicator는 추세 방향, 잠재적 거래 신호 및 시장 상황을 명확하고 시각적으로 보여줍니다. 색상으로 구분된 계단식 추세선은 강세 구간(파란색)과 약세 구간(자홍색)을 명확히 구별해 줍니다. 추세가 전환될 때 나타나는 방향성 화살표는 잠재적인 매수 및 매도 기회를 강조하여 보여줍니다. 통합 대시보드는 현재 신호, 시장 성향(bias), 모멘텀, 변동성, 신호 품질 등의 정보를 한눈에 파악할 수 있도록 구성되어 있습니다. 이를 통해 트레이더는 별도의 패널을 오갈 필요 없이 가격 움직임(price action)과 지표의 데이터를 동시에 분석할 수 있습니다. 깔끔한 차트 화면과 간결한 시장 개요를 제공하는 Tokyo Indicator는 체계적인 추세 분석과 거래 결정을 지원합니다. 모든 시간대와 다양한 자산(특히 금)에서 활용할 수 있습니다. 추세 방향, 잠재적 거래 신호 및 시장 상황을 명확하고 시각적으로 보여줍니다. 색상으로 구분된 계단식 추세선은 강세 구간(파란색)
Trend Catcher ind mt5
Ramil Minniakhmetov
5 (18)
트렌드 캐처 인디케이터 트렌드 캐처 인디케이터는 개발자가 자체 개발한 맞춤형 적응형 트렌드 분석 지표들을 조합하여 시장 가격 움직임을 분석합니다. 단기적인 노이즈를 제거하고 근본적인 모멘텀 강도, 변동성 확대, 가격 구조 움직임에 집중하여 진정한 시장 방향을 파악합니다. 또한 이동 평균, RSI, 변동성 필터와 같은 맞춤형 지표들을 활용하여 가격을 평활화하고 트렌드를 필터링합니다. 실제 운영 모니터링 및 기타 제품은 다음 링크에서 확인하실 수 있습니다:   https://www.mql5.com/en/users/mechanic/seller 텔레그램에서는 EA나 설정 파일을 판매하지 않습니다. 사기이니 주의하세요. 모든 설정 파일은 블로그에서 무료로 제공됩니다. 중요! 구매 후 즉시 연락 주시면 사용 방법 및 보너스를 드립니다!
Gold Trend Coach MT5
Cristhian Alexander Gaibor Cuasquer
5 (2)
Gold Trend Coach는 MetaTrader 5용 골드(XAUUSD) 추세 지표로, 매수 및 매도 신호, 손절과 세 개의 익절 목표를 봉 마감 시 확정하며, 멀티 타임프레임 코치 대시보드와 휴대폰 및 Telegram 알림을 제공합니다. 런던과 뉴욕 세션의 M5 스캘핑과 M15 데이트레이딩을 위해 만들어졌습니다. Gold Trend Coach: 진입, 손절, 세 개의 목표가 있는 XAUUSD 골드 추세 신호. 출시 가격 $39, 처음 20개 한정, 이후 $59. 구매 후 메시지를 주시면 구매자 키트를 바로 보내 드립니다. 최악의 연속 손실을 차트 위에 그대로 보여 주는 골드 지표. 이 마켓의 모든 XAUUSD 지표는 자신의 승리 신호를 보여 줍니다. Gold Trend Coach는 손실 신호도 보여 줍니다. 빨간색으로 세고, 최악의 연속 손실과 순결과를 보기 좋은 것만이 아니라 모든 것을 세는 패널에 표시합니다. 신호가 손절에 닿으면 보입니다. 세 번 연속 손절에 닿아도 보입
Quantum TrendPulse
Bogdan Ion Puscasu
5 (26)
SuperTrend   ,   RSI   ,   Stochastic   의 힘을 하나의 포괄적인 지표로 결합하여 트레이딩 잠재력을 극대화하는 궁극의 트레이딩 도구   인 Quantum TrendPulse를   소개합니다. 정밀성과 효율성을 추구하는 트레이더를 위해 설계된 이 지표는 시장 추세, 모멘텀 변화, 최적의 진입 및 종료 지점을 자신 있게 식별하는 데 도움이 됩니다. 주요 특징: SuperTrend 통합:   주요 시장 추세를 쉽게 따라가고 수익성의 물결을 타세요. RSI 정밀도:   매수 과다 및 매도 과다 수준을 감지하여 시장 반전 시점을 파악하는 데 적합하며 SuperTrend 필터로 사용 가능 확률적 정확도:   변동성이 큰 시장에서 숨겨진 기회를 찾기 위해 확률적 진동   을 활용하고 SuperTrend의 필터로 사용 다중 시간대 분석:   M5부터 H1 또는 H4까지 다양한 시간대에 걸쳐 시장을 최신 상태로 유지하세요. 맞춤형 알림:   맞춤형 거래 조건이 충족되면
Neuro Poseidon MT5
Daria Rezueva
4.75 (52)
Neuro Poseidon is a new indicator by Daria Rezueva. It combines precise trading signals with adaptive TP/SL levels - creating best possible trades as a result! Message me and get  Neuro Poseidon Assistant  as a gift to automize your trading process! What makes it stand out? 1. Proven profitability on all assets and timeframes 2. Only confirmed BUY and SELL signals present on the chart 3. Adaptive TP & SL levels generated by the software for each trade 4. Easy to understand - suitable for al
Azimuth Pro
Ottaviano De Cicco
5 (7)
Azimuth Pro V2: Synthetic Fractal Structure and Confirmed Entries for MT5 Overview Azimuth Pro is a multi-level swing structure indicator by Merkava Labs . Four nested swing layers, swing-anchored VWAP, ABC pattern detection, three-timeframe structural filtering, and closed-bar confirmed entries — one chart, one workflow from micro-swings to macro-cycles. This is not a blind signal product. It is a structure-first workflow for traders who care about location, context, and timing. Halloween P
소개       Quantum Breakout PRO   , 브레이크아웃 존 거래 방식을 변화시키는 획기적인 MQL5 지표! 13년 이상의 거래 경험을 가진 숙련된 트레이더 팀이 개발한       퀀텀 브레이크아웃 PRO       혁신적이고 역동적인 브레이크아웃 존 전략으로 거래 여정을 새로운 차원으로 끌어올리도록 설계되었습니다. Quantum Breakout Indicator는 5개의 이익 목표 영역이 있는 브레이크아웃 영역의 신호 화살표와 브레이크아웃 상자를 기반으로 한 손절 제안을 제공합니다. 초보자 거래자와 전문 거래자 모두에게 적합합니다. Quantum EA 채널:       여기를 클릭하세요 중요한! 구매 후 설치 매뉴얼을 받으려면 개인 메시지를 보내주십시오. 추천: 기간: M15 통화쌍: GBPJPY, EURJPY, USDJPY,NZDUSD, XAUUSD 계정 유형: 스프레드가 매우 낮은 ECN, Raw 또는 Razor 브로커 시간: GMT +3 중개인 :
Dynamic Forex28 Navigator MT5
Bernhard Schweigert
5 (1)
다중 통화 강도 및 모멘텀 지표 MT5 Dynamic Forex28 Navigator는 오랫동안 사랑받아 온 저희 지표의 진화 버전으로, 세 가지 기능을 하나로 결합했습니다: Advanced Currency Strength28 Indicator (리뷰 700개) Advanced Currency IMPULSE with ALERT (리뷰 530개) CS28 Combo Signals (최근 보너스) 두 이전 지표는 MQL5 Market에서 합계 1,200개가 넘는 리뷰를 받았으며 2016년부터 MT4 커뮤니티의 필수품이었습니다. Dynamic Forex28 Navigator MT5는 검증된 동일한 로직을 그대로 이어갑니다. MetaTrader 5를 위해 완전히 다시 제작 – MT5의 네이티브 다중 심볼 아키텍처를 최대한 활용하도록 설계되었습니다. 사용 설명서: https://www.mql5.com/en/blogs/post/758844 MT4 버전을 찾고 계신가요? 여기를 클릭하세요: ht
Scalper Vault MT5
Oleg Rodin
5 (1)
Scalper Vault는 당일 매매(intraday trading)에서 일관된 성과를 내고자 하는 트레이더를 위해 설계된, 강력하고 모든 기능을 갖춘 트레이딩 시스템입니다. 이 고정밀 지표는 외환(Forex) 및 바이너리 옵션 트레이더 모두에게 기관급 분석을 제공하는 독립적인 종합 트레이딩 시스템 역할을 합니다. 구매 후 저에게 연락해 주시면, 트레이딩 팁과 함께 특별한 보너스를 제공해 드립니다! Scalper Vault는 추측에 의존하거나 복잡한 수동 분석을 할 필요를 없애주며, 사용하기 쉬운 트레이딩 기법을 통해 오직 매매 실행에만 집중할 수 있도록 돕습니다. 정확한 추세 추종 신호: 핵심 알고리즘이 시장 구조를 분석하여, 지배적인 시장 추세 방향과 일치하는 고확률 신호만을 제공함으로써 잘못된 진입을 획기적으로 줄여줍니다. 정밀한 고점 및 저점 탐지: 시장의 움직임이 소진되는 지점을 스캔하여 잠재적인 반전 구간을 식별합니다. 간(Gann) 이론 기반의 매수/매도 구간: 수학적
Volatility Master for MetaTrader is a real-time dashboard tool that scans up to  50 symbols  to identify high-volatility , trending markets instantly. With bullish/bearish signals, customizable alerts, and a user-friendly interface, it helps you avoid range-bound conditions and focus on high-probability trades. Clarity leads to confidence. Trade confidently and protect your capital effectively with this powerful dashboard. We don't offer free or bonus indicators in exchange of reviews from you.
SR Liquidity MT5
Oleg Rodin
5 (2)
SR Liquidity 는 시장 유동성이 집중되고 가격이 가장 강력하게 반응하는 숨겨진 구간을 포착하도록 설계된 트레이딩 지표입니다. 이러한 특수 유동성 구간은 강력한 지지 및 저항선 역할을 하며, 시장 반전 가능성이 가장 높은 지점을 명확하게 보여주는 지도가 되어 줍니다. SR Liquidity는 일반적인 지지 및 저항선을 단순히 그리는 대신, 실제 가격 움직임을 분석하여 매수 및 매도 압력이 집중되는 구간을 포착합니다. 이러한 구간은 실질적인 시장의 흐름을 주도하는 유동성 풀(liquidity pools)에 해당합니다. 이 지표는 해당 구간을 차트에 직접 시각화하여, 가격 반응이 실제로 나타나기 전에 이를 미리 예측할 수 있도록 돕습니다. 즉, 가격 추세가 전환될 가능성을 사전에 파악하게 해주는 것입니다. 결과적으로 이 지표는 가공되지 않은 가격 움직임(price action)을 시장의 핵심 가격대, 다시 말해 추세 전환점이 될 수 있는 지점들을 보여주는 명확하고 실용적인 로드맵
OrderFlux – MetaTrader 5용 Order Flow Footprint Chart, Volume Profile 및 Market Profile 지표 OrderFlux는 MetaTrader 5용 오더 플로우 Footprint 지표로, 각 캔들 내부에서 실제로 어떤 거래가 발생하는지 명확하게 보여줍니다. 개별 캔들을 펼쳐 각 가격 수준에서 체결된 거래량을 표시하고, 공격적인 매도와 공격적인 매수를 구분합니다. 틱 데이터를 기반으로 실시간 Footprint 차트를 구성하며, Delta, Imbalance, Absorption, Volume Profile, Market Profile(TPO), VWAP, Cumulative Delta(CVD), DOM 탭 및 경제 캘린더를 하나의 정돈되고 읽기 쉬운 인터페이스에 통합합니다. 일반적인 차트는 시가, 고가, 저가, 종가만 보여줍니다. 이는 가격 움직임의 결과이지 원인은 아닙니다. OrderFlux는 오더 플로우 트레이딩의 핵심 질문에
제작자의 제품 더 보기
Trend Signal Navigator EA – free companion EA for the Trend Signal Navigator indicator This EA trades the confirmed, non-repainting signals of the Trend Signal Navigator indicator automatically, with professional risk and trade management. It is free: you don't need to send a private message or wait for a "bonus EA". How it works Live and demo charts : the EA reads the signals, stop loss and targets of the Trend Signal Navigator indicator through iCustom (default path Market\Trend Signal Navigat
FREE
A chart overlay indicator for traders who want a structured view of Smart Money Concepts, market structure shifts, order block patterns, fair value gaps, equal highs and lows, and key multi-timeframe price levels directly inside MetaTrader 5. BOS and CHoCH · Internal and Swing Structure · Order Block Finder · Input-Controlled FVG Colors · EQH and EQL · Premium and Discount Zones Product Overview SMC Price Action Patterns is designed to convert raw price action into a clear, visual market map. T
FREE
MACD Divergence Radar Pro Multi-Symbol Divergence Scanner & Visual Dashboard for MetaTrader 5 Regular & Hidden Divergence 20+ Pairs Simultaneous Scan Entry / SL / TP Levels History Statistics One-Click Chart Opening Auto Oscillator Sub-Window Overview MACD Divergence Radar Pro is a professional-grade divergence detection indicator that continuously scans multiple currency pairs and timeframes in real time. It identifies both regular and hidden MACD divergences — bullish and bearish — and presen
Professional account protection for prop-firm challenges and funded accounts. It monitors drawdown, open risk, news windows, trading sessions, manual trades, profit targets, and challenge progress in real time, then warns, locks, de-risks, deletes orders, or closes managed exposure according to your rules. Two draggable on-chart panels — Economic Calendar and Performance Stats — keep news planning and account analytics on the chart without leaving MT5. Built for Prop-Firm Traders This EA does no
VoidFlow IFVG Trade Assistant Pro is a manual-first MetaTrader 5 trading panel for Inverse Fair Value Gap (IFVG) setups. It finds fair value gaps, confirms when price closes through them, scores every setup from 0 to 100, draws a complete trade plan and lets you place the order with one click and one confirmation. Automatic entries are available as an option you switch on yourself. Video walk-through: see the video on this page. Free demo: download it and run it in the Strategy Tester (the demo
ICT Market Structure Pro ICT Market Structure Pro is a Smart Money Concepts / ICT trading tool designed to automatically draw the most important structural and liquidity elements directly on the chart. The indicator helps traders read price action through an institutional lens by mapping market structure shifts, liquidity pools, order blocks, imbalances, premium/discount zones, and key ICT session windows in one place. It supports both single-timeframe and multi-timeframe analysis modes, with a
Trade Assistant Risk Calculator is an all-in-one floating trading panel (Expert Advisor) designed for professional manual traders on MetaTrader 5. It combines Visual Chart Trading , Automatic Risk Calculation , and Advanced Position Management into a single, compact interface. Stop calculating lot sizes manually. Stop guessing your Risk:Reward ratio. Simply drag lines on the chart, and the EA calculates the exact lot size to match your risk percentage, equity, or money target. Important Notes Th
Trade Assistant Risk Calculator is an all-in-one floating trading panel Expert Advisor for MetaTrader 5, built for professional manual traders. It combines visual chart trading , automatic risk calculation , and advanced position management in one compact interface. Stop calculating lot sizes manually. Stop guessing your Risk:Reward ratio. Drag the planning lines on the chart and the EA calculates the exact lot size for your selected risk percentage, equity, fixed-money risk, or fixed-lot workfl
MT5 Indicator · All Markets · Non-Repainting Signals · Entry / SL / TP1-TP3 · MTF + Scanner Momentum Pulse colors every candle by the real momentum behind it, not by price alone. Each bar is scored on five dimensions and placed in one of nine strength states . On top of that you get buy/sell signals with Entry, Stop Loss and three Take Profit levels , a multi-timeframe bias dashboard , a multi-symbol scanner , a forward test of every past signal with win rate and profit factor, and a risk-based
Supertrend core · 11 click-to-toggle confirmation filters · Multi-timeframe trend dashboard · Entry / SL / TP1-TP3 levels · Higher-timeframe filter · Trend cloud · 5,000-bar performance simulation with profit factor & drawdown TrendGuard Pro is a professional-grade MT5 scalping indicator that fortifies every entry signal with up to 11 independent confirmation filters . False breakouts are systematically eliminated before an arrow ever appears on the chart, letting you trade only the highest-pro
ICT Market Structure EA ICT Market Structure EA trades fair value gaps in the direction of market structure, only inside the ICT Silver Bullet hours, and only when the H4 and D1 structure agree. One EA on one chart trades a whole portfolio — by default EURUSD, XAUUSD, USTEC and US500 . Its higher-timeframe context uses the same detection code as the indicator ICT Market Structure Pro (swings, BOS / CHoCH, order blocks, FVGs, premium / discount). The default portfolio and settings were checked wi
Price Action 10 Setups EA Price Action 10 Setups EA automates ten classic bar-by-bar price-action setups — the patterns that discretionary price-action traders consider the most reliable: major trend reversals, final flags, breakouts, High 2 / Low 2 pullbacks, wedges, channels, measured moves, trading-range reversals, opening reversals and magnet (breakout) tests. Every setup is a fully coded rule set with a precise entry, stop and target, so the EA trades the patterns the same way every time. O
MACD Divergence Radar EA MACD Divergence Radar EA trades MACD divergences automatically. It uses the same signal engine as the indicator MACD Divergence Radar Pro — price pivots compared with the MACD histogram (OsMA) or the MACD main line, regular and hidden divergences, bullish and bearish — and turns every freshly confirmed divergence into a trade with a stop beyond the divergence pivot and a fixed reward-to-risk target. One EA on one chart can trade a whole portfolio; by default EURUSD, GBPU
TrendGuard Pro Auto EA is a fully automated trend-following Expert Advisor built on the TrendGuard Pro signal engine. It enters when the Supertrend flips and the confirmation filters agree, protects every trade with an ATR stop loss, can bank profits in steps at TP1 / TP2 / TP3, lets winners run with an ATR trailing stop, and exits on the opposite signal. It trades the chart symbol, or a whole portfolio of symbols from one chart, and is controlled from an interactive on-chart dashboard. Signal e
Price Action 10 Setups Indicator Price Action 10 Setups Indicator finds ten classic bar-by-bar price-action setups on your chart and turns every one of them into a complete trade plan: entry, stop loss and target , drawn on the chart, tracked bar by bar and summarised in a modern dashboard with per-setup statistics, a multi-symbol scanner and alerts. The detection is the same code as in Price Action 10 Setups EA (the automated version on the MQL5 Market): the indicator shows a signal exactly whe
Momentum Pulse EA trades the signals of the Momentum Pulse indicator automatically. The complete Momentum Pulse signal engine is built into the EA: every closed bar is coloured in one of nine momentum states, and a change of state becomes a buy or sell signal with its own Entry, Stop Loss and three take-profit levels. The EA takes those trades with risk-based position sizing, banks profit in steps at TP1 / TP2 / TP3 and manages the rest with breakeven and an ATR trailing stop. One chart can trad
Harmonic patterns with an honest track record. The indicator finds Gartley, Bat, Alt Bat, Butterfly, Crab, Deep Crab, Shark, Cypher, 5-0 and AB=CD patterns on your chart and on dozens of symbols and timeframes at once, draws the XABCD shape with its Potential Reversal Zone (PRZ) and Fibonacci ratios, gives entry, stop loss and three targets, and shows how often each pattern actually worked on each symbol: PRZ hold rate, TP1 and TP2 hit rate and average result in R , measured with exactly the sam
Currency Strength Matrix measures the strength of the 8 major currencies from all 28 pairs , plus gold and any indices you add, and shows it three ways on one chart: a multi-timeframe heatmap (M5 to D1), strength lines in a sub-window, and an automatic strongest-vs-weakest pair picker . Click any cell or pair and the chart switches to it. Closed bars never repaint, and the indicator shows you how its own picks behaved on the history you have loaded. How strength is measured Each currency is comp
Bitcoin Trend Rider EA Bitcoin Trend Rider EA is a trend-following and volatility-breakout Expert Advisor for BTCUSD , ETHUSD and other crypto CFDs. It stays out of sideways and dead markets, enters only when a trend is confirmed, puts a hard ATR stop on every order and lets winning trends run with a chandelier trailing stop. No grid, no martingale, no averaging down, no hedging tricks. Everything is visible: every input is in the Inputs window, the ready-made setups are listed below, and the lo
Gold Edge Portfolio EA trades XAUUSD with six independent, simple strategies at the same time . Each engine has its own on/off switch, its own magic number and its own risk per trade, and every trade is placed with a hard stop loss . There is no grid, no martingale, no averaging and no hedging — one position per engine at most. What makes it different is transparency : a dashboard on the chart shows the live state and the real statistics of every engine — trades, win rate, profit factor, net pro
Session Breakout Portfolio EA A session-range breakout portfolio for indices, gold and forex, traded from one chart. Every market has a quiet session and an active open. The EA builds the range in the quiet session (Asian range, pre-open or opening range), in the exchange's own time zone with automatic daylight saving, and trades the breakout at the active session open with OCO stop orders. One stop-protected trade per market per day. No grid, no martingale, no averaging. Default portfolio (5 m
Trend Signal Navigator – trend, signals, targets and honest statistics in one indicator Trend Signal Navigator is an all-in-one trend signal system for MetaTrader 5. It shows the trend direction and regime, gives confirmed non-repainting BUY/SELL signals with an adaptive stop loss and three take-profit targets , marks reversal zones and key levels, and measures how its own signals performed on your chart in a live statistics panel. No hidden rules: every number in the panel can be re-counted fro
필터:
리뷰 없음
리뷰 답변