Table MATR
- 유틸리티
- 버전: 1.0

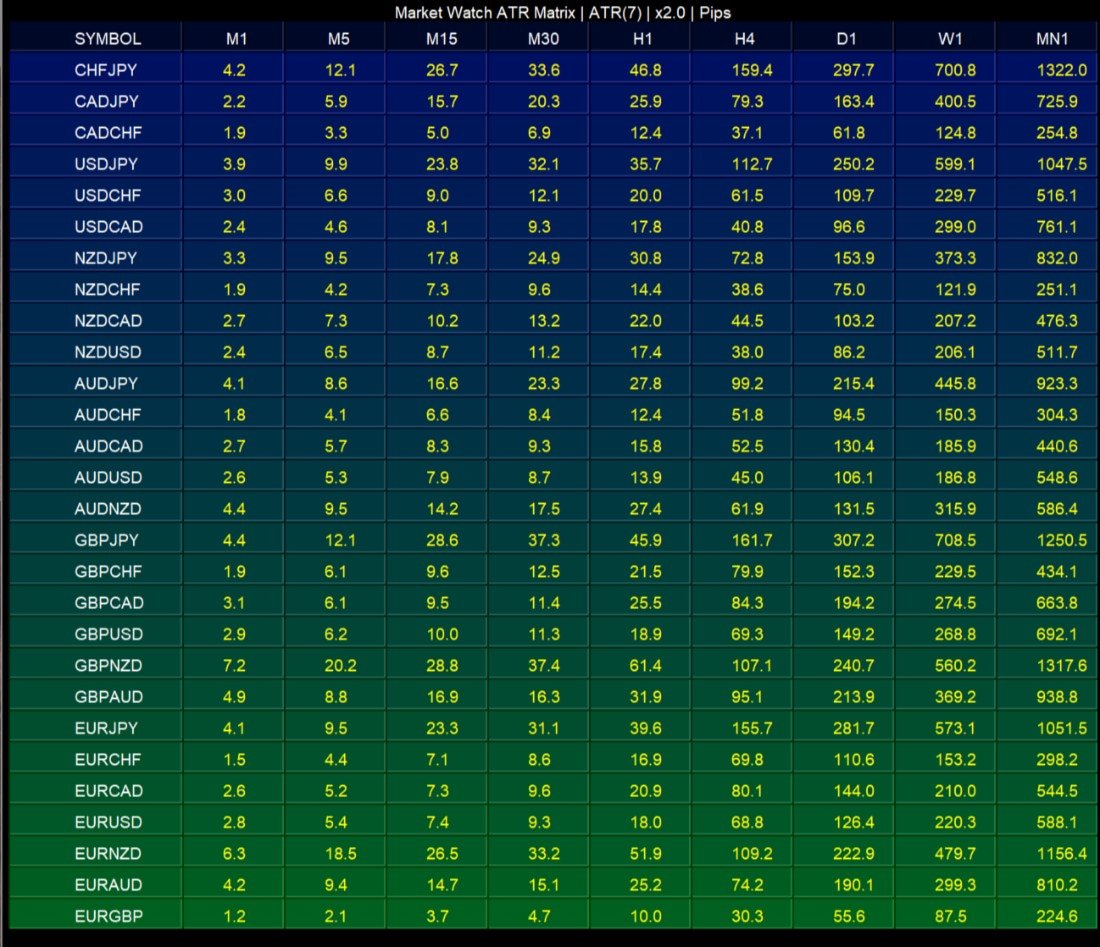
A Market Watch multi-timeframe ATR dashboard that turns a chart into a full-screen table showing each selected symbol’s recent volatility across multiple timeframes. It calculates ATR for the symbols visible in Market Watch, then displays the result in pips, points, or raw price units. Its practical use is volatility scanning, quickly finding instruments and timeframes that are moving enough—or quietly enough—for your trading style.
Period that is worth using
Style Period What it shows Scalp (M1–M15) 7–10 Recent range, more noise Intraday (M15–H1) 14 Standard balance Swing (H4–D1) 14–21 Smoother “normal” range
Shorter than 7 mostly tracks the last few candles. Longer than 21 lags the expansion you are trying to catch. Wilder settled on 14 after testing; later tests do not show a magic replacement. Robust systems still work at 10, 14, and 20. If a setup only works at one period, it is overfit.
Why the candle count matters for profitable moves
The period is the sample of “normal travel.” A profitable move has to be larger than that noise, and the stop has to be wide enough to survive it.
- 14 M15 candles cover 3.5 hours. That is one session slice. Good for judging whether London open actually expanded range.
- 14 H1 candles cover about 14 hours, roughly one full session cycle.
- 14 D1 candles cover about three trading weeks. That is the swing baseline.
Same number, different clock time. A 20-pip push is a real move on M15 if ATR is 8, and noise on H4 if ATR is 35. The candle count matters because it defines the noise floor. Too few candles and every spike look like a volume shift. Too many and the expansion is already over before ATR confirms it.
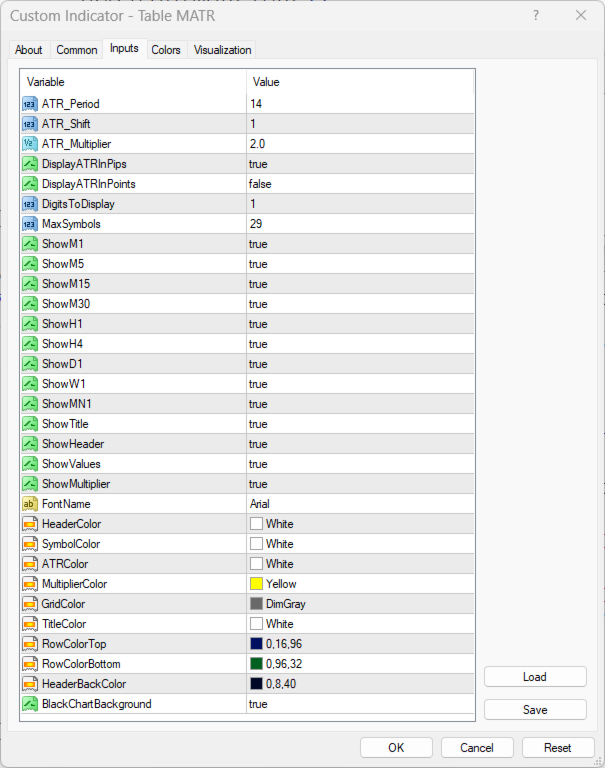
| Input | Default | Practical impact |
|---|---|---|
| ATR_Period | 7 | Shorter = more responsive/noisier; longer = smoother/slower |
| ATR_Shift | 1 | Uses completed candles; 0 would include the still-forming bar |
| ATR_Multiplier | 2.0 | Multiplies the displayed ATR; useful for directly viewing stop/target multiples |
| DisplayATRInPips | true | Best default for major/minor forex pairs |
| DisplayATRInPoints | false | Useful for broker-point precision or non-FX instruments |
| DigitsToDisplay | 1 | Decimal precision of pips/points output |
| MaxSymbols | 29 | Caps Market Watch rows and prevents overcrowding |
| ShowM1 to ShowMN1 | true | Lets you remove irrelevant timeframes |
| ShowMultiplier | true | If true, table shows ATR × multiplier, not raw ATR |
| BlackChartBackground | true | Makes the chart a dashboard; turn off if you want the normal chart look retained |
Important limitations
-
It gives no directional signal. ATR measures magnitude of movement, not whether price is likely to rise or fall.
-
It does not identify trend, support/resistance, reversals, entries, or exits.
-
It has no alerts, arrows, buffers, automated trade logic, or historical signal testing capability. It uses chart objects to display a table rather than indicator buffers.
-
It only scans symbols currently enabled in Market Watch ( SymbolsTotal(true) ), not every symbol your broker offers.
-
Inactive symbols, unavailable history, or insufficient data can show N/A .
-
ATR can rise sharply after a news spike; a large ATR does not necessarily mean the market remains tradeable or that volatility is favorable.
-
The output is based on the broker’s price feed, symbol digits, and candle data, so readings can differ somewhat across brokers.
Bottom line
Table-MATR.mq4 is a cross-market, cross-timeframe volatility monitor. Its strongest use is helping you choose what to trade, estimate plausible movement, and normalize stops/targets to each instrument’s current volatility—before applying your separate directional setup, structure analysis, and risk rules.