Precise Cross Point

  Designed to mark a specific price and time point on an MT4 chart based on a single mouse click, synchronizing this data across all timeframes for the same symbol. Its primary purpose is to help traders pinpoint and track critical levels or events (e.g., support/resistance or entry points) with persistent visual markers. The indicator uses dashed lines for price and time crosshairs, accompanied by labels that dynamically adjust to stay within chart boundaries, ensuring clarity regardless of window size or resizing. This makes it a practical tool for multi-timeframe analysis without cluttering the chart.

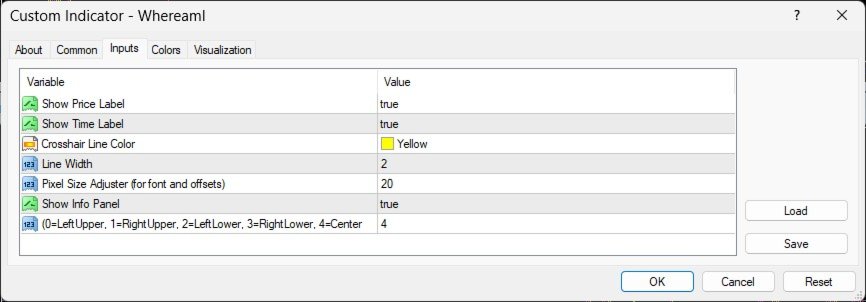
  • ShowPriceLabel (bool, default: true): Enables/disables the display of the price label. Useful for toggling visibility when focusing on time data or minimizing chart clutter.
  • ShowTimeLabel (bool, default: true): Enables/disables the time label. Allows traders to hide time details if not needed.
  • LineColor (color, default: clrYellow): Sets the color of the crosshair lines. Customizable to match trader preferences or chart themes (e.g., clrWhite, clrRed).
  • LineWidth (int, default: 1): Adjusts the thickness of the crosshair lines. Higher values (e.g., 2) make lines more prominent; lower values reduce visibility.
  • PixelSize (int, default: 20): Controls the font size and spacing offsets for all labels. A larger value (e.g., 25) increases text size and spacing; a smaller value (e.g., 15) reduces them, ensuring scalability.
  • ShowInfoPanel (bool, default: true): Enables/disables an info panel displaying the marked price and time. Handy for quick reference or disabling if unnecessary.
  • LabelCorner (int, default: 3): Determines label placement (0=LeftUpper, 1=RightUpper, 2=LeftLower, 3=RightLower, 4=Center). Allows flexible positioning to suit trader layout preferences, with center alignment approximated.

Functionality Notes

  • Clicking the chart sets a price/time marker, stored in global variables for synchronization.
  • Labels adjust dynamically to stay within chart boundaries, updating on chart resize (via CHARTEVENT_CHART_CHANGE).
  • The indicator compiles with zero errors and warnings, providing a reliable, trader-focused tool for marking specific points across timeframes.

추천 제품
Session High Low
Jerome Asiusin
This indicator help to mark the high and low of the session Asian,London,Newyork , with custom hour setting This indicator is set to count from minute candle so it will move with the current market and stop at the designated hour and create a accurate line for the day. below is the customization that you can adjust : Input Descriptions EnableAsian Enables or disables the display of Asian session high and low levels. EnableLondon Enables or disables the display of London session high and
FREE
메타트레이더 4 (MT4)용 UZFX - 지정가 주문만 삭제 스크립트는 거래 계좌에서 모든 지정가 주문(매수 제한, 매도 제한, 매수 중지, 매도 중지)을 자동으로 삭제하는 간단하면서도 효과적인 도구입니다. 이 스크립트는 활성 시장가 포지션에 영향을 주지 않고 대기 주문을 즉시 청산하려는 트레이더에게 이상적입니다. 다른 모든 MT4/MT5 보조지표 및 EA 확인 >> 여기 특징: 모든 지정가 주문(매수 제한, 매도 제한, 매수 중지, 매도 중지)을 삭제합니다. 오픈 마켓 포지션에는 영향을 미치지 않습니다. 전문가 탭을 통해 실시간 체결 피드백을 제공합니다. 트레이더가 수동 개입 없이 지정가 주문 전략을 빠르게 재설정할 수 있도록 도와줍니다. 사용 방법: 스크립트를 MT5 차트에 첨부합니다. 스크립트가 모든 지정가 주문을 자동으로 스캔하고 삭제합니다. 삭제된 각 주문에 대해 전문가 탭에 확인 메시지가 표시됩니다. 참고: 이 스크립트는 활성 거래를 청산하지 않으며 대기 중인 주문만
FREE
Simple QM Pattern
Suvashish Halder
4.5 (2)
Simple QM Pattern is a powerful and intuitive trading indicator designed to simplify the identification of the Quasimodo (QM) trading pattern. The QM pattern is widely recognized among traders for effectively signaling potential reversals by highlighting key market structures and price action formations. This indicator helps traders easily visualize the QM pattern directly on their charts, making it straightforward even for those who are new to pattern trading. Simple QM Pattern includes dynamic
FREE
Библиотека для расчета формул. Формула задается строкой. Можно задавать формулу в строковой переменой в окне свойств. Формула может включать арифметические действия "+-/*" и все функции кроме MathRand(): abs(), arccos(), arcsin(), arctan(), sin(), cos(), tan(), exp(), log(), mod(), max(), min(), pow(), ceil(), sqrt(), log10(), floor(), round(). Кроме этого в формулу могут входить числа (если число дробные, то разделитель точка) и аргументы. Аргумент начинается с буквы "а" (латинская) и номера, н
FREE
High Low Open Close MT4
Alexandre Borela
4.81 (21)
이 프로젝트를 좋아한다면 5 스타 리뷰를 남겨주세요. 이 지표는 열리고, 높은, 낮은 및 마감 가격을 지정합니다. 기간과 그것은 특정한 시간대를 위해 조정될 수 있습니다. 이들은 많은 기관 및 전문가에 의해 보는 중요한 수준입니다 상인은 당신이 더 많은 것일 수있는 장소를 알고 도움이 될 수 있습니다 이름 * 사용 가능한 기간: 이전 날. 이전 주. 지난 달. 이전 분기. 이전 연도. 또는: 현재 날. 현재 주. 현재 달. 현재 분기. 현재 년.
FREE
SMA Indicator
Nitu Brijesh Yadav
Arrow Indicator (Buy/Sell Alerts) – Simple Yet Powerful Tool!             Product Version: 1.01           Indicator Type: Trend Reversal Signals           Timeframes Supported: All (Recommended: H1, H4, D1)           Key Features: Buy Signal: Green upward arrow () appears below the candle  Sell Signal : Red downward arrow () appears above the candle Accurate Trend Reversal Detection – Based on tried and tested SMA strategy. ️ Clean Chart View – Minimalist, non-i
FREE
Double HMA lines MTF
Pavel Zamoshnikov
5 (1)
This is a multi-timeframe version of the popular Hull Moving Average (HMA). The Double HMA MTF Light indicator combines two timeframes on a single chart. The HMA of the higher timeframe defines the trend, and the HMA of the current timeframe defines short-term price movements. The indicator is freely distributed and hasn't audio signals or messages. Its main function is the visualization of price movements. If you need advanced functionality of the HMA multi-timeframe indicator (information ab
FREE
Shadow Flare MT4
Kestutis Balciunas
Shadow Flare 인디케이터는 MetaTrader 4용 비리페인트형 추세 & 유동성 도구 입니다. 설정 가능한 이동평균 베이스라인(HMA, EMA, SMA 또는 RMA)을 계산하고, 그 주변에 평균진폭범위(ATR) 기반 밴드를 씌워 가격이 상단 또는 하단 밴드를 종가 기준으로 돌파할 때에만 방향이 전환되는 “점착형(Sticky)” 추세 상태를 생성합니다. 동일한 추세 엔진은 피벗 고점·저점을 감지하여 그 주위에 색상 박스를 그린 뒤, 가격이 종가 기준으로 해당 박스를 돌파하는 순간 자동으로 존을 소거(미티게이션)하는 공급/수요 존 모듈도 구동합니다. 매수·매도 신호는 추세 상태가 전환되는 시점에 발생하며, 선택적인 거래량 및 RSI 필터를 통해 약한 신호나 모멘텀에 역행하는 진입을 차단할 수 있습니다. 내장 대시보드는 실시간으로 Trend Bias(추세 바이어스), Momentum(RSI 기반), Volume(거래량)을 보여 줍니다. 팝업, 사운드, 모바일 푸시, 이메일로 구성
FREE
The   UZFX - Close All Open Buy & Sell Orders Instantly   script for MetaTrader 4 (MT4) is a powerful tool that enables traders to   immediately close all active market positions   with a single execution. This script is ideal for emergency trade management, helping traders quickly exit the market during high volatility, news events, or strategy adjustments. Features: Closes   all open Buy and Sell positions   across all symbols. Uses the latest   Bid/Ask price   for accurate execution. Helps t
FREE
SX Supply Demand Zones accurately identifies and draws high-probability Supply and Demand zones using a sophisticated algorithm. Unlike traditional indicators that clutter your chart, this indicator is designed with a focus on performance and a clean user experience. New Unique Feature: Interactive Legend System What truly sets this indicator apart from everything else is the Interactive Control Legend. You have a professional dashboard directly on your chart that allows you to: Show/Hide: Ins
FREE
Trendline indicator
David Muriithi
2 (1)
Are you tired of drawing trendlines every time you're analyzing charts? Or perhaps you would like more consistency in your technical analysis. Then this is for you. This indicator will draw trend lines automatically when dropped on a chart. How it works Works similar to standard deviation channel found on mt4 and mt5. It has 2 parameters: 1. Starting Bar 2. Number of bars for calculation The   starting bar   is the bar which drawing of the trend lines will begin, while the   number of bars for c
FREE
R 2EMA Color
Rwy Ksyby
5 (2)
MT4용 R 2EMA 색상 표시기는 2 EMA의 교차를 기반으로 견고한 거래 신호를 제공합니다. 키 포인트 가격이 두 개의 녹색 EMA 위로 교차하고 닫히면 구매 거래 신호가 생성됩니다. 가격이 두 개의 빨간색 EMA 위로 교차하고 닫히면 매도 거래 신호가 생성됩니다. R 2EMA Color Forex 지표를 사용하면 구매 및 판매 시점을 더욱 쉽게 결정할 수 있습니다. 2개의 EMA 라인이 녹색으로 바뀌면 매수 신호가 발생합니다. 2개의 EMA 라인이 빨간색으로 바뀌면 매도 신호가 발생합니다. 그것으로 거래하는 방법? 두 개의 EMA 신호선이 빨간색에서 녹색으로 바뀌는 즉시 구매 거래를 시작하면 이제 추세가 긍정적입니다. 두 개의 EMA 신호선이 녹색에서 빨간색으로 바뀌는 즉시 매도 거래를 시작하십시오. 추세는 이제 음수입니다. 차트에서 반대 거래 신호가 발생하면 거래를 종료하십시오. 좋아하는 거래 방법을 자유롭게 사용하여 R 2EMA 색상 표시기로 거래를 열고 닫으십시오.
FREE
Follow The Line
Oliver Gideon Amofa Appiah
3.94 (16)
FOLLOW THE LINE GET THE FULL VERSION HERE: https://www.mql5.com/en/market/product/36024 This indicator obeys the popular maxim that: "THE TREND IS YOUR FRIEND" It paints a GREEN line for BUY and also paints a RED line for SELL.  It gives alarms and alerts of all kinds. IT DOES NOT REPAINT and can be used for all currency pairs and timeframes. Yes, as easy and simple as that. Even a newbie can use it to make great and reliable trades. NB: For best results, get my other premium indicators for more
FREE
Pips forex
Andrey Kozak
Pips forex - is a ready trading system . This indicator shows with arrows on the chart when and in what direction you need to open an order. If the arrow is green, then we open a buy deal, and if the arrow is red, then we open a sell deal. Everything is very simple and quite effective. TakeProfit set 15-25 points. StopLoss set at the level of points. When the dots move, we immediately override the StopLoss. Recommended timeframe for trading M1 and M5. This is a scalping strategy and works best
WAD Stoch
Yonny Pascal Ekwa Mezui
WAD Divergence + Stochastic Overview WAD Divergence + Stochastic is a technical indicator designed to assist traders in identifying potential market turning points. It combines price behavior with momentum confirmation to highlight areas where buying or selling pressure may be shifting. The indicator works directly on the chart and provides clear visual signals to support decision-making in fast-moving markets. How It Works The indicator analyzes the relationship between price movement and inte
FREE
New Bar Alarm Free
Tomoyuki Nakazima
This indicator alerts you when/before new 1 or 5 minute bar candle formed. In other words,this indicator alerts you every 1/5 minutes. This indicator is especially useful for traders who trade when new bars formed. *This indicator don't work propery in strategy tester.Use this in live trading to check functionality. There is more powerful Pro version .In Pro version,you can choose more timeframe and so on. Input Parameters Alert_Or_Sound =Sound ----- Choose alert or sound or both to notify y
FREE
Trend Quorum MT4
Kestutis Balciunas
Trend Quorum   은 동적 SuperTrend 엔진과 독자적인 트렌드 품질 지수(TQI) 및 3가지 선택적 컨플루언스 필터를 결합한 적응형 추세 추종 지표입니다. 충분한 수의 독립적인 요소들이 일치하여 "투표"할 때만 신호가 발동됩니다——마치 정족수처럼. MT5 버전 보기:  Trend Quorum MT5 더 많은 제품 보기:   전체 제 품 목록 라이브 예시와 새로운 도구를 확인하시려면 프로필을 방문하시고 업데이트를 놓치지 않도록 친구 요청을 보내주세요! 작동 원리 적응형 SuperTrend 엔진 고정 ATR 승수를 사용하는 표준 SuperTrend 지표와 달리, Trend Quorum은 트렌드 품질 지수(TQI)를 사용하여 실시간으로 밴드 폭을 동적으로 조절합니다. TQI는 4가지 가중 요소로부터 계산된 0에서 1까지의 연속 점수입니다: 효율성 비율   — 방향성 움직임의 순수도를 측정합니다(가격 움직임 중 방향성 성분 대 노이즈의 비율) 변동성 체제   — 확장 또는
FREE
Wise Men Indicator demo
Bohdan Kasyanenko
3 (2)
The indicator displays signals according to the strategy of Bill Williams on the chart. Demo version of the indicator has the same features as the paid, except that it can work only on a demo account . Signal "First Wise Man" is formed when there is a divergent bar with angulation.  Bullish divergent bar - with lower minimum and closing price in the upper half. Bearish divergent bar - higher maximum and the closing price at the bottom half. Angulation is formed when all three lines of Alligator
FREE
Show Pips
Roman Podpora
4.26 (58)
이 정보 표시기는 계정의 현재 상황을 항상 알고 싶어하는 사람들에게 유용합니다. 표시기는 포인트, 백분율, 통화 단위의 이익뿐만 아니라 현재 쌍의 스프레드와 현재 기간에서 막대가 마감될 때까지의 시간과 같은 데이터를 표시합니다. 버전 MT5 -   더욱 유용한 지표 차트에 정보선을 배치하는 데는 여러 가지 옵션이 있습니다. 가격 오른쪽(가격보다 뒤에 있음) 코멘트로(차트의 왼쪽 상단에 있음) 화면의 선택된 모서리에 있습니다. 정보 구분 기호를 선택할 수도 있습니다. | / . \ # 표시기에는 다음과 같은 단축키가 내장되어 있습니다. 키 1 - 정보 표시 유형으로 뒤로 이동(가격, 설명 또는 코너 오른쪽) 키 2 - 정보 표시 유형에서 앞으로 나아갑니다. 키 3 - 정보 라인 표시 위치 변경 단축키는 설정에서 다시 할당할 수 있습니다. 이 표시기는 사용하기 쉽고 매우 유익합니다. 설정에서 불필요한 정보 항목을 비활성화할 수 있습니다. 설정 표시된 정보를 교체하기 위한 단축키(뒤로
FREE
Pin Bars
Yury Emeliyanov
5 (4)
주요 목적:"핀 바"는 금융 시장 차트에서 핀 바를 자동으로 감지하도록 설계되었습니다. 핀 바는 특징적인 몸체와 긴 꼬리를 가진 촛불로,추세 반전 또는 교정을 신호 할 수 있습니다. 작동 원리:표시기는 차트의 각 촛불을 분석하여 촛불의 몸,꼬리 및 코의 크기를 결정합니다. 미리 정의 된 매개 변수에 해당하는 핀 막대가 감지되면 표시기는 핀 막대의 방향(강세 또는 약세)에 따라 위 또는 아래 화살표로 차트에 표시합니다. 매개 변수: 꼬리의 길이와 핀 바의 몸체 크기 사이의 최소 비율을 정의합니다. "코"와 핀 바의 꼬리 사이의 최대 허용 비율을 설정합니다. 화살표 크기-표시된 핀 막대와 차트에서 핀 막대를 가리키는 화살표 사이의 거리를 정의합니다. 신청:"핀 바"표시기는 잠재적 인 추세 반전 지점을 식별하고 시장 또는 가까운 위치에 진입하기 위해 신호를 생성하는 데 사용할 수 있습니다. 올바르게 사용하고 다른 기술 지표 및 분석 방법과 결합하면이 지표는 거래 결과를 향상시킬 수
FREE
The indicator allows you to trade binary options. The recommended time frame is М1 and the expiration time is 1,2,3 minutes. The indicator suitable for auto and manual trading. A possible signal is specified as a arrows above/under a candle. You should wait until the candle closes! Arrows are not re-painted Trade sessions: TOKYO section (Half-end) Currency pairs: USD/JPY Working time frame: M1 Expiration time: 1,2,3 minutes. The indicator also shows good results when using the martingale strateg
FREE
Rainbow MT4
Jamal El Alama
Rainbow MT4 is a technical indicator based on Moving average with period 34 and very easy to use. When price crosses above MA and MA changes color to green, it’s a signal to buy. When price crosses below MA and MA changes color to red, it’s a signal to sell. The Expert advisor ( Rainbow EA MT4) based on Rainbow MT4 indicator, as you can see in the short video below is now available here .
FREE
Free automatic fibonacci
Tonny Obare
4.67 (49)
Free automatic Fibonacci is an indicator that automatically plots a Fibonacci retracement based on the number of bars you select on the BarsToScan setting in the indicator. The Fibonacci is automatically updated in real time as new highest and lowest values appears amongst the selected bars. You can select which level values to be displayed in the indicator settings. You can also select the color of the levels thus enabling the trader to be able to attach the indicator several times with differe
FREE
This scanner shows the trend values of the well known indicator SuperTrend for up to 30 instruments and 8 time frames. You can get alerts via MT4, Email and Push-Notification as soon as the direction of the trend changes. This is the FREE version of the indicator: SuperTrend Scanner The free version works only on EURUSD and GBPUSD! Important Information How you can maximize the potential of the scanner, please read here: www.mql5.com/en/blogs/post/718074 With the following FREE indicator you c
FREE
This indicator is a perfect tool able to compare which brokers have the lower latency. It shows us immediately which brokers are slower or faster. When you see the dot icon on the line, it means this broker is the faster one and the red line (Broker_A) is the slower one. See the example on the screenshot. How It Works? This indicator shares the prices information to and from the "shared" common data folder. It compares all the prices. The price is based on average by (Ask + Bid) / 2. There are
FREE
Didta
Mykhailo Zakervashevych
5 (1)
Indicator Description: DISH X Imbalance (DIDTA/DIDFA) 1. Overview The   DISH X Imbalance   indicator is a sophisticated volume-based technical analysis tool for MetaTrader 4 that analyzes market order flow imbalance to identify potential trend reversals and fair value deviations. The indicator calculates two core values:   DIDTA (Daily Imbalance Delta)   and   DIDFA (Daily Imbalance Delta Fair Value) , providing traders with insights into buying/selling pressure and market valuation. 2. Core Com
FREE
Lib4 EAPadPRO for MT4
Vladislav Andruschenko
5 (2)
Library to add the Information Panel to your Expert Advisor for MetaTrader 4. We can not guarantee that the information and interface of the program will give you a profit on deals, but we will definitely say that even the simplest interface of the program can strengthen the first impression. Detailed description and instructions for adding our panel to your Expert Advisor are in our blog: LIB - EAPADPRO Step-by-step instruction Detailed description of our panel and instructions for using EAPADP
FREE
Enhanced Volume Profile: The Ultimate Order Flow & Liquidity Analysis Tool Overview Enhanced Volume Profile   is an indicator for MetaTrader 5 that displays the traded volume at specific price levels over a defined period. It separates the total volume into buy and sell components, presenting them as a side-by-side histogram on the chart. This allows users to observe the volume distribution and the proportion of buy and sell volumes at each price level. Graphics Rendering The indicator uses t
FREE
Forex Market Profile and Vwap
Lorentzos Roussos
4.86 (7)
외환 시장 프로필(줄여서 FMP) 이것이 아닌 것 : FMP는 일반적인 문자 코드 TPO 표시가 아니며 전체 차트 데이터 프로필 계산을 표시하지 않으며 차트를 기간으로 분할하여 계산하지도 않습니다. 그것이 하는 일: 가장 중요한 것은 FMP 표시기가 사용자 정의 스펙트럼의 왼쪽 가장자리와 사용자 정의 스펙트럼의 오른쪽 가장자리 사이에 있는 데이터를 처리한다는 것입니다. 사용자는 마우스로 표시기의 양쪽 끝을 당기기만 하면 스펙트럼을 정의할 수 있습니다. 표시기 오른쪽 가장자리가 라이브 막대로 당겨지고 더 멀리(미래로) 표시되면 표시기가 "라이브"로 간주됩니다(새 막대로 업데이트됨). 표시기는 첨부된 차트에 "앵커" 개체를 놓은 다음 해당 앵커를 하드 드라이브의 파일과 연결합니다. 이렇게 하면 차트 또는 지표가 닫힐 때까지 다시 시작해도 설정이 유지되어 차트에서 계속 FMP를 실행할 수 있습니다. FMP 지표는 하나의 차트에서 여러 인스턴스를 실행할 수 있으며 이름을 지정할 수
FREE
Cumulative Delta MT4
Evgeny Shevtsov
4.86 (29)
The indicator analyzes the volume scale and splits it into two components - seller volumes and buyer volumes, and also calculates the delta and cumulative delta. The indicator does not flicker or redraw, its calculation and plotting are performed fairly quickly, while using the data from the smaller (relative to the current) periods. The indicator operation modes can be switched using the Mode input variable: Buy - display only the buyer volumes. Sell - display only the seller volumes. BuySell -
FREE
이 제품의 구매자들이 또한 구매함
Gann Made Easy
Oleg Rodin
4.83 (162)
Gann Made Easy 는 mr.의 이론을 사용하여 최고의 거래 원칙을 기반으로 하는 전문적이고 사용하기 쉬운 Forex 거래 시스템입니다. W.D. 간. 이 표시기는 Stop Loss 및 Take Profit Levels를 포함하여 정확한 BUY 및 SELL 신호를 제공합니다. PUSH 알림을 사용하여 이동 중에도 거래할 수 있습니다. 구매 후 거래 방법 안내 및 유용한 추가 지표를 무료로 받으시려면 저에게 연락주세요! 아마도 Gann 거래 방법에 대해 이미 여러 번 들었을 것입니다. 일반적으로 Gann의 이론은 초보자 거래자뿐만 아니라 이미 거래 경험이 있는 사람들에게도 매우 복잡한 것입니다. Gann의 거래 방식은 이론적으로 적용하기 쉽지 않기 때문입니다. 나는 그 지식을 연마하고 Forex 지표에 최고의 원칙을 적용하기 위해 몇 년을 보냈습니다. 표시기는 적용하기가 매우 쉽습니다. 차트에 첨부하고 간단한 거래 권장 사항을 따르기만 하면 됩니다. 지표는 지속적으로 시장 분석
M1 Sniper
Oleg Rodin
5 (22)
M1 SNIPER 는 사용하기 쉬운 거래 지표 시스템입니다. M1 시간대에 맞춰 설계된 화살표 지표입니다. 이 지표는 M1 시간대 스캘핑을 위한 단독 시스템으로 사용할 수 있으며, 기존 거래 시스템의 일부로도 사용할 수 있습니다. 이 거래 시스템은 M1 시간대 거래용으로 특별히 설계되었지만, 다른 시간대에도 사용할 수 있습니다. 원래는 XAUUSD와 BTCUSD 거래를 위해 이 방법을 설계했지만, 다른 시장 거래에도 유용하다는 것을 알게 되었습니다. 이 지표의 신호는 추세 방향과 반대로 거래될 수 있습니다. 저는 지표의 신호를 활용하여 양방향으로 거래할 수 있도록 돕는 특별한 거래 기법을 알려드립니다. 이 방법은 특별한 동적 지지선과 저항선 가격 영역을 활용하는 것을 기반으로 합니다. 구매하시면 M1 SNIPER 화살표 지표를 바로 다운로드하실 수 있습니다. 또한, 아래 스크린샷에 표시된 Apollo Dynamic SR 지표는 M1 SNIPER 도구를 사용하는 모든 사용자에게 무료로
Scalper Inside PRO
Alexey Minkov
4.74 (69)
Scalper Inside PRO – Since 2020. An exclusive indicator that utilizes an innovative algorithm to swiftly and accurately determine the market trend. The indicator automatically calculates opening, closing, and profit levels, providing detailed trading statistics. With these features, you can choose the most appropriate trading instrument for the current market conditions. Additionally, you can easily integrate your own arrow indicators into Scalper Inside Pro to quickly evaluate their statistics
PRO Renko System
Oleg Rodin
5 (30)
PRO Renko System 은 RENKO 차트 거래를 위해 특별히 고안된 매우 정확한 거래 시스템입니다. 이것은 다양한 거래 상품에 적용될 수있는 보편적 인 시스템입니다. 체계는 효과적으로 당신에게 정확한 반전 신호에 접근을 주는 소위 시장 소음을 중화합니다. 이 표시기는 사용하기가 매우 쉽고 신호 생성을 담당하는 매개 변수가 하나만 있습니다. 당신은 쉽게 당신의 선택의 어떤 무역 계기에 공구를 적응시킬 수 있고 renko 막대기의 크기. 나는 항상 당신이 내 소프트웨어로 수익성있게 거래 할 수 있도록 추가 지원을 제공 할 준비가되어 있습니다! 나는 당신에게 행복하고 수익성있는 거래를 기원합니다! 구매 후 저에게 연락하십시오! 내 렌코 차트 생성기를 보내드립니다. 또한 내 개인 권장 사항 및 시스템의 다른 모듈을 무료로 공유 할 것입니다!
Auto Optimized Parabolic RSI: 고급 3D 모멘텀 엔진 대부분의 개인 투자자용 보조지표는 시장의 변동성이 변하는 순간 무용지물이 되는 정적인 입력값에 의존하기 때문에 실패합니다. Auto Optimized Parabolic RSI는 자체적인 수학적 우위를 지속적으로 재계산하여 "보조지표 노후화" 문제를 해결하며, 기관급 퀀트 트레이딩의 적응력을 귀하의 MT5 터미널에 직접 제공합니다. 핵심 이점: 맞춤형 인메모리 3D 최적화   표준 자동 최적화 도구들은 일반적인 보조지표 호출로 터미널에 과부하를 일으켜 MT5 플랫폼을 멈추게 하는 경우가 많습니다. 이 도구는 이러한 병목 현상을 완전히 우회합니다. 맞춤형 네이티브 RAM 기반 계산기로 구축된 내부 엔진은 차트를 로드하거나 타임프레임을 변경할 때마다 빛처럼 빠른 3D 그리드 검색을 실행합니다. RSI 기간(주기), SAR 스텝(가속도) 및 SAR 최대치(속도 제한)를 동시에 스캔하여 플랫폼 지연 없이 수만 개의
Quantum Breakout Indicator PRO
Bogdan Ion Puscasu
4.96 (26)
소개       Quantum Breakout PRO   , 브레이크아웃 존 거래 방식을 변화시키는 획기적인 MQL5 지표! 13년 이상의 거래 경험을 가진 숙련된 트레이더 팀이 개발한   Quantum Breakout PRO는   혁신적이고 역동적인 브레이크아웃 영역 전략으로 거래 여정을 새로운 차원으로 끌어올리도록 설계되었습니다. Quantum Breakout Indicator는 5개의 이익 목표 영역이 있는 브레이크아웃 영역의 신호 화살표와 브레이크아웃 상자를 기반으로 한 손절 제안을 제공합니다. 초보자 거래자와 전문 거래자 모두에게 적합합니다. Quantum EA 채널:       여기를 클릭하세요 MT5 버전 :   여기를 클릭하세요 중요한! 구매 후 설치 매뉴얼을 받으려면 개인 메시지를 보내주십시오. 추천: 기간: M15 통화쌍: GBPJPY, EURJPY, USDJPY,NZDUSD, XAUUSD 계정 유형: 스프레드가 매우 낮은 ECN, Raw 또는 Razo
Market Makers
Mohamed Hassan
5 (4)
After purchase, contact me privately to receive 1 month of free testing with EA Forex Proton! This advanced MT4 trading robot automatically executes signals from any MT4 indicator, including Market Makers. The latest version also includes AI integration, allowing each trade signal to be analyzed using Artificial Intelligence. Live Signal with EA Forex Proton: Click here Market Makers is a powerful price action trading system designed to identify high-probability Buy and Sell opportunities based
Apex Edge No Repaint MT4용 전문가용 리페인팅 없는 트레이딩 지표 Apex Edge No Repaint는 화살표 리페인팅 현상 없이 명확한 신호를 원하는 진지한 외환 및 암호화폐 트레이더를 위해 설계된 프리미엄급의 깔끔하고 신뢰할 수 있는 트레이딩 도구입니다. 주요 기능: 100% 리페인트 없음 – 신호는 차트에 나타난 후 고정됩니다. 듀얼 신호 시스템: 초기 기회를 위한 RAW 신호와 높은 확률의 확정 진입을 위한 CONF 신호 간편한 원클릭 토글 버튼: RAW 켜기/끄기 및 CONF 켜기/끄기 추세, 강도 백분율 및 신호 상태를 표시하는 전문적인 실시간 대시보드 즉시 알림: 팝업, 소리 및 이메일 알림 모든 CONF 신호에 TP1, TP2 및 손절매 레벨 자동 표시 즉시 시각적 명확성을 위한 깔끔한 색상 코드 화살표: 연두색 → CONF 매수 빨간색 → CONF 매도 청록색 → RAW 매수 자홍색 → RAW 매도 모든 시간대 및 모든 종목에서 작동 장점:
이 지표를 구매하면 제 프로페셔널 트레이드 매니저를 무료로 드립니다. 우선 이 거래 시스템이 리페인팅, 리드로잉 및 레이그 인디케이터가 아니라는 점을 강조하는 것이 중요합니다. 이는 수동 및 로봇 거래 모두에 이상적인 것으로 만듭니다. 온라인 강좌, 설명서 및 프리셋 다운로드. "스마트 트렌드 트레이딩 시스템 MT5"은 새로운 및 경험이 풍부한 트레이더를 위해 맞춤형으로 제작된 종합적인 거래 솔루션입니다. 10개 이상의 프리미엄 인디케이터를 결합하고 7개 이상의 견고한 거래 전략을 특징으로 하여 다양한 시장 조건에 대한 다목적 선택이 가능합니다. 트렌드 추종 전략: 효과적인 트렌드 추이를 타기 위한 정확한 진입 및 손절 관리를 제공합니다. 반전 전략: 잠재적인 트렌드 반전을 식별하여 트레이더가 범위 시장을 활용할 수 있게 합니다. 스캘핑 전략: 빠르고 정확한 데이 트레이딩 및 단기 거래를 위해 설계되었습니다. 안정성: 모든 인디케이터가 리페인팅, 리드로잉 및 레이그가 아니므로 신뢰
이 인디케이터는 엘리어트 파동 이론과 두 가지 방식으로 작동합니다: 자동 작동: 이 모드에서는 인디케이터가 엘리어트 파동 이론에 따라 차트 상의 모든 5개의 모티브 웨이브를 자동으로 감지하고 예측 및 잠재적인 반전 지역을 제공합니다. 또한 중요한 개발 사항을 트레이더에게 알릴 수 있는 경보 및 푸시 메시지를 생성할 수 있는 능력을 갖추고 있습니다. 이 자동 기능은 엘리어트 파동 패턴의 식별과 분석 프로세스를 간소화합니다. 수동 작동: 이 옵션은 엘리어트 파동 이론을 수동으로 다루고 싶은 트레이더를 위해 설계되었습니다. 이를 통해 사용자는 아홉 가지 다른 등급을 사용하여 웨이브를 그릴 수 있습니다. 각 등급은 나타난 후에 차트에 그려진 라인을 조정하여 개별적으로 정의할 수 있습니다. 이 기능은 웨이브를 수동으로 그리는 프로세스를 간소화하며 더 효율적으로 만들어 줍니다. 중요한 점으로 모든 그림 데이터가 미래 참조를 위해 플랫폼 데이터 폴더에 저장된다는 것을 기억해야 합니다. 파라미터:
PZ Harmonacci Patterns
PZ TRADING SLU
3.17 (6)
Trade smarter, not harder: Empower your trading with Harmonacci Patterns This is arguably the most complete harmonic price formation auto-recognition indicator you can find for the MetaTrader Platform. It detects 19 different patterns, takes fibonacci projections as seriously as you do, displays the Potential Reversal Zone (PRZ) and finds suitable stop-loss and take-profit levels. [ Installation Guide | Update Guide | Troubleshooting | FAQ | All Products  ] It detects 19 different harmonic pric
Please send me Direct message on MQL5 CHAT after purchasing the Indicator for Training and Installation Support There are some additional files that is important to use with the Indicator . So be sure to contact me after purchasing the Indicator So that I can add you for training and support . If you find any difficulty with installation then send me Direct message here So that I can connect with you via Anydesk or Teamview for the product installation. " Smart Order Block Indicator " to find m
GoldRush Trend Arrow Signal
Kirk Lee Holloway
5 (2)
GoldRush 트렌드 화살표 신호 GoldRush 트렌드 화살표 신호 지표는 XAU/USD 시장에서 고속 단기 스캘핑 트레이더를 위해 설계된 정밀한 실시간 트렌드 분석을 제공합니다. 1분 시간대에 특화되어 설계된 이 도구는 명확한 진입점을 표시하는 방향성 화살표를 제공하여 스캘퍼들이 변동성이 높은 시장 환경에서도 자신 있게 거래할 수 있도록 합니다. 이 지표는 PRIMARY 및 SECONDARY 경고 화살표로 구성됩니다. PRIMARY 신호는 추세 방향의 변화를 나타내는 흰색과 검은색 방향성 화살표이며, SECONDARY 신호는 PRIMARY 화살표가 지시하는 방향을 확인하고 잠재적인 거래 진입점을 표시하는 파란색과 빨간색 화살표입니다. 참고: 추세 방향이 변경된 후 PRIMARY 경고 화살표가 단 하나만 표시될 경우, 다수의 SECONDARY 파란색/빨간색 화살표가 표시될 수 있음을 유의해야 합니다. SECONDARY 신호는 신호 기준을 충족하는 어떤 캔들 이후에도 표시
Dynamic Scalper System
Vitalyi Belyh
5 (1)
" Dynamic Scalper System " 지표는 추세 파동 내에서 스캘핑 방식으로 거래하도록 설계되었습니다. 주요 통화쌍 및 금에서 테스트되었으며, 다른 거래 상품과의 호환성이 가능합니다. 추가적인 가격 변동 지원을 통해 추세에 따라 단기 포지션 진입 신호를 제공합니다. 지표의 원리 큰 화살표는 추세 방향을 결정합니다. 작은 화살표 형태의 스캘핑 신호를 생성하는 알고리즘은 추세 파동 내에서 작동합니다. 빨간색 화살표는 상승 방향을, 파란색 화살표는 하락 방향을 나타냅니다. 민감한 가격 변동선은 추세 방향으로 그려지며, 작은 화살표의 신호와 함께 작용합니다. 신호는 다음과 같이 작동합니다. 적절한 시점에 선이 나타나면 진입 신호가 형성되고, 선이 있는 동안 미결제 포지션을 유지하며, 완료되면 거래를 종료합니다. 권장되는 작업 시간대는 M1~H4입니다. 화살표는 현재 캔들에 형성되며, 다음 캔들이 이미 시작되었더라도 이전 캔들의 화살표는 다시 그려지지 않습니다. 입력 매개
PZ Trend Trading
PZ TRADING SLU
4.8 (5)
Capture every opportunity: your go-to indicator for profitable trend trading Trend Trading is an indicator designed to profit as much as possible from trends taking place in the market, by timing pullbacks and breakouts. It finds trading opportunities by analyzing what the price is doing during established trends. [ Installation Guide | Update Guide | Troubleshooting | FAQ | All Products ] Trade financial markets with confidence and efficiency Profit from established trends without getting whips
GOLD Impulse with Alert
Bernhard Schweigert
4.67 (12)
이 지표는 Advanced Currency IMPULSE with ALERT  +   Currency Strength Exotics  의 2가지 제품의 슈퍼 조합입니다. 그것은 모든 시간 프레임에 대해 작동하며 8개의 주요 통화와 하나의 기호에 대한 강약의 충동을 그래픽으로 보여줍니다! 이 표시기는 금, 이국적인 쌍, 상품, 지수 또는 선물과 같은 기호에 대한 통화 강도 가속을 표시하는 데 특화되어 있습니다. 금, 은, 오일, DAX, US30, MXN, TRY, CNH 등의 진정한 통화 강도 가속(충동 또는 속도)을 표시하기 위해 9번째 줄에 모든 기호를 추가할 수 있습니다. 새로운 기본 알고리즘을 기반으로 구축되어 잠재적인 거래를 훨씬 더 쉽게 식별하고 확인할 수 있습니다. 이는 통화의 강세 또는 약세가 가속되는지 여부를 그래픽으로 표시하고 가속 속도를 측정하기 때문입니다. 자동차의 속도계처럼 생각하면 됩니다. 가속화할 때 Forex 시장에서 동일한 일이 분명히 더 빠르
Advanced Supply Demand
Bernhard Schweigert
4.91 (300)
현재 40% 할인! 초보자나 전문 트레이더를 위한 최고의 솔루션! 이 보조지표는 우리가 다수의 독창적 기능과 새로운 공식을 통합한 독특하고 고품질이며 저렴한 거래 도구입니다. 이 업데이트를 통해 이중 시간대를 표시할 수 있습니다. 더 높은 TF를 표시할 수 있을 뿐만 아니라 차트 TF와 더 높은 TF 모두를 표시할 수 있습니다: 중첩 영역 표시. 모든 Supply Demand 트레이더들이 좋아할 것입니다. :) 중요한 정보 공개 Advanced Supply Demand의 잠재력을 극대화하려면 다음을 방문하십시오. https://www.mql5.com/ko/blogs/post/720245   진입 또는 목표의 명확한 트리거 포인트를 정확히 찾아냄으로 해서 거래가 어떻게 개선될지 상상해 보십시오. 새로운 알고리즘을 기반으로 매수자와 매도자 간의 잠재적인 불균형을 훨씬 더 쉽게 분간할 수 있습니다. 왜냐하면 가장 강한 공급영역과 가장 강한 수요 영역과 과거에 어떻게 진행 되었는지를(이전
Gold Scalper Super
Aleksandr Makarov
5 (2)
Gold Scalper Super is an easy-to-use trading system. The indicator can be used as a standalone scalping system on the M1 time frame, as well as part of your existing trading system. Bonus: when purchasing an indicator, Trend Arrow Super is provided free of charge, write to us after purchase. The indicator 100% does not repaint!!! If a signal appears, it does not disappear! Unlike indicators with redrawing, which lead to the loss of a deposit, because they can show a signal and then remove it.
CRT Candle Range Theory HTF MT4.   Ultimate CRT Indicator: Advanced ICT Concepts and Malaysian SnR Trading System Discounted   Price   $50  !!     Secure your lifetime access   now   before it switches to   subscription-only ! Master the Market Maker's Footprints with the Most Advanced Candle Range Theory Indicator Unlock the true power of   Smart Money Concepts (SMC)   and trade precisely like the institutions with the   Ultimate CRT Indicator . Built exclusively for serious traders, this indic
PZ Turning Points MT4
PZ TRADING SLU
1 (1)
Identify key turning points with reliable fractal analysis This indicator examines the price structure of fractals of different periods to determine possible reversal points in the market, providing timing to positional traders that already have a fundamental or technical valuation model. Unlike its younger brother, Reversal Fractals , this indicator won't miss reversals because of the period selected, and will find reversal fractals on a zig-zag fashion, ignoring those reversals which do not
PZ Support Resistance
PZ TRADING SLU
3.33 (3)
Unlock key market insights with automated support and resistance lines Tired of plotting support and resistance lines? This is a multi-timeframe indicator that detects and plots supports and resistance lines in the chart with the same precision as a human eye would. As price levels are tested over time and its importance increases, the lines become thicker and darker, making price leves easy to glance and evaluate. [ Installation Guide | Update Guide | Troubleshooting | FAQ | All Products ] Boos
Apex Break PRO MT4
Kestutis Balciunas
Apex Break PRO는 MetaTrader 4용 비재도색 피봇 추세선 돌파 지표입니다. 피봇 고점과 피봇 저점을 감지하고, 연속 피봇 사이에 동적 경사 추세선을 그리며, 확정된 봉 마감 시 가격이 해당 추세선을 돌파할 때 매수 및 매도 신호를 생성합니다. 모든 신호는 최대 4개의 독립적인 컨플루언스 레이어——EMA 추세, RSI 경계값, 거래량 급증 감지, ADX 추세 강도——를 통해 필터링되며, 트레이더가 몇 가지 조건이 일치했는지 즉시 확인할 수 있도록 스타 평가 시스템으로 등급이 매겨집니다. ATR 기반 손절매와 3개의 이익실현 레벨이 각 신호에 대한 체계적인 리스크 관리를 제공하며, 실시간 대시보드는 방향, 필터 상태, 도달 체크 표시가 포함된 거래 레벨 추적을 표시합니다. MT5 버전 확인:  Apex Break PRO MT5 더 많은 제품 보기:   전체 제 품 목록 실시간 예제와 새로운 도구를 확인하려면 프로필을 방문하여 업데이트를 놓치지 않도록 친구 요청을 보내세
They say history repeats itself. What if you could prove it in real-time? The Propfolio Ghost Pattern is an advanced algorithmic pattern-matching engine. It empowers you to select any current price action structure on your chart and instantly scan thousands of historical candles to find the exact moment in the past where the market did the exact same thing. Once it finds the highest probability match, it projects the historical outcome into the future as "Ghost Candles"—giving you a highly calcu
현재 26% 할인!! 이 지표는 두 주요 지표( Advanced Currency Strength 28   &  Advanced Currency IMPULSE with ALERT )의 슈퍼 조합입니다. TICK-UNITS에 대한 통화 강도 값과 28개 Forex 쌍에 대한 경고 신호를 보여줍니다. 11개의 다른 틱 단위를 사용할 수 있습니다. 1, 2, 3, 4, 5, 6, 10, 12, 15, 20, 30초입니다. 두 번째 타이머 내에 최소 1틱이 있으면 하위 창의 Tick-Unit 막대가 표시되고 왼쪽으로 이동합니다. 단 하나의 차트로 28 Forex 페어를 스캘핑할 수 있습니다! 스캘핑 기회의 정확한 트리거 포인트를 정확히 찾아낼 수 있기 때문에 스캘핑이 어떻게 개선될지 상상해 보십시오. 그것은 1분보다 낮은 기간에 작동하는 시장의 첫 번째 통화 강도 지표입니다! 그것은 시장에 빠르게 들어오고 나가고 시장에서 작은 핍을 잘라내기를 원하는 빠른 스캘퍼를 위한 것입니다. 사
Atomic Analyst
Issam Kassas
5 (5)
우선적으로 언급할 점은이 거래 지표가 다시 그리지 않고 지연되지 않으며 이를 통해 수동 및 로봇 거래 모두에 이상적이라는 점입니다. 사용자 매뉴얼: 설정, 입력 및 전략. Atomic Analyst는 가격의 강도와 모멘텀을 활용하여 시장에서 더 나은 이점을 찾는 PA Price Action Indicator입니다. 고급 필터를 장착하여 잡음과 거짓 신호를 제거하고 거래 잠재력을 높이는 데 도움이 됩니다. 복잡한 지표의 다중 레이어를 사용하여 Atomic Analyst는 차트를 스캔하고 복잡한 수학적 계산을 간단한 신호와 색상으로 변환하여 초보 트레이더가 이해하고 일관된 거래 결정을 내릴 수 있도록합니다. "Atomic Analyst"는 새로운 및 경험이 풍부한 트레이더를위한 종합적인 거래 솔루션입니다. 프리미엄 지표와 최고 수준의 기능을 하나의 거래 전략에 결합하여 모든 종류의 트레이더에 대한 다재다능한 선택지가되었습니다. 인트라데이 거래 및 스캘핑 전략 : 빠르고 정확한 일일
구매 후 저에게 연락하여 이 지표를 기반으로 한 보너스 EA를 받으십시오. Self Optimizing Double MA Strategy는 파라미터 추측을 없애기 위해 설계된 전문가 수준의 트레이딩 도구입니다. 내장된 자동 최적화 엔진으로 구동되며, 통계적 우위를 유지하기 위해 백그라운드에서 수천 개의 파라미터 조합을 시뮬레이션하여 변화하는 시장 조건에 지속적으로 적응합니다. 정적이고 구식인 설정에 의존하는 대신, 이 인디케이터는 자체 로직을 동적으로 업데이트하여 현재 시간대와 종목에 가장 수익성 있는 구성을 찾습니다. 주요 기능 내장된 자동 최적화: 시스템은 단기 MA, 장기 MA 및 RSI 기간을 주기적으로 다시 계산하여, 선택한 업데이트 빈도에 따라 설정이 항상 현재 시장 리듬과 일치하도록 보장합니다. MA 다이버전스 필터: 이동평균선이 활발하게 발산(확장)할 때만 시그널을 검증하는 핵심 추세 강도 지표입니다. 이는 평균선이 수렴하거나 평탄한 횡보장에서는 잘못된 진입을 방지합
Advanced Currency Strength28 Indicator
Bernhard Schweigert
4.91 (657)
현재 40% 할인 초보자 또는 전문가 트레이더를 위한 최고의 솔루션! 이 지표는 우리가 독점 기능과 새로운 공식을 통합했기 때문에 독특하고 고품질이며 저렴한 거래 도구입니다. 단 하나의 차트로 28 Forex 쌍의 통화 강도를 읽을 수 있습니다! 새로운 추세 또는 스캘핑 기회의 정확한 트리거 포인트를 정확히 찾아낼 수 있기 때문에 거래가 어떻게 개선될지 상상해 보십시오. 사용 설명서: 여기를 클릭  https://www.mql5.com/en/blogs/post/697384 그것이 첫 번째, 원본입니다! 쓸모없는 지망생 클론을 사지 마십시오. 더 스페셜  강력한 통화 모멘텀을 보여주는 하위 창의 화살표 GAP가 거래를 안내합니다! 기본 또는 호가 통화가 과매도/과매도 영역(외부 시장 피보나치 수준)에 있을 때 개별 차트의 기본 창에 경고 표시가 나타납니다. 통화 강도가 외부 범위에서 떨어질 때 풀백/반전 경고. 교차 패턴의 특별 경고 추세를 빠르게 볼 수 있는 다중 시간
Cyclic Impulse
Vitalyi Belyh
차트를 구조화하고 주기적인 가격 변동을 식별하는 기술 지표입니다. 모든 차트에서 작업할 수 있습니다. 다양한 유형의 알림. 그래프 자체에도 추가 화살표가 있습니다. 역사를 재구성하지 않고, 촛불을 닫는 작업에 임한다. M5 이상에서 권장되는 TF입니다. 사용 및 구성이 쉬운 매개변수입니다. 매개변수가 다른 2개의 지표를 사용하는 경우, 다른 지표 없이 해당 지표만 사용할 수 있습니다. 2개의 입력 매개변수가 있습니다 주기성과 신호 지속 시간 이 2개의 매개변수는 차트 구조의 처리와 관련이 있습니다. Cyclicity - 역전 주기가 얼마나 자주 바뀌는지 조절하고 주기를 매끄럽게 합니다. Signal duration - 최소 숫자에서는 가격 움직임의 충격을 감지하고, 최대 숫자에서는 장기적 추세 움직임을 감지합니다.. --------------------------------
KuKl
IGOR KIRIANEN
The indicator is built on a non-standard Zig Zag, it draws accumulations after which if the price leaves this zone and a test of this zone occurs, then a sound signal is given and an arrow appears - after the test candle closes.The indicator does not redraw its signals, it is very easy to use, there are only three settings 1- this is the zig zag parameter 2- this is the minimum price exit from the zone 3- this is the maximum price exit from the zone. The lower the parameter for Zig Zag, the more
Day Trader Master
Oleg Rodin
5 (15)
Day Trader Master 는 데이 트레이더를 위한 완벽한 거래 시스템입니다. 시스템은 두 개의 지표로 구성됩니다. 하나의 지표는 매수 및 매도를 위한 화살표 신호입니다. 얻을 수 있는 화살표 표시기입니다. 2차 지표를 무료로 드립니다. 두 번째 지표는 이러한 화살표와 함께 사용하도록 특별히 설계된 추세 지표입니다. 표시기는 반복하지 않고 늦지 않습니다! 이 시스템을 사용하는 것은 매우 간단합니다. 2색 선으로 표시되는 현재 추세 방향의 화살표 신호를 따라가기만 하면 됩니다. 파란색은 구매 추세입니다. 빨간색은 판매 추세입니다. 파란색 화살표는 매수 신호입니다. 빨간색 화살표는 매도 신호입니다. 추세선의 색상과 일치하려면 화살표의 색상과 신호의 방향이 필요합니다. 화살표 표시기는 주로 시간 간격 M5 및 M15에서 일중 거래를 위해 만들어졌습니다. 그러나 기술적으로 시스템은 다른 시간 간격으로 사용할 수 있습니다. 표시기에는 PUSH 메시지 기능이 있는 팝업 경고가 장착되어 있
제작자의 제품 더 보기
Trendorphin Z
Abraham Correa
4 trendlines are given by 2 timeframes, defined by the zigzag indicator. It leverages the Zig Zag indicator to identify significant highs and lows across two configurable timeframes (default: M15 for short-term and H1 for medium-term), automatically plotting upward and downward trendlines for each. This helps visualize trend structures, reversals, and alignments between timeframes without switching charts, while adhering to trendline rules that contain the high and low points of the previous two
FREE
Grid MATR
Abraham Correa
X-axis lines prevail in grid manner, ruled by Average True Range.  There’s an inevitable change in specific periods of time of this matter! The Average True Range (ATR) indicator is not directly based on volume; instead, measures volatility in price movements. This indicator original in its revealing customization, stretches, expand, shrink, and evolve with 4 timely choices of grid states!  MATR means “multiplying average true range” in which grandeurs the grid pip-distant levels, seeming to g
FREE
Vispucci
Abraham Correa
Behaving in a similar fashion as the price action of a chart, the indicator uses " Trix " to opportune itself to the exposure of divergency, flat/low market volume, and price action expansion . The TRIX indicator nicknamed after the  Triple-Exponential-average,  is a momentum-based oscillator that filters minor price changes and fluctuations that are considered insignificant for forex trading whilst providing money making opportunities!  Overall, TRIX is a leading indicator that shows diverge
FREE
Candlestick MATR
Abraham Correa
Analyze volatility by clicking on a specific candlestick, which triggers the display of horizontal grid lines centered around the candlestick’s closing price, spaced by multiples of the calculated ATR. A vertical line highlights the selected candlestick, and an optional text label can display the ATR value in pips above the candlestick. The indicator is lightweight, using no buffers, and relies on chart objects for visualization. It includes error handling for invalid candlestick selections and
FREE
BirdsIview
Abraham Correa
is a user-friendly MetaTrader 4 indicator that creates a centralized dashboard for traders to oversee several cryptocurrency pairs simultaneously across different timeframes, presenting price movements through simple dots or miniature candlestick charts, complemented by volume indicators to facilitate quick assessments of market trends and fluctuations. It automatically resizes grid cells according to the number of bars shown per timeframe for better use of screen space, features adjustable co
FREE
Symbol Cycler
Abraham Correa
Symbol Cycler is a lightweight on-chart utility that lets you quickly switch between symbols in your Market Watch list using two simple arrow buttons (). With a single click, you can scroll forward or backward through your predefined symbols without leaving the chart. Key Features: One-click symbol switching from the chart Works with your Market Watch list order Buttons can be placed in any chart corner or even the center Timeframe remains locked while switching symbols Clean, responsive UI
FREE
Bigger chart labels would allow the user to be entirely aware of which chart he/she is on. Each chart window is unique, containing different patterns and economic motives so acknowledging the chart window would be absolutely essential! There are well known Economic Time Zones included in clear view, by choice!    Simple does it! Use your computing mouse scroller, clicking with the right finger on the label, in order to customize the label properties. From there, choose your preferred color, fon
FREE
변동성에 적응,거래 위치를 보상 할 수있는 잠재적 인 위험은 평균 실제 범위에 따라 표시됩니다. 위험 보상-'구매 또는 판매'버튼을 클릭하면 상자가 표시됩니다! 아트리움 계산의 유틸리티,거래를 종료 할 때 어려운 결정의 일부가 아닌 문제로 기뻐. 이 문제는 위험 관리 결정에 도움이 될 것입니다.  사양: 평균 진정한 범위는 핍 또는 가격에 시장의 변동성을 측정하는 일반적으로 사용되는 지표입니다. 진정한 범위는 가장 낮은 거래 가격과 촛대의 가장 높은 거래 가격의 차이입니다,주어진 기간에. 평균 실제 범위는 모두"이전"기간의 이러한 최고치와 최저치를 평균화합니다. 예를 들어,기본 설정은 우리에게 14 일 기간을 제공합니다. 14 일로 나눈 핍 값에서 최고치와 최저치를 수집합니다. 그러나 물론 이것은 일반적인 지표를 넘어서는 것입니다. 문제 사실,세 가지 완전히 다른 주가는 전적으로 다른 핍 소비를 위해 자신의 시간대에 의존합니다. 촛대의 규칙은 각 기간에 기술적으로 다르다. 그래
FREE
StainGlass MATR
Abraham Correa
Its primary motive is to overlay horizontal lines spaced according to multiples of the Average True Range (ATR), centered on a reference price from defined periods such as trading sessions, candlestick counts, or 12-hour intervals. This facilitates the identification of potential support and resistance levels or expected price ranges. Additionally, it marks major forex trading sessions (Sydney, Tokyo, London, and New York) with arrows to provide contextual awareness of market hours, enhancing d
FREE
Predetermination
Abraham Correa
5 (1)
Trail every trade position twice, automatically,  in Average True Range! All manual trades are given a predetermined Risk-Reward closing point, ruled by a calculated motive that'll adjusts to volatility! The ATR, or average true range, is a technical indicator that measures the volatility, also known as " Volume , " of a financial instrument by taking into account the price range over a specific period of time.    There is an inevitable change in the ATR value during price action. The Average
FREE
is designed to enhance the visual representation of financial charts in MetaTrader 4 by dynamically altering the colors of various chart elements, including candlesticks, bars, line charts, and volume bars. Its primary purpose is to improve trader intuition and engagement during market analysis by introducing smooth, cyclical color transitions that can highlight momentum shifts, trends, or volatility without overwhelming the display. This functionality is particularly beneficial for traders who
FREE
It computes BUY and SELL lot sizing in either % of balance or in fixed intervals. In market orders, this EA contains the adaptive slippage, logs tickets for instant confirmation of opening trades, and contains every market symbol at a glance. Real-time balance/equity display keeps margin health in view without tab-switching, toggling spread if needed for liquidity checks. Compact left-panel layout minimizes screen real estate, empowering blind trades where speed trumps overanalyze—perfect for
FREE
An on‑chart, data‑driven pre‑trade planner that turns your broker’s live market properties into clear, actionable numbers. It consolidates spread, commission, swaps, ATR‑based stop/targets, pip/point value and 10 risk‑profile lot sizes into one compact panel that auto‑scales to any chart size. The display is direction‑agnostic (no LONG/SHORT duplication) and emphasizes total trade cost and true risk/reward before you click “Buy/Sell.” What it shows (at a glance) Time & price context  (Local/Serv
FREE
The Average True Spread Indicator is designed to visually display the average spread (difference between Ask and Bid prices) over a specified number of candles and timeframe, directly on the chart. Its primary purpose is to give traders real-time insight into how volatile or expensive the market is to enter , especially during fast-moving or low-liquidity periods. Benefits of Knowing the Average Spread Better Entry Timing Avoid trading when spreads are abnormally high (e.g., during news event
FREE
Shutdown
Abraham Correa
Ever needed to declutter your entire POV of the platform? Have the choice to delete ever chart window! When attaching this script, permission is required to close every chart window, no matter the symbol, timeframe, or amount of indications or EA's, ACTIVE. The autonomy of nullifying every chart and to be on the gray screen, happens with this script, essentially. I could go ahead and tell you, the Market Watch List of Symbols has always remained opportune to the traders of the internet, so car
FREE
The SyncAllCharts indicator streamlines trading by automatically aligning all open MetaTrader 4 charts to the symbol of the chart where it’s applied, saving traders time and effort when analyzing a single asset across multiple timeframes or setups. With a customizable "Main Sync" label to identify the lead chart, it ensures a clear, clutter-free workspace, enhancing workflow efficiency and consistency for traders monitoring one currency pair or symbol.
FREE
Labels
Abraham Correa
Prints  ALL current chart's symbol and timeframe as customizable labels, ensuring precise anchoring and automatic repositioning during window resizes, timeframe switches, or other chart events. It supports layered display options (background, forefront, or combined color modes) for enhanced visibility without obstructing price data. The accompanying script facilitates global application by attaching or updating the indicator across all open charts in a single execution, promoting efficiency in m
FREE
The SymbolicTimeFramingUniverse indicator for MetaTrader 4 (MT4) is designed to enhance chart navigation by displaying the current symbol and timeframe as stacked labels directly on the chart window. It provides precise alignment and customization options, including positioning in the center or corners, adjustable offsets, font styling, and layer controls for visibility (such as background placement or color flashing). This tool supports professional trading workflows by ensuring quick identific
FREE
Designed to revolutionize trading efficiency, this app enables traders to seamlessly cycle through Market Watch symbols using intuitive keyboard arrow keys or dynamically positioned on-chart buttons, minimizing navigation time and enhancing focus on market analysis. Potential : This lightweight MetaTrader 4 tool unlocks rapid symbol switching for comparative analysis across assets, supports wrap-around navigation for uninterrupted workflows, and adapts button placement to stay within chart
FREE
Activation initiates the sequence from the initial symbol in the Market Watch roster, forming a perpetual loop that continues until deactivation. The system employs global terminal variables to sustain operational continuity amid symbol-induced reinitializations, thereby ensuring uninterrupted performance. This EA should not be checked off as 'Allowed live Trading' and is functional with that checkmark box, when uploading the EA. Principal advantages encompass augmented productivity in overseein
FREE
This script paces itself to zoom into the deepest setting of ZOOM +     You may be in tune to know a few keyboard easter eggs. Pressing the  minus <->  button has the capability to Zoom the Chart Outward! Interesting to see the price reevaluate itself in perspective. This we could see is quite contagiously useful if we wanted to be quick with analyzing, examining through your tools, in your plans and such. So, if you ever wanted to zoom IN and OUT, here is Your play around with the chart poin
FREE
A versatile on-chart tool displaying real-time ATR values across up to 10 timeframes (M1 to MN1) in numerical format, bypassing subwindow charts for cleaner analysis. Key features: Toggle per-timeframe visibility, decimal/pips mode, customizable multiplier (e.g., for scaled stops), font/size/color adjustments, and corner/center positioning. Ideal for volatility-based trading—compute position sizes or filters instantly without manual math. Free download; compatible with MT4 Build 600+. Enhances m
필터:
리뷰 없음
리뷰 답변