SupertrendOscillation
- 지표
- 버전: 1.10

Supertrend Oscillation — Multi-Sensitivity SuperTrend Consensus Oscillator for MetaTrader 5
Overview
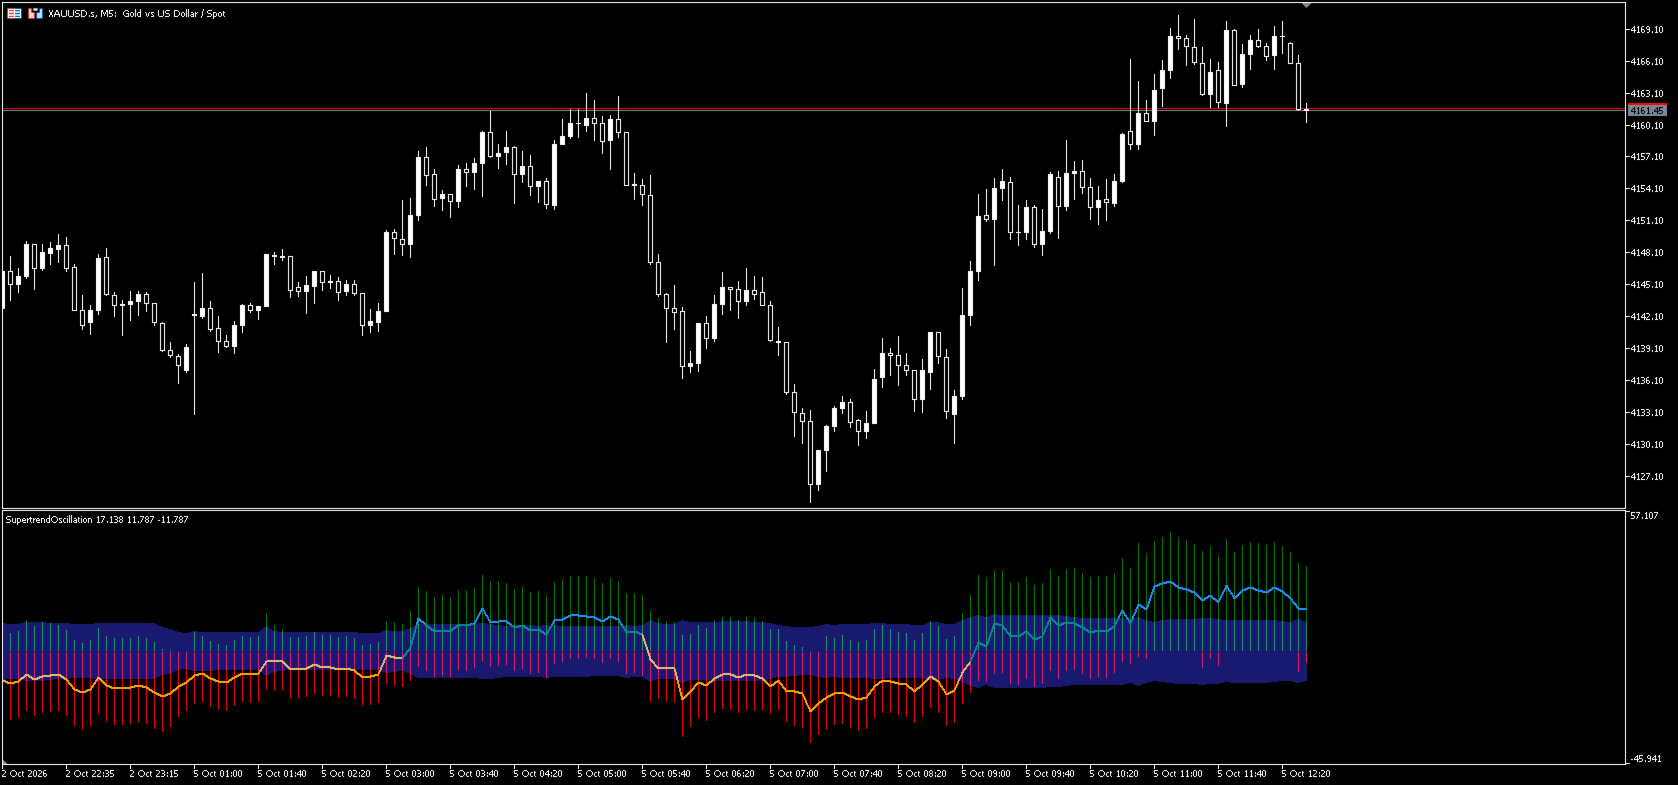
Supertrend Oscillation takes the familiar SuperTrend idea and turns it into a breadth indicator. Instead of running one SuperTrend with one ATR multiplier, it runs a whole family of them at the same time — 20 instances, each with a different sensitivity — and plots, for every bar, how far the closing price stands above or below each resulting band.
The result is drawn in a separate window and answers a question a single SuperTrend cannot: is the move broad enough that slow and fast sensitivities agree, or is it only visible to the fastest settings?
The window contains three elements:
- Mesh — 20 histogram columns, one per sensitivity. Columns above zero are drawn in the up color, columns below zero in the down color. The leftmost instance is the most sensitive, the rightmost the least sensitive.
- Median — the median of the 20 values, drawn as a line. It changes color depending on whether it is above or below its reference threshold.
- Stdev Area — a filled band of ±1 standard deviation around the zero line, showing how much the 20 sensitivities disagree with each other.
What it measures
For each of the 20 sensitivities the indicator compares the closing price with the active SuperTrend band of that instance. The difference is positive when price is above the band and negative when price is below it. Because the ATR multiplier grows from instance to instance, the first instances react quickly to price changes while the later ones only react to larger moves.
Reading all 20 differences side by side separates two situations that look identical on a single SuperTrend:
- a directional move that is strong enough to move every sensitivity at once;
- a short-lived spike that only the fast instances notice, while the slow ones stay where they were.
How to read the window
- Most columns on the same side of zero — the sensitivities agree. The move is visible across the whole range from fast to slow settings.
- Columns split between both sides — part of the family is above its band and part is below. This is typical of ranging conditions and of the transition phase around a change of direction.
- Median crossing its threshold — the point where the middle of the family switches side. The line color changes at that moment (up color / down color).
- Wide Stdev Area — the 20 values are spread out, meaning fast and slow sensitivities disagree. Such conditions are usually filtered and harder to trade directionally.
- Narrow Stdev Area — the values cluster together, meaning the family speaks with one voice.
- Divergence — some traders watch for the median making a new extreme while price fails to do the same, or the other way round, as a sign that the current move is losing momentum.
None of the above is a trade signal. The indicator draws a picture of internal agreement; entries, exits and risk management remain the trader's decision.
Input parameters
Parameter (as shown in the Inputs tab) | Default | Options / Range | What it does |
|---|---|---|---|
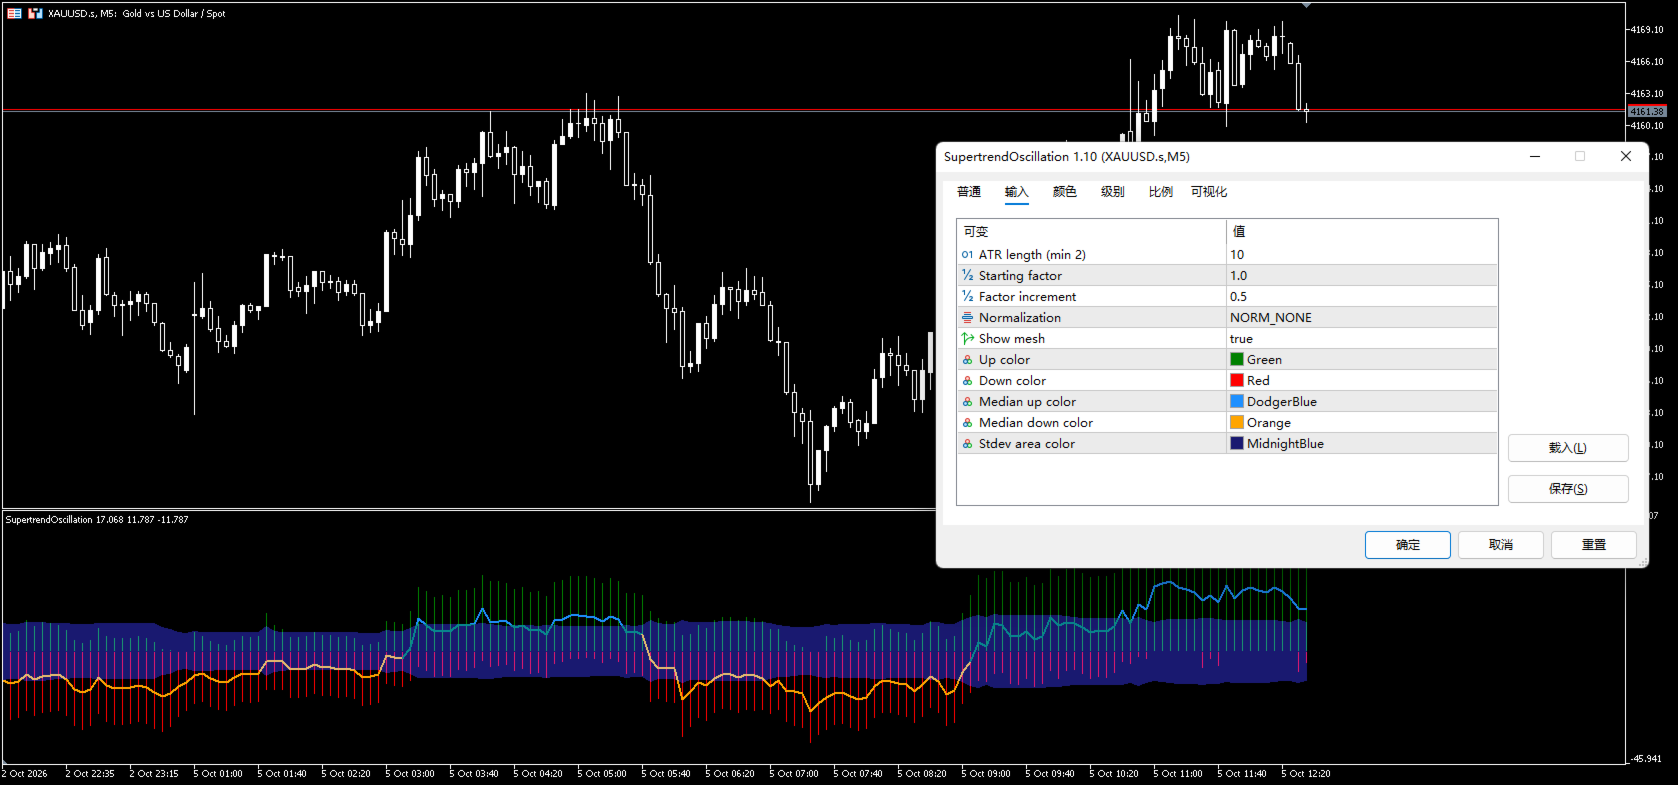
InpLength — ATR length (min 2) | 10 | integers, minimum 2 | Period of the ATR used to build the bands. Shorter values make every instance more reactive, longer values make the whole family smoother. |
InpStartingFactor — Starting factor | 1.0 | 0 or greater | ATR multiplier of the first, most sensitive instance. |
InpIncrement — Factor increment | 0.5 | 0 or greater | Step added to the multiplier for each following instance. The last instance uses Starting factor + 19 × Increment. With an increment of 0 all 20 instances become identical and the mesh collapses into a single value. |
InpNormalize — Normalization | NONE | NONE / MAX_MIN / ABS_SUM | Scaling applied to the plotted values. See the next section. |
InpMesh — Show mesh | true | true / false | Displays or hides the 20 columns. Hiding them leaves a clean median plus dispersion band view and lightens the drawing load on slower machines. |
InpUpColor | Green | any color | Color of mesh columns above zero. |
InpDnColor | Red | any color | Color of mesh columns below zero. |
InpMedianUpColor | DodgerBlue | any color | Color of the median line while it is above its threshold. |
InpMedianDnColor | Orange | any color | Color of the median line while it is below its threshold. |
InpStdevColor | MidnightBlue | any color | Color of the ±1 standard deviation fill. |
Normalization modes
- NONE — values are shown in the price units of the chart. You read directly how far price is away from each band, which is convenient for setting volatility-based targets, but the numbers are not comparable between symbols with different price scales.
- MAX_MIN — at every bar the 20 values are rescaled to the 0…1 interval using that bar's smallest and largest value. The mesh then shows only the internal shape and distribution of the family, without the influence of current volatility. In this mode the dispersion band is not drawn, because it carries no meaning after rescaling, and the median's reference threshold becomes 0.5.
- ABS_SUM — each value is divided by the sum of the absolute values of the same bar, giving values roughly in the −1…+1 range. This is the mode to use when comparing different symbols, different periods or when screening a watchlist.
Starting points for your own testing
The following combinations are only starting points for exploration, not recommended or optimal settings — every symbol, session and timeframe behaves differently.
- Intraday on M15–H1: ATR length 10, starting factor 1.0, increment 0.5, normalization NONE.
- Swing on H4–D1: ATR length 14, starting factor 1.5, increment 0.5.
- Cross-symbol comparison or watchlist screening: normalization ABS_SUM.
- Minimal chart: Show mesh = false, keeping only the median line and the dispersion band.
- Wide sensitivity coverage: keep the default starting factor and raise the increment to spread the family further apart, or lower it to concentrate the family around the fast instances.
Practical notes
- The indicator is a context and filter tool. It is commonly combined with support and resistance, price action or a separate entry trigger; it does not generate entry or exit orders.
- It can be loaded on several timeframes of the same symbol at once, which gives a compact picture of how short-term and long-term sensitivities relate to each other.
- It performs no trading operations, sends no orders and modifies no chart objects.
- Values depend on ATR, so they expand and contract with volatility. Do not compare absolute readings of NONE mode across different market regimes without normalization.
- A minimum of ATR length + 2 bars is required before anything is plotted; on a freshly opened chart the first bars remain empty.
- No external libraries, no internet connections and no DLLs are used.
Product facts
- Type: indicator, separate window
- Platform: MetaTrader 5
- Plotted series: 22 (20 mesh columns, median line, dispersion band)
- Works on any symbol and timeframe available in the terminal
Availability
The indicator is currently offered free of charge. According to the seller's plan, once the number of downloads exceeds 100 the product will be switched to a subscription (rental) offer. Please check the offer type shown on the product page before installing, as availability conditions are always those displayed there.
Support is provided through the comments section of the product page and through the messaging system on mql5.com. No external resources, messengers or contact addresses are used.
Disclaimer
Supertrend Oscillation is an analytical tool for visual market assessment. It does not place trades, does not manage positions and does not provide investment advice. It does not guarantee, promise or imply any profit, and no representation is made that using it will improve trading results. Trading in financial markets involves substantial risk and is not suitable for every investor. Any examples, screenshots or settings mentioned in this description are illustrations of the interface only. Past behavior of any indicator or setting does not predict future results. Please evaluate the indicator on a demo account before using it in live trading.