MACandleApprox
- 지표
- 버전: 1.30

MACandleApprox — Moving-Average Approximate Candle Indicator
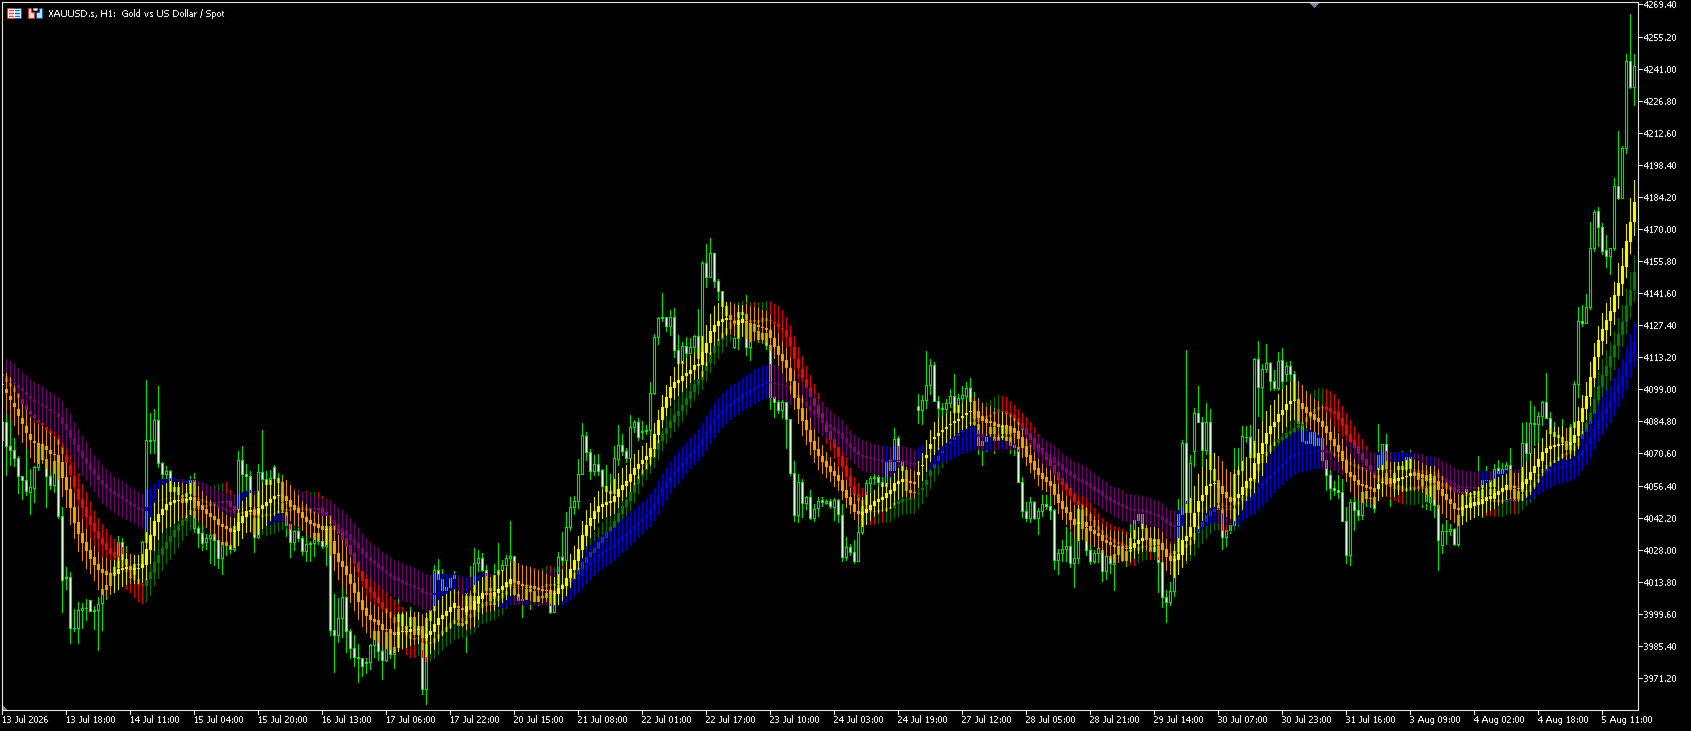
MACandleApprox is a custom indicator that, on the main price chart, applies a selected type of moving average to the open, high, low, and close price series respectively, and replots them as "approximate candles". It does not modify the original candlesticks; instead, it overlays a smoothed candle view based on moving averages, helping traders observe the smoothed price movement and directional changes more intuitively.
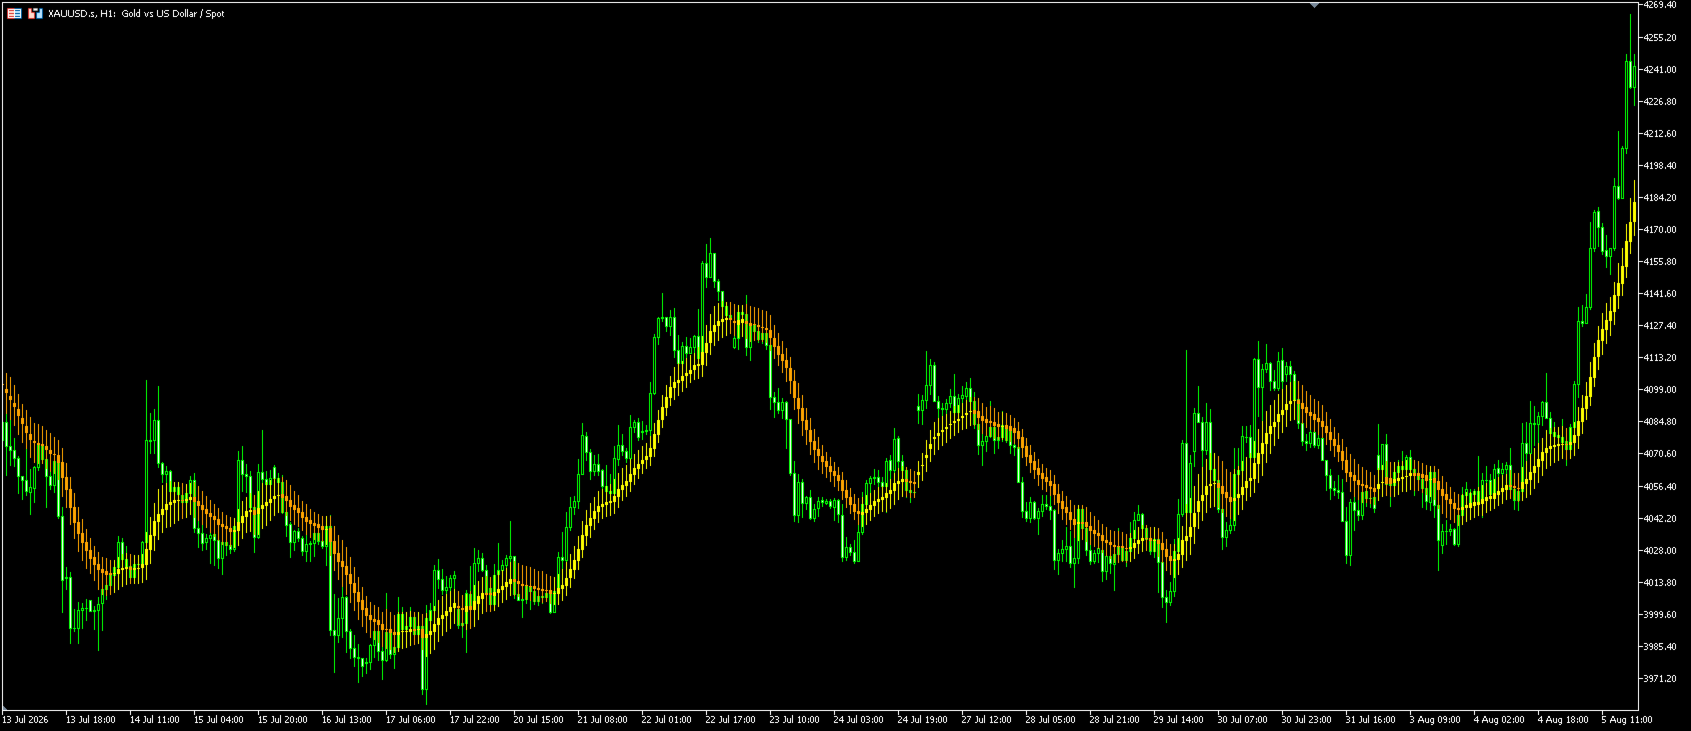
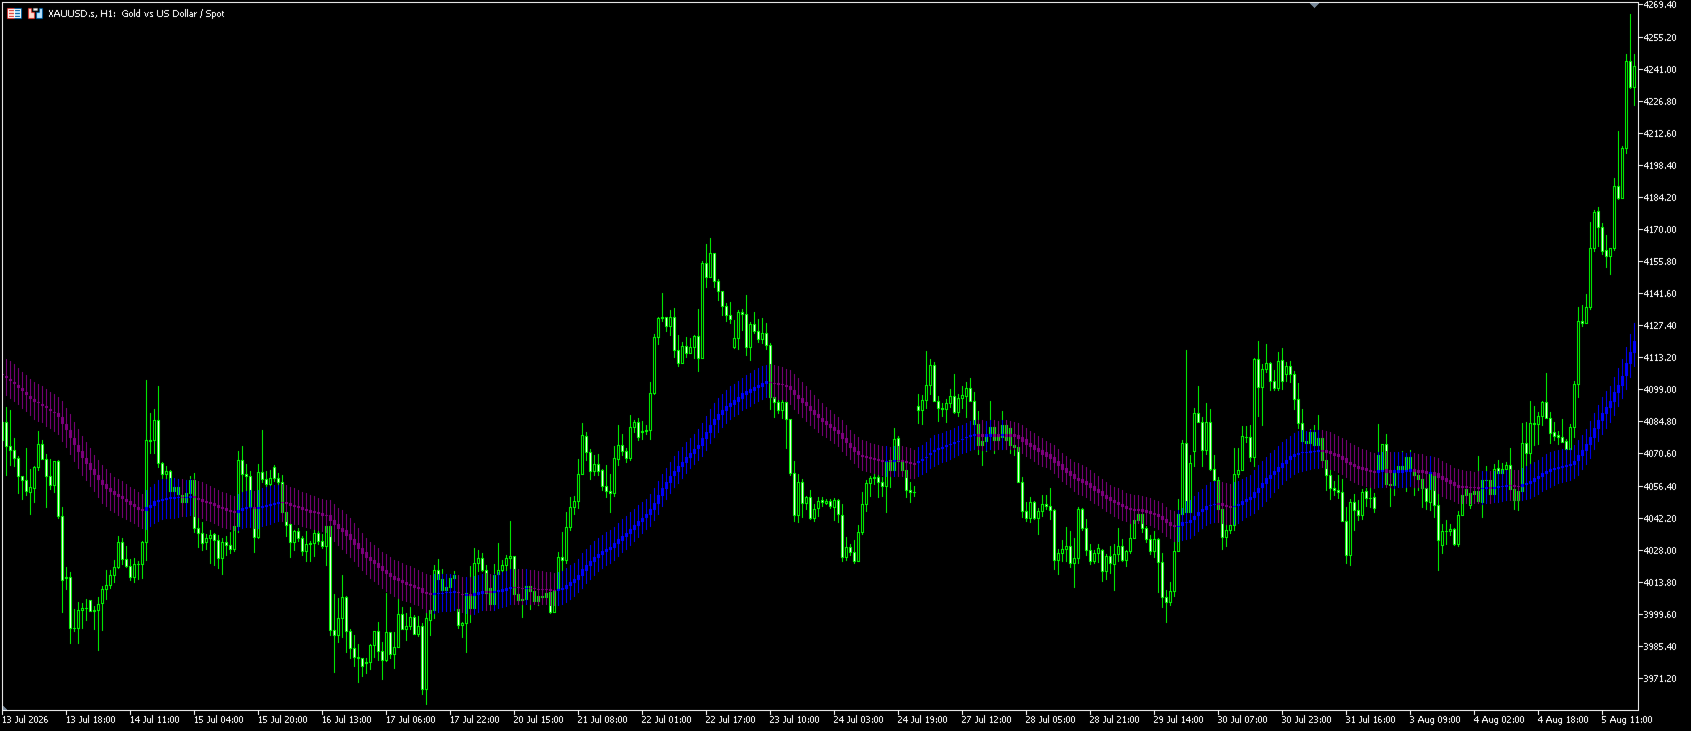
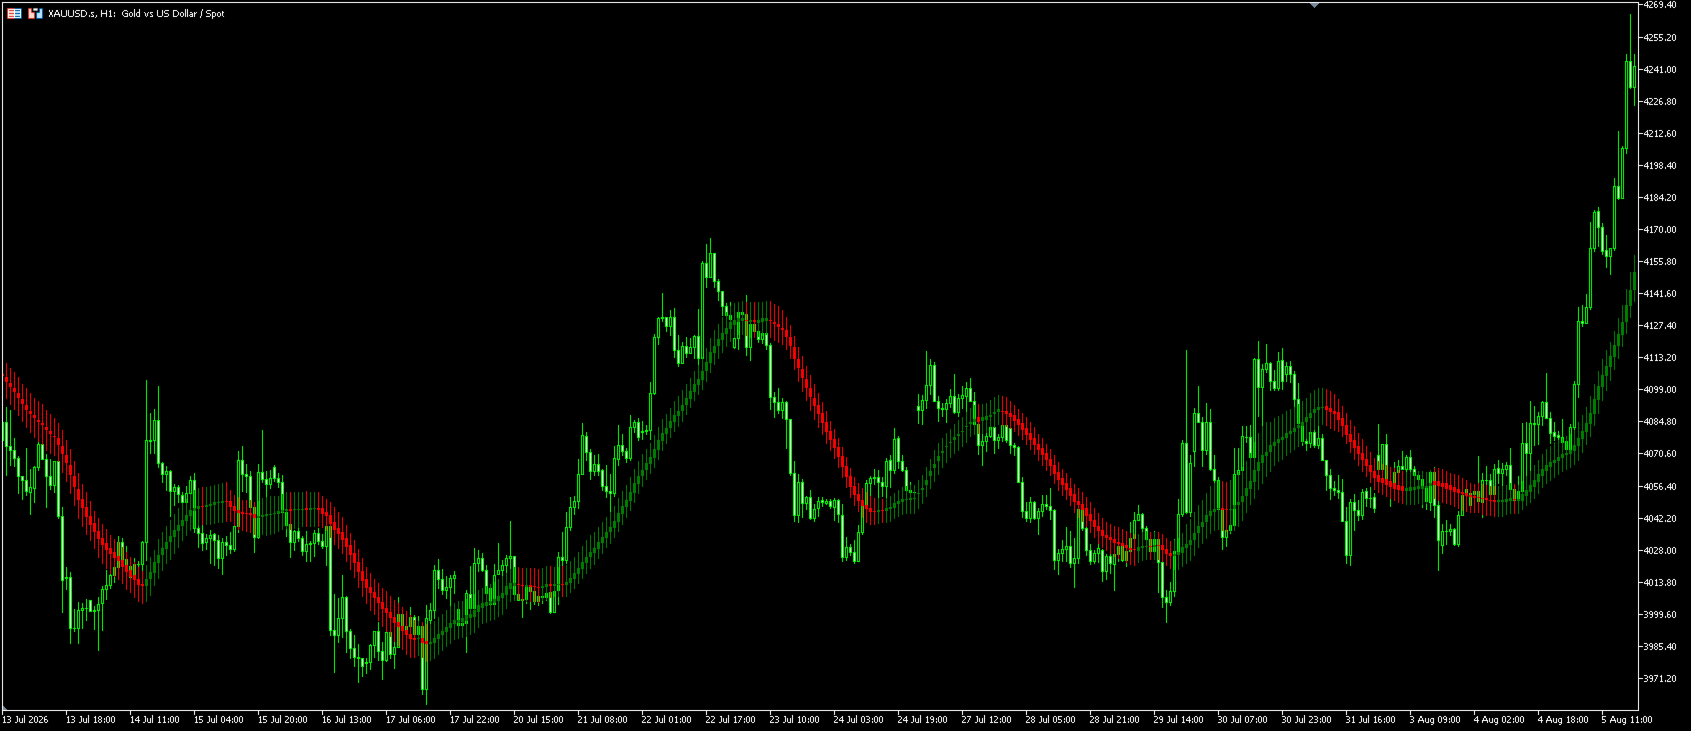
The indicator supports up to three independent approximate-candle groups. Each group can be enabled or disabled individually, with its own length, moving-average type, and bull/bear colors.
Supported Moving-Average Types
Each candle group can select one of the following six MA algorithms:
- SMA — Simple Moving Average
- EMA — Exponential Moving Average
- WMA — Linear Weighted Moving Average
- VWMA — Volume Weighted Moving Average (calculated using the volume series)
- HMA — Hull Moving Average (approximated via a combination of WMAs)
- RMA — Smoothed Moving Average (i.e. SMMA / RMA)
Input Parameters
Candle Group 1 (enabled by default)
- Show Candle 1: Yes / No
- Length: 21
- MA Type: SMA
- Candle Style: Wick (unified as a solid candle in approximation mode)
- Bull Color: Green
- Bear Color: Red
Candle Group 2 (disabled by default)
- Show Candle 2: Yes / No
- Length: 50
- MA Type: EMA
- Bull Color: Blue
- Bear Color: Purple
Candle Group 3 (disabled by default)
- Show Candle 3: Yes / No
- Length: 8
- MA Type: RMA
- Bull Color: Yellow
- Bear Color: Orange
Color Logic
The color of each approximate candle is determined by comparing the current close-based MA value with the previous one: if the current close MA is higher than the previous close MA, the bull color is used; otherwise the bear color is used. When data is insufficient at the beginning of the series, the corresponding buffers are set to empty values and the terminal will not draw those candles.
Usage
- Place the compiled EX5 file into the Indicators directory of MetaTrader 5, then restart the terminal or refresh the Navigator.
- Drag the indicator onto the main chart of any symbol.
- In the indicator properties, enable Group 2 and/or Group 3 as needed, and adjust the length, MA type, and colors.
- It is recommended to observe the behavior of different length parameters across multiple timeframes (M1–D1) and use the indicator together with other analysis tools.
Performance Notes
HMA involves nested WMA calculations and incurs a certain computational overhead on long history. For lightweight smoothing, SMA / EMA / WMA are preferable.
Risk Disclosure
This indicator is provided solely for visualization of price data and as an aid to technical analysis. It does not constitute trading advice and does not guarantee any future profit. Real trading involves the risk of loss of principal. Users must assess risks on their own and comply with the financial regulations applicable in their jurisdiction. Past performance is not indicative of future results.
Technical Support
For questions about the product, please leave a comment on the product page at mql5.com or contact the author via the mql5.com internal messaging system.