AutomaitcSR
- 지표
- 버전: 2.0

Automatic Support and Resistance Levels with Breakout Tracking
Product name note: the file name and the indicator short name in the source are AutomaitcSR . The correct spelling AutomaticSR is recommended before submission. Use one identical name for the file, the short name and the Market product title.
Short description (for the Market product card)
Automatic support and resistance levels built from confirmed swing pivots, with ATR-based filtering, optional level zones, breakout marking and a compact on-chart dashboard.
Overview
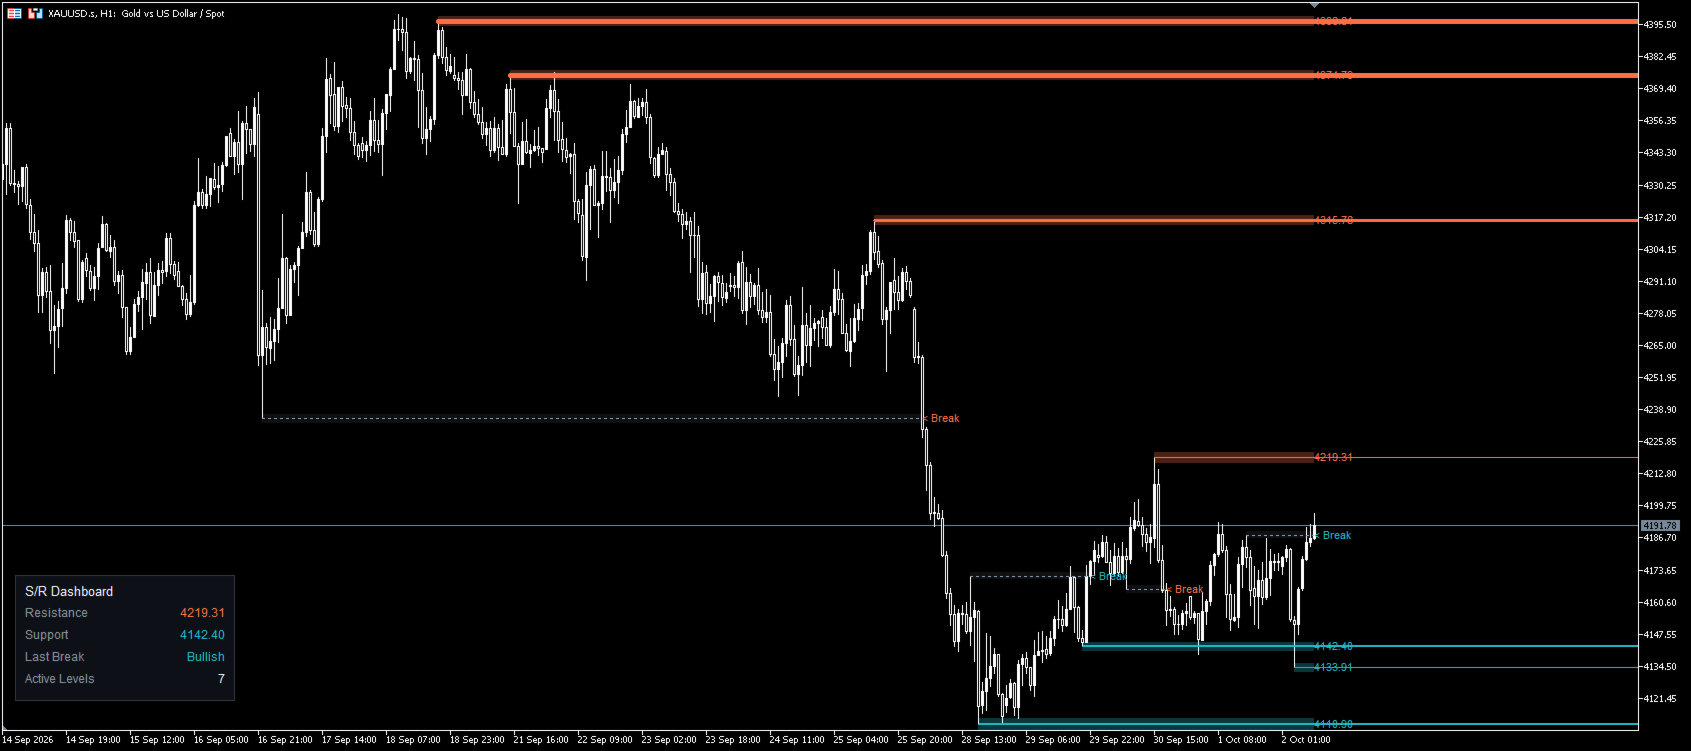
AutomaticSR is a MetaTrader 5 chart indicator. It detects swing highs and swing lows on the current symbol and timeframe, converts the confirmed ones into horizontal support and resistance levels, keeps the levels up to date as new bars arrive, and marks the moment a level is broken.
The indicator is a visual analysis tool. It draws information on the chart; it does not place, modify or close orders, and it does not generate trade signals. All decisions remain with the user.
Main properties:
- Levels are derived from confirmed swing pivots, so a level is fixed once it appears.
- Distances, thresholds, zone width and breakout sensitivity are measured in ATR units, so the same settings behave consistently across symbols and price scales.
- The number of chart objects is limited by configurable caps, and all objects are removed when the indicator is unloaded.
How it works (conceptual, no programming required)
- Swing detection. The indicator looks for bars whose high (or low) is the extreme among a number of neighbouring bars on both sides. The number of neighbouring bars is set by Pivot Length. Because both sides are required, a pivot can only be confirmed after that many bars have closed; the level therefore appears with a short, known delay and does not move afterwards.
- Strength filter. A candidate pivot is accepted only if it stands out from its immediate neighbours by at least Min ATR Strength × ATR. Weak, noisy pivots are ignored.
- Level creation and merging. An accepted pivot becomes a horizontal level. A new level is skipped when another level of the same type already lies within Merge Threshold × ATR, which keeps the chart free of duplicated lines. The number of simultaneously displayed levels per side is limited by Max Active Levels Each Side.
- Level zones. Each level can be drawn as a semi-transparent band around its price. The band width is set in ATR units and is blended with the chart background colour.
- Aging. Levels older than Max Level Age (bars) are removed automatically, so the chart shows the structure that is still relevant.
- Breakouts. A level is considered broken when a closed bar closes beyond the level by more than Break Sensitivity × ATR. The level then switches to the broken style (thin dotted line, neutral colour, no further extension to the right), optionally receives a "< Break" label, and is moved to a short list of recently broken levels limited by Max Broken Levels Shown.
- History replay. On first load the indicator replays the recent bars from oldest to newest, so the levels, zones and breakout marks you see are the same ones that would have been built bar by bar. After that, only new bars are processed.
- Dashboard. An optional panel shows the nearest resistance above price, the nearest support below price, the direction of the most recent breakout, and the number of currently active levels.
Key features
- Automatic support and resistance levels from confirmed swing pivots
- ATR-based strength filter to suppress insignificant pivots
- Automatic merging of nearby levels of the same type
- Optional price zones around each level
- Automatic level aging and cleanup
- Breakout detection based on closed bar closes, with sensitivity in ATR units
- Broken levels kept visible for context, with optional breakout labels
- Line width that grows with level age, so long-living levels stand out
- Optional price labels attached to the current bar
- On-chart dashboard, movable to any of the four chart corners
- Independent colour settings for support, resistance and broken levels
- Zone colours blended with the chart background for both light and dark themes
- Works on any symbol and any timeframe; no external files or DLLs required
- All chart objects are created with the indicator prefix and are removed on exit
Input parameters
Default values are the values shipped with the indicator. All ATR values are taken from a 14-period ATR calculated on the current chart symbol and timeframe.
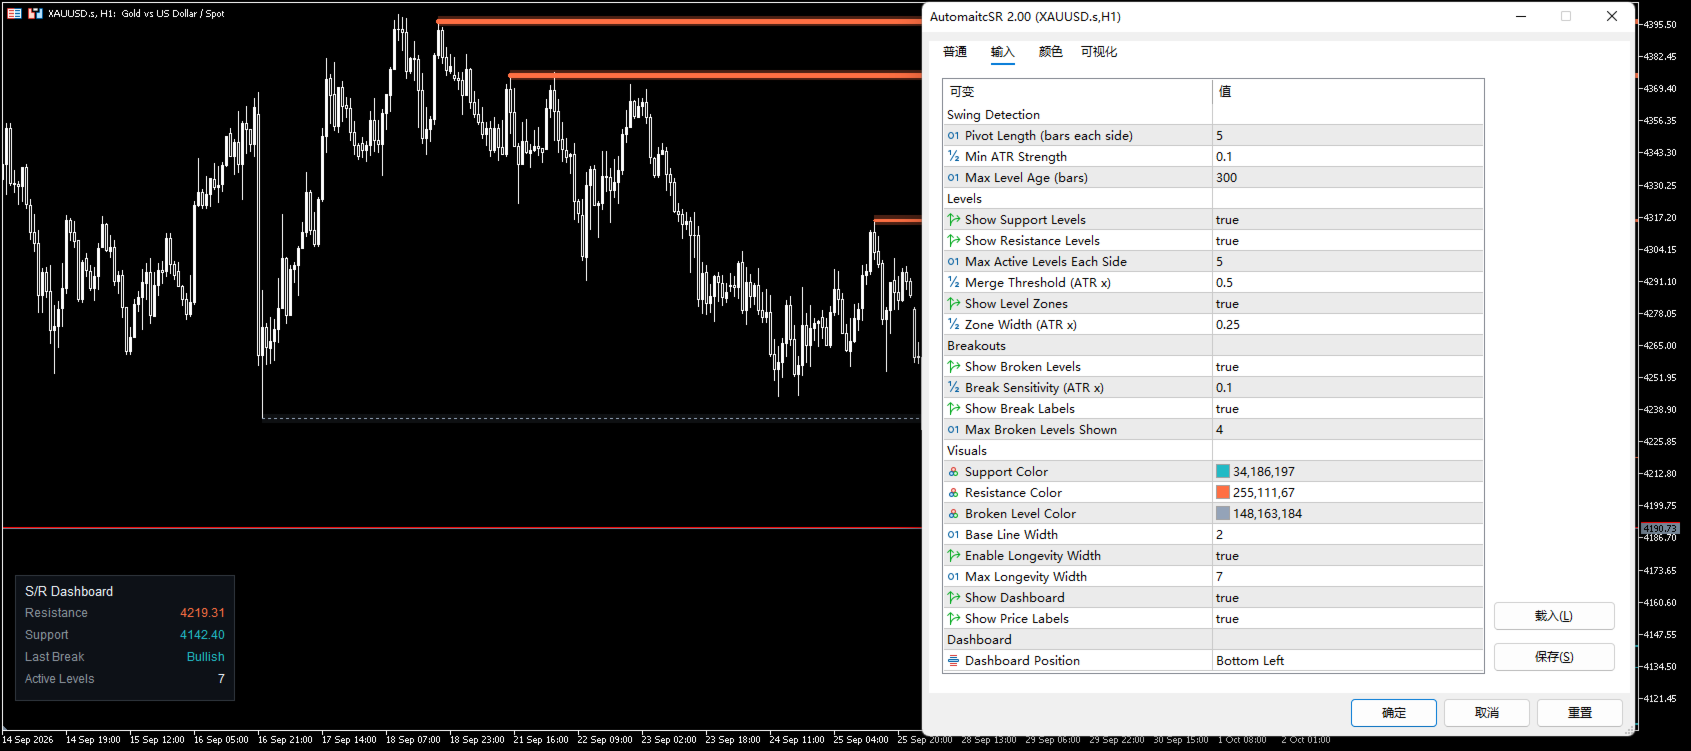
Swing Detection
Parameter | Default | Description |
|---|---|---|
Pivot Length (bars each side) | 5 | Number of bars required on each side of a pivot bar. Higher values produce fewer, more significant levels and a longer confirmation delay. |
Min ATR Strength | 0.1 | Minimum prominence of a pivot relative to its two neighbouring bars, expressed in ATR units. Higher values keep only pronounced swings. |
Max Level Age (bars) | 300 | Maximum age of a level in bars. Older levels are deleted automatically. |
Levels
Parameter | Default | Description |
|---|---|---|
Show Support Levels | true | Enables detection and drawing of support levels. |
Show Resistance Levels | true | Enables detection and drawing of resistance levels. |
Max Active Levels Each Side | 5 | Maximum number of simultaneously active support levels and resistance levels. |
Merge Threshold (ATR x) | 0.5 | Minimum distance between two levels of the same type. A candidate closer than this value is not added. |
Show Level Zones | true | Draws a semi-transparent band around each active level. |
Zone Width (ATR x) | 0.25 | Total width of the band, centred on the level price. |
Breakouts
Parameter | Default | Description |
|---|---|---|
Show Broken Levels | true | Keeps broken levels on the chart in the broken style. When disabled, broken levels are removed immediately. |
Break Sensitivity (ATR x) | 0.1 | How far a closing price must move beyond a level, in ATR units, before the level is considered broken. |
Show Break Labels | true | Places a "< Break" text label at the breakout bar. |
Max Broken Levels Shown | 4 | Number of recently broken levels kept on the chart. The oldest one is removed when the limit is exceeded. |
Visuals
Parameter | Default | Description |
|---|---|---|
Support Color | C'34,186,197' | Colour of support lines, zones and price labels. |
Resistance Color | C'255,111,67' | Colour of resistance lines, zones and price labels. |
Broken Level Color | C'148,163,184' | Colour applied to a level after it has been broken. |
Base Line Width | 2 | Line width used for all levels when longevity width is disabled. |
Enable Longevity Width | true | Increases line width with the age of a level, so older levels are drawn thicker. |
Max Longevity Width | 7 | Upper limit of the width produced by longevity scaling. |
Show Dashboard | true | Displays the information panel. |
Show Price Labels | true | Displays the price value of each active level next to the current bar. |
Dashboard
Parameter | Default | Description |
|---|---|---|
Dashboard Position | Bottom Right | Corner of the chart used for the panel: Top Right, Bottom Right, Top Left, Bottom Left. |
Dashboard content
Row | Meaning |
|---|---|
Resistance | Price of the nearest active resistance level above the current close. Shows "-" when there is none. |
Support | Price of the nearest active support level below the current close. Shows "-" when there is none. |
Last Break | Direction of the most recent breakout: "Bullish" after a resistance level is broken upwards, "Bearish" after a support level is broken downwards. Shows "-" before the first breakout. |
Active Levels | Number of levels currently active on the chart. |
How to use
- Attach the indicator to any chart in MetaTrader 5 (Insert → Indicators → Custom, or drag it from the Navigator onto the chart).
- Keep the default settings for a first look. Levels, zones and the dashboard appear immediately; the recent bars are replayed on load, so the current market structure is shown from the start.
- Adjust Pivot Length first. It is the main control: small values give many short-term levels, large values give few structural levels.
- Adjust Min ATR Strength if the chart looks too busy or too empty. This filter is independent of the pivot length.
- Use Merge Threshold and Max Active Levels Each Side to control how many lines remain visible.
- Use Break Sensitivity to decide how strict breakouts are. A larger value ignores marginal closings slightly beyond a level.
- Turn off Show Level Zones, Show Price Labels or Show Dashboard if you prefer a minimal chart.
- Only one instance is normally needed per chart. The indicator does not trade and does not require any additional settings.
Suggested starting points
Style | Timeframe | Pivot Length | Min ATR Strength | Max Level Age | Break Sensitivity |
|---|---|---|---|---|---|
Short term | M5 – M15 | 3 – 5 | 0.10 – 0.20 | 150 – 300 | 0.10 |
Intraday | M30 – H1 | 5 – 7 | 0.15 – 0.25 | 300 – 500 | 0.10 – 0.15 |
Swing | H4 – D1 | 5 – 10 | 0.20 – 0.30 | 300 – 600 | 0.15 – 0.25 |
For very volatile symbols, increase Min ATR Strength and Merge Threshold. For slow or low-volatility symbols, reduce them. These are starting points only; the suitable values depend on the symbol and on personal chart reading habits.
Notes and limitations
- Levels are confirmed only after Pivot Length bars have closed on the right side of a pivot. This delay is inherent to swing detection and is not a defect; confirmed levels do not move or disappear afterwards, except when they are broken or exceed the maximum age.
- Breakouts are evaluated on the closing price of a closed bar. Intrabar wicks that pierce a level without closing beyond it are not marked as breakouts.
- The indicator needs a minimum amount of history on the chart and a filled ATR buffer before it starts drawing. Loading more history gives a more complete picture.
- Breakout marks, zones and labels are chart objects. They are bound to the chart window and are removed together with the indicator.
- The dashboard is repositioned at every tick, so it follows the chart size and the selected corner.
Availability
The indicator is currently distributed free of charge through the MQL5 Market. Once the number of downloads reaches the threshold set by the Market service for free products (100 downloads), it will be converted to a paid subscription product. Users who obtained the free version before the conversion keep their copy, including updates delivered through the Market.
Demo version
In accordance with the MQL5 Market rules, a demo version of an indicator cannot be run or seen on an online chart. Its behaviour can be observed in the visual testing mode of the Strategy Tester built into the client terminal.
Risk disclaimer
This indicator is a technical analysis and chart visualisation tool. It does not provide trading signals, does not open or manage positions, and does not guarantee or promise any profit. Support and resistance levels and breakout markings are interpretations of past price data only. Trading in financial markets involves substantial risk. Any use of this indicator, and any trading decision taken with or without it, remains the sole responsibility of the user.