Session Value Desk
- 지표
- 버전: 1.0

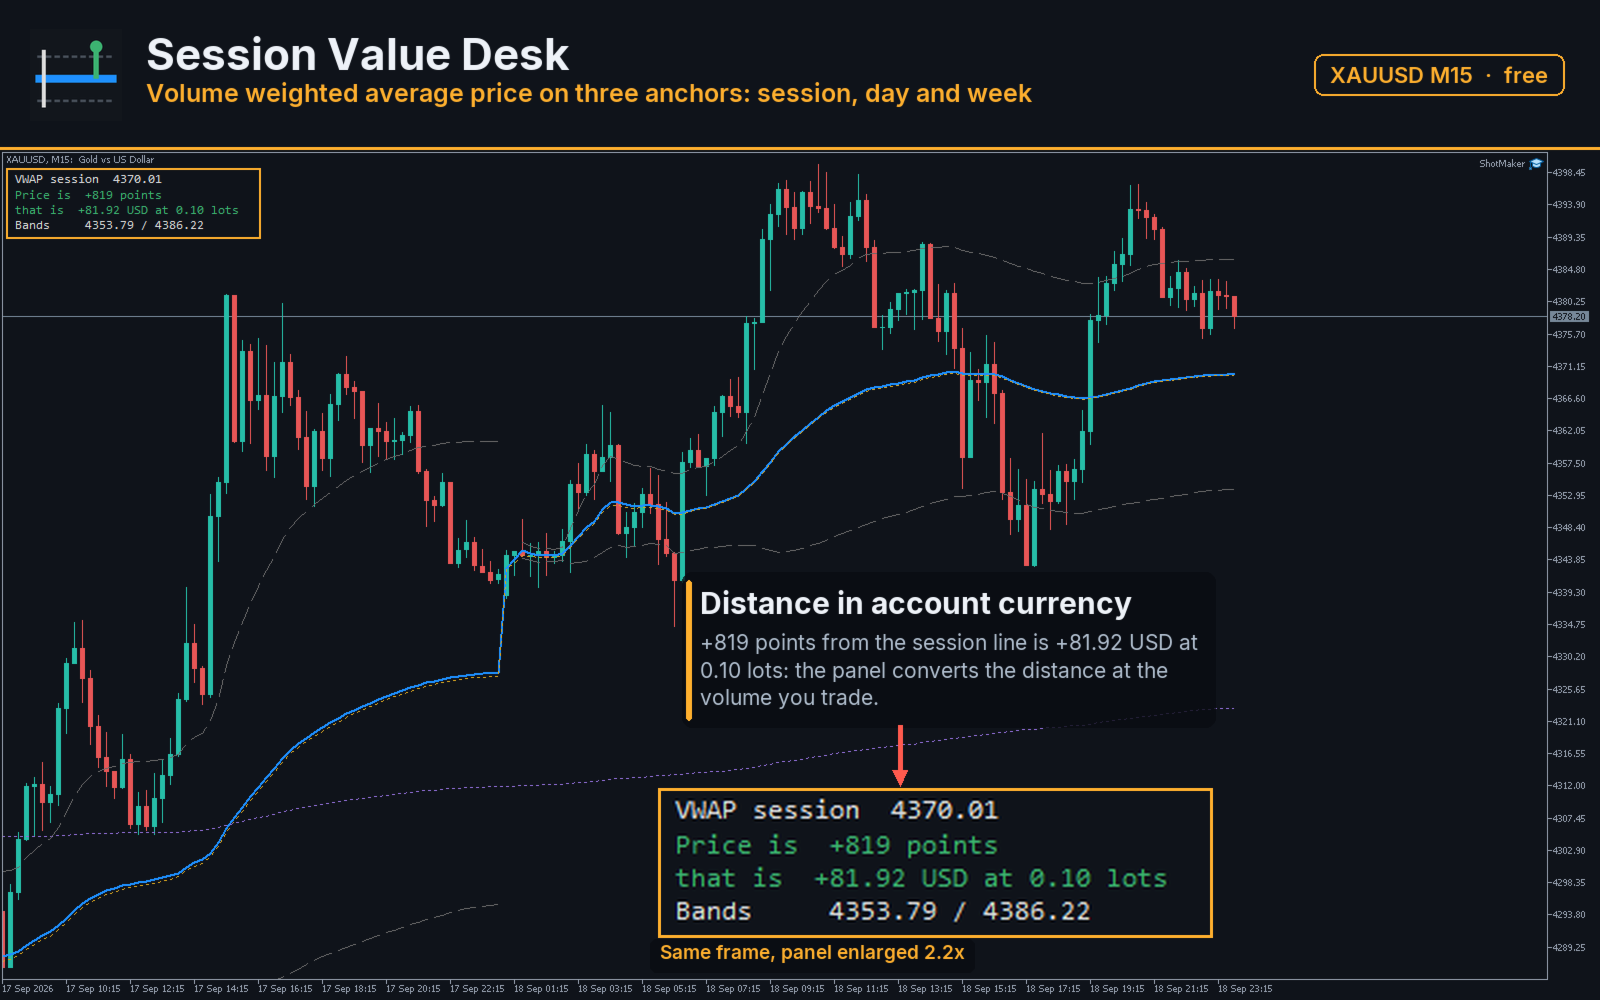
Three Anchors On One Chart
Most volume weighted average lines restart once a day. This one draws three at the same time: one anchored to the current trading session, one to the day, one to the week. Their spread tells you something a single line cannot. When the session line sits far under the weekly one, the week has been trading higher than today is; when all three sit together, the market has spent the week in one place.
Why The Session Anchor Is Not Midnight
The session line starts where the symbol's own schedule says the session starts, read from the terminal through the broker's trading hours for that weekday, not from midnight server time. On most brokers server midnight falls in the middle of nothing: the day you watch and the day the server counts are different days, and a line anchored to the wrong one carries the tail of the previous session inside it.
Where a symbol has no schedule at all, the line falls back to the start of the server day, and the panel keeps working.
The Distance In Money
The panel prints how far price stands from the chosen line in points, and then what that distance amounts to at the volume you set. Both figures come from your own symbol specification - tick value and tick size - so the figure is in the currency of your account and at your contract size, not an example taken from another broker.
Sign is kept, not hidden: a positive figure means price is above the line, a negative one means below.
The Bands
The bands are the weighted deviation of price around the session line, at the width you set. They are not a forecast and not a signal. They answer one question: how far from the session average this instrument has been willing to trade today, measured in its own numbers rather than in a fixed number of points that means different things on gold and on a currency pair.
Input Parameters
- PriceSource - typical, close or median price for each bar's contribution
- BandSigma - band width in weighted deviations
- PanelAnchor - which of the three lines the panel measures the distance to
- PanelVolume - volume the distance is converted into money for
- UseRealVolume - weight by real volume where the broker supplies it
- ShowPanel - draw the panel or keep only the lines and buffers
- PanelCorner - corner of the chart, offsets, font size
- ColorAbove - colour used when price is above the line
- ColorBelow - colour used when it is below
- ObjectPrefix - prefix for every chart object created
Reading The Figures From An Expert Advisor
Five lines are published as buffers in this order: session, day, week, upper band, lower band. A sixth buffer carries the distance from price to the chosen anchor in points, so an expert advisor can read one number instead of recomputing the average. Buffers hold an empty value while a line has no bars to average yet.
Requirements
Any symbol and any timeframe. The indicator places no orders, writes nothing to disk, and every figure on the panel is recomputed from the terminal's own series, so a demo and a live account of the same broker show the same picture.
Support
Questions about a parameter, or a symbol where the session anchor looks wrong for your broker: reply in the comments of this page with the symbol and the broker, and I will look into it. A rating helps other traders decide whether a free tool is worth their time, whichever way it goes.