Session Value Desk

Three Anchors On One Chart

Most volume weighted average lines restart once a day. This one draws three at the same time: one anchored to the current trading session, one to the day, one to the week. Their spread tells you something a single line cannot. When the session line sits far under the weekly one, the week has been trading higher than today is; when all three sit together, the market has spent the week in one place.

Why The Session Anchor Is Not Midnight

The session line starts where the symbol's own schedule says the session starts, read from the terminal through the broker's trading hours for that weekday, not from midnight server time. On most brokers server midnight falls in the middle of nothing: the day you watch and the day the server counts are different days, and a line anchored to the wrong one carries the tail of the previous session inside it.

Where a symbol has no schedule at all, the line falls back to the start of the server day, and the panel keeps working.

The Distance In Money

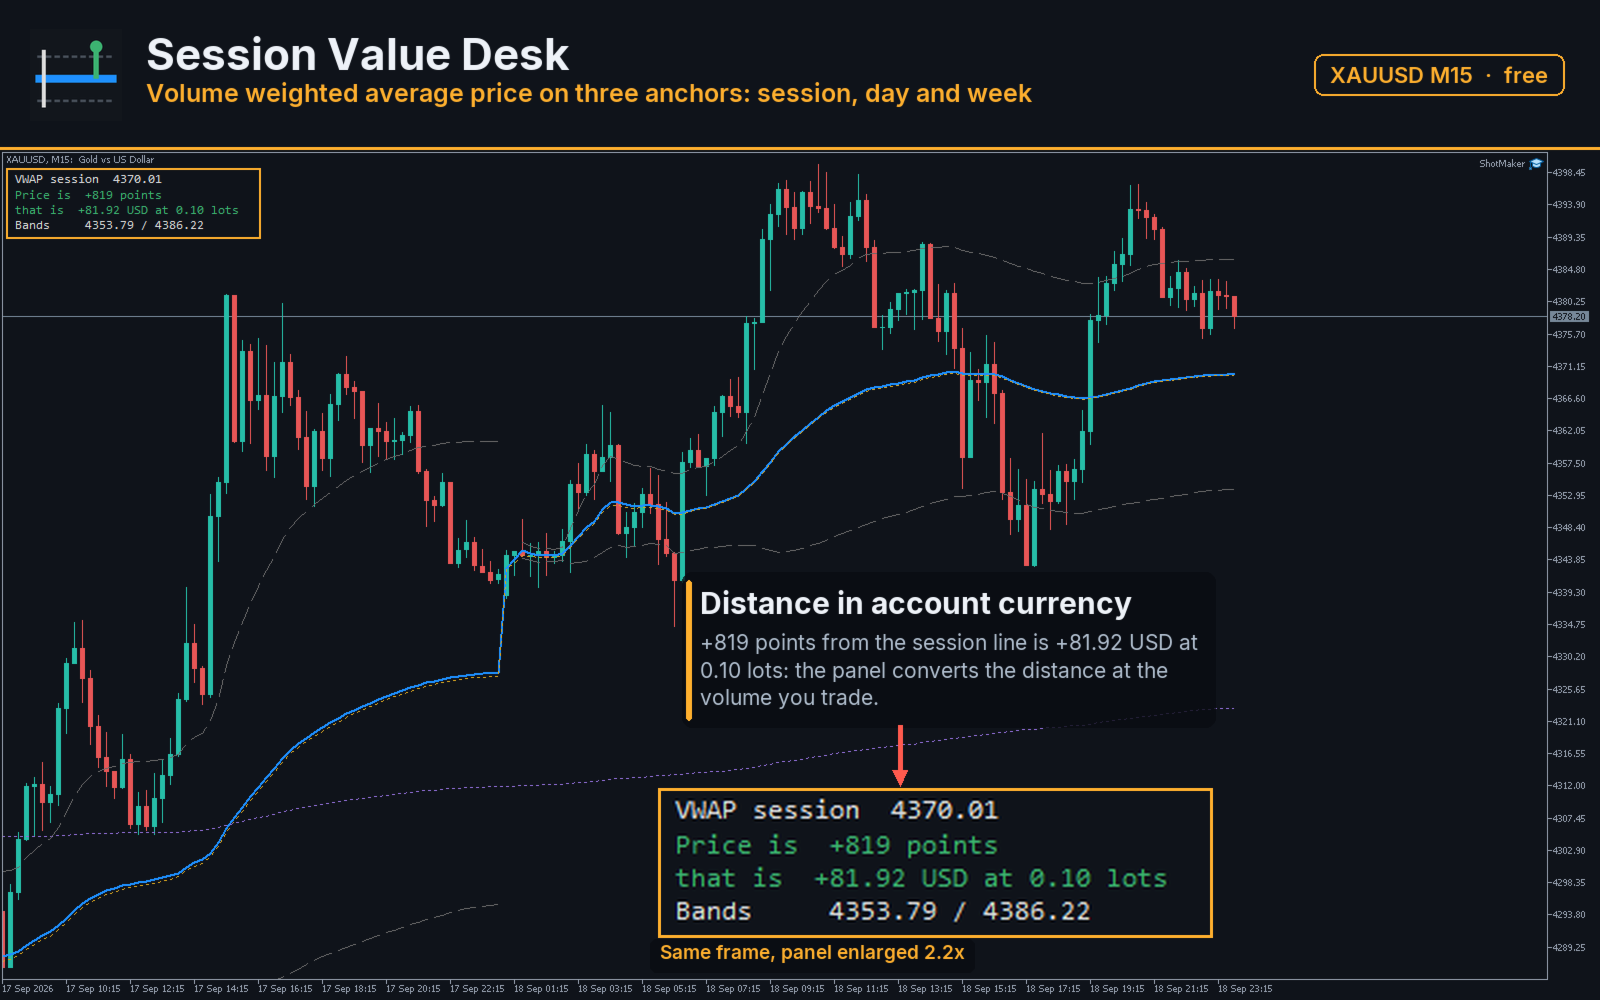
The panel prints how far price stands from the chosen line in points, and then what that distance amounts to at the volume you set. Both figures come from your own symbol specification - tick value and tick size - so the figure is in the currency of your account and at your contract size, not an example taken from another broker.

Sign is kept, not hidden: a positive figure means price is above the line, a negative one means below.

The Bands

The bands are the weighted deviation of price around the session line, at the width you set. They are not a forecast and not a signal. They answer one question: how far from the session average this instrument has been willing to trade today, measured in its own numbers rather than in a fixed number of points that means different things on gold and on a currency pair.

Input Parameters

  • PriceSource - typical, close or median price for each bar's contribution
  • BandSigma - band width in weighted deviations
  • PanelAnchor - which of the three lines the panel measures the distance to
  • PanelVolume - volume the distance is converted into money for
  • UseRealVolume - weight by real volume where the broker supplies it
  • ShowPanel - draw the panel or keep only the lines and buffers
  • PanelCorner - corner of the chart, offsets, font size
  • ColorAbove - colour used when price is above the line
  • ColorBelow - colour used when it is below
  • ObjectPrefix - prefix for every chart object created

Reading The Figures From An Expert Advisor

Five lines are published as buffers in this order: session, day, week, upper band, lower band. A sixth buffer carries the distance from price to the chosen anchor in points, so an expert advisor can read one number instead of recomputing the average. Buffers hold an empty value while a line has no bars to average yet.

Requirements

Any symbol and any timeframe. The indicator places no orders, writes nothing to disk, and every figure on the panel is recomputed from the terminal's own series, so a demo and a live account of the same broker show the same picture.

Support

Questions about a parameter, or a symbol where the session anchor looks wrong for your broker: reply in the comments of this page with the symbol and the broker, and I will look into it. A rating helps other traders decide whether a free tool is worth their time, whichever way it goes.
作者のその他のプロダクト
A liquidity sweep is a bar that pushes past a prior swing high or swing low, where protective stop orders tend to rest, and then closes back on the inner side of that level. The same event is known under several names: a stop hunt, a stop run, a liquidity grab, a false breakout, a failed breakout, or a swing failure. Swept Liquidity Pools marks those levels and those bars on the chart. The indicator tracks liquidity pools - confirmed swing levels that have not yet been taken - and marks the exac
FREE
Hourly Spread Map answers one question: at which hours does this symbol cost more to enter, and by how much. It reads the spread field that the terminal stores in every closed M1 bar of your own broker feed, sorts those measurements into 24 hours by 7 days of the week, and shows the result as a grid in the indicator sub-window. What It Measures Every closed M1 bar carries one spread measurement. The indicator collects them over the period you choose, groups them by the hour and weekday of the ba
FREE
Swap is the part of the cost that is easy to forget, because it arrives once a day, quietly, and never appears in the spread. Swap Cost Calendar puts it on the chart as a number you can act on. What It Shows The panel reads what the broker publishes for the current symbol and shows four things. The cost of one night for a long position and for a short one, in your account currency or in points. The weekday line, showing how many nightly charges a position carries on each day of the week. The tri
FREE
What It Shows Candle Clock Desk puts four lines on the chart. The first is the time left until the current bar closes. The next three answer a question the clock alone cannot: is this bar unusually busy, or unusually quiet, right now. Bar closes in - the countdown, in minutes and seconds So far - volume this bar has accumulated since it opened Usual here - what this symbol had accumulated by this same minute, in the past Pace - the first divided by the second The Pace Line Pace of 1.00 means the
FREE
流動性プールとは、まだ取られていない確定済みのスイングハイまたはスイングローのことです。流動性スイープとは、価格がその水準を超えて取引され、その後レンジ内に戻って終値をつけるバーのことで、同じ出来事はストップハント、ストップラン、流動性グラブ、または偽のブレイクアウトとも呼ばれます。 Liquidity Sweep Pools MTF は、プールとそこで行われた流動性スイープの両方を、現在のチャートと選択した上位時間足でマークし、アクティブなプールのライブパネル、プール形成時の出来高フィルター、検出されたスイープの CSV エクスポートを追加します。 ここでのマルチタイムフレーム確認とは、各流動性スイープを、目の前のチャートを離れることなく上位時間足のプールと照らし合わせて読むことができ、両方の水準セットがそれぞれの色で並べて描画されることを意味します。 何をマークするか 正確に一つのこと、プールの形状です。描画されるすべてのプールは、価格水準、方向、距離、経過時間を持ち、同じ4つの値がパネルと CSV ファイルに入ります。それが語彙のすべてであり、だからこそ出力はバーごとに検証しやす
XAUUSD 用の MetaTrader 5 エキスパートアドバイザーです。1 回に 1 バスケットで動作し、サーバー時間の固定セットでオープンし、価格が逆行するとポジションに追加し、バスケット全体をまとめてクローズします。個々のポジションにはストップロスもテイクプロフィットもありません。 取引方法 シンボルは XAUUSD のみ、1 回に 1 バスケット、同じ方向で最大 5 件の注文。 エントリーは固定サーバー時間内のみ許可され、価格が 4 時間レンジの端にあるときのみ可能です。エントリーはサーバー時間 14:00 から 22:00 の間はブロックされます。 価格がバスケットに逆行すると、エキスパートはドルで固定距離の注文を追加し、注文間に少なくとも 60 秒の間隔を置きます。 バスケットは全体としてクローズされます:口座通貨の目標、エントリー時間に依存する価格目標、または目標が有効になった後のトレーリングリベイクによって。 注文数量は口座残高に比例します。追加された注文は同じ数量を保ちます:乗数はありません。 エキスパートはすぐに実行可能な状態で提供されます:デフォルト入力は下記の
Sarveon
Vasilii Makarenko
Sarveon は MetaTrader 5 上の XAUUSD 向けエキスパートアドバイザーです。9 つの独立した戦略が 1 つのチャート上で並行して動作します。各戦略は独自のマジックナンバー、独自のエントリー時間足、独自の距離設定を持ち、他の戦略が開いたポジションに加算することは決してありません。 取引方法 各戦略は、自身のエントリー時間足の直近のバーをスキャンしてスイングレベルを探します。それは、それ以降のどのバーも超えなかった高値、またはそれ以降のどのバーも突破しなかった安値です。レベルは現在価格から最小距離以上離れている必要があり、そうでなければ無視されます。 エントリーは、そのレベルにドル単位の固定オフセットを付けて置かれる保留ストップ注文です。買いストップはレジスタンスレベルの上ではなく下に置かれるため、注文は価格がまだレベルに近づいている間に約定し、レベルが突破された後ではありません。ストップロスとテイクプロフィットは注文の設置時に注文に付加され、約定価格ではなく注文価格から測定されます。 各戦略は、同時に保持できる保留注文数と未決済ポジション数を制限し、すでに待機して
Ridgelineは、金が放置した価格レベルで待機します。日足バーを読み、その後のどのバーも突破していない高値と安値をマークし、そこに未約定のストップ注文を置きます。7つのルールセットが異なる歴史の深さで探索するため、1つは先週形成されたレベルで待機し、別のものは3か月前のレベルを監視することがあります。 損失を出したセットは、再び何かを置くまで2日間待機します。各セットは独自のマジックナンバーと独自の距離を持ち、あるセットが別のセットの建てたポジションに追加することは決してありません。損失トレードはストップで決済され、決してナンピンされず、決して倍にされません。 レベルの見つけ方 各セットは日足バーを読み、1つのものを探します。それは、形成されて以来市場が突破していないレベルです。レジスタンスとは、その後のすべてのバーより高く、かつ直前のバーより高い日足高値です。サポートはその鏡像です。価格がすでに通過したレベルはもはやレベルではなく、セットは次へ進みます。 レベルはまた、現在価格から最小距離に位置している必要があります。最も近い未突破のレベルが近すぎる場合、セットは市場がすでに乗っ
Sixfold Gold trades XAUUSD on the hourly chart. It looks for the points where the market turned and left an extreme behind, places a pending stop order a little inside that level, and attaches a stop loss and a take profit before the order is ever filled. Six zones do this independently, each with its own search depth, and between them they read three timeframes and four sessions, so the advisor is rarely committed to a single view of the market. A trade that goes wrong is closed by its stop. No
フィルタ:
レビューなし
レビューに返信