Swap Cost Calendar

Swap is the part of the cost that is easy to forget, because it arrives once a day, quietly, and never appears in the spread. Swap Cost Calendar puts it on the chart as a number you can act on.

What It Shows

The panel reads what the broker publishes for the current symbol and shows four things.

The cost of one night for a long position and for a short one, in your account currency or in points. The weekday line, showing how many nightly charges a position carries on each day of the week. The triple charge day, taken from the broker's own setting rather than assumed. And the total for a holding period you set, counted from today forward through the calendar.

The Triple Charge Day

Most brokers charge three nights at once on one weekday to cover the weekend, and the day varies between brokers and sometimes between symbols on the same broker. The panel reads the day from the symbol settings and marks it, so a position planned across that day carries no surprise.

Holding Period

Set how many nights you expect to hold, and the panel counts the actual charges across that span starting from today: normal nights count once, the triple day counts three times, and the closed weekend itself carries none. The total appears for both directions, so a trade that looks attractive before costs can be checked against what it pays or collects while it waits.

Swap Modes And Honest Blanks

MetaTrader brokers charge swap in several different ways. Points and deposit currency convert into account currency directly, and annual interest modes convert through the position value. Those three are computed and shown.

Other modes exist where the conversion would require assumptions about currency rates that the terminal does not hand to an indicator. In those cases the panel says the mode is not converted here and prints the broker's raw values instead of inventing a figure. A number you cannot trust is worse than no number, which is why that blank is deliberate.

The same applies when the broker reports no swap at all for the symbol: the panel says exactly that.

Calculation

Swap settings are read from the symbol properties the terminal already holds, refreshed once a minute rather than on every tick. Nothing is stored between sessions and nothing is written to disk. The panel does not open, close or modify positions, and it places no orders of any kind.

Every object drawn on the chart carries a prefix you control, and all of them are removed when the panel is taken off the chart.

Input Parameters

  • PositionVolume - volume the figures are calculated for
  • NightsToHold - holding period in nights, used for the total line
  • ShowAs - account currency or points
  • ShowPanel, PanelCorner, PanelXOffset, PanelYOffset, PanelFontSize
  • ColorPositive, ColorNegative, ColorNeutral
  • ObjectPrefix - prefix for every chart object created

Requirements

MetaTrader 5, any symbol, any chart timeframe. Figures come from the broker's settings for the symbol on the account the terminal is connected to, so they match that account rather than a generic table. Works on demo and live accounts alike.

Support

Questions about parameters, about your broker's swap mode, or about a specific symbol: write in the comments of this product, I read that thread.

추천 제품
Session Highlighter V3.0F – Market Session Visualizer Overview The Session Highlighter is a professional MT5 indicator that automatically displays colored backgrounds for the three major trading sessions:   Asia, London, and US . No more guessing when sessions open or calculating time zones – just look at your chart and see. What it does Draws   three separate boxes   on your chart (one for each session) Boxes   grow dynamically   with price during the session (highest high / lowest low) To
FREE
TraderStart Structure Break Alerts Track recent market structure breaks across multiple timeframes in one clean on-chart panel. TraderStart Structure Break Alerts is a free MetaTrader 5 indicator that helps you monitor the latest market structure break on up to three configurable timeframes. It reports the most recent BOS (Break of Structure) or CHoCH (Change of Character), shows the break level, how many bars ago it occurred, and summarises the current structure bias and alignment. The indi
FREE
Session Sync MT5
Mohammadreza Faghanimakrani
Session Sync MT5 displays the Tokyo, London, New York and Sydney trading sessions directly on your chart. Each session uses its own regional daylight-saving rules and is converted to your broker's server time. The active broker time model is shown on the chart, so you can see exactly what the indicator is using. What you get • Tokyo, London, New York and Sydney session boxes • Session High/Low calculated from M1 data, independent of chart timeframe • Historical sessions loaded automatically
FREE
VTB High Watermark Drawdown INFO Indicator for MT5 Advanced Account Monitoring & Drawdown Information Dashboard VTB High Watermark Drawdown INFO is a professional account monitoring indicator designed to display drawdown statistics, account performance, and risk management information directly on the chart. Unlike Expert Advisors, this indicator does not interfere with trading activity. It does not open or close positions, modify orders, or block trading. Its sole purpose is to provide a clear a
FREE
Sessions and News Marker — sessions, calendar news and more, drawn right on your chart MetaTrader 5 leaves your chart bare: no weekend shading, no night session, no economic news on the price itself. This free indicator adds the markup that should have been there from the start, so you read market structure at a glance instead of switching between windows. Session and time markup Weekend shading — Saturdays and Sundays are highlighted (visible on crypto and other 24/7 instruments) Night session
FREE
DailySessions
Davide Zunino
4.67 (6)
The indicator represents the session boxes for the Asian, European and American sessions. It is possible to change the time of each session, such as color. It is also possible to disable the display of each session. You will find in input parameters variables to modify in format hh:mm. In Colors tab you can change the color of boxes of each sessions. If you need some implementations please contact me.
FREE
ConfluenceHunter
Ivanvielle Bonifacio Dupaya
ConfluenceHunter helps you detect confluences on the chart. Determine the market structure, find the best price, helps you calculate lots and trade levels, displays price data  ALL IN ONE GLANCE! It saves you time doing MTF (Multi-timeframe) Analysis. ConfluenceHunter does it for you! All that's left for you to do is to take that trade and take your profits!
FREE
is a visual market-monitoring indicator that displays multiple trading instruments and timeframes within a single chart window. Developed using MQL5, the indicator transforms historical price data into a structured dashboard featuring custom candlesticks or price dots. Each row represents a symbol, while each column represents a selected timeframe. This arrangement allows traders to examine recent market behavior across several instruments and timeframes without continually opening and closing c
FREE
MO Spread Monitor
Mohamed Amr Mohamed Osama Abdelwahab
MO Spread Monitor — know your spread before it costs you Spread Monitor shows the live spread in points against a limit you set, with a clear OK / BLOCKED state and an alert whenever the spread blows past the limit. It also tracks the session maximum, the running average, and how many times the limit was exceeded. Utility only: it never sends, modifies, or closes orders. 제 다른 MO 인디케이터와 EA도 확인해 보세요 — 위의 제 이름을 클릭하면 무료 및 유료 트레이딩 도구 전체를 보실 수 있습니다. https://www.mql5.com/en/users/amrosama77/seller
FREE
DataForge exports MetaTrader 5 bars to a CSV file, and writes into that file what the data actually contains. It does not trade. It places no orders, reads no positions, and requires no account permissions. It reads history and writes a text file. WHAT THE EXPORT WRITES 1. An instrument passport, placed in the CSV header    Digits, point, contract size, tick value, tick size, and the minimum, step and maximum lot are written as comment lines at the top of the file. Export the same symbol fro
FREE
VWAP Anchor Tool
Jackson Mukurani Wanguthi
Anchored VWAP is a lightweight, interactive volume-weighted average price indicator designed for traders who need precision without clutter. Unlike standard VWAP that resets every session, this tool lets you drop up to five custom anchors directly on any candle. Each anchor calculates VWAP from that exact point forward, complete with standard deviation bands to highlight where price may find support or resistance relative to volume. Key Features: • Up to 5 simultaneous anchors — compare multi
FREE
LIVE TRADES CHARTS – MQL5 INDICATOR DESCRIPTION Live Trades Charts is a MetaTrader 5 indicator that displays active trading positions directly on the chart. The indicator reads open trades and shows basic trade and account information in real time. It updates on every tick. FUNCTIONS Displays open trades on chart Per trade information: Symbol Lot size Direction (Buy or Sell) Floating profit or loss Trade duration Account information: Total floating profit/loss Number of open trades Balanc
FREE
A Event Radar
Ivan Privalov
Advanced Event Radar: Designed by an experienced trader and web performance engineer. Developed and built with performance, speed and optimization in mind. Uses unique clean outline of events, even when there are multiple events. Displays an overlapping, semi-transparent, minimalist row of sessions. Shows minimalist yet configurable bands of scheduled market events. Covers fixes, settlements, sessions, data, central banks and inventories. Reads your terminal's economic calendar and your own list
The script SphereSample.mq5 illustrates control of graphic objects using the classes from the Standard Library (Base class of objects array CArrayObj , CChartObjectText ).
FREE
Automated Timeframe cycling with Symbols centered.  Force every timeframe onto one clock window, so the story you see on Daily is the same story you are slicing on H4, H1, and M1.  Traders usually flip timeframes and lose the span. A Daily chart shows a few weeks, then M15 shows a few hours, and the eye treats them as different markets. This indicator locks the window to N bars of the highest enabled timeframe — default 10 Daily — and maps every lower timeframe to that same stretch. You stay ins
FREE
MT5toTLGRM
Fernando Morales
4.2 (5)
Do not use Windows 7 with this EA MT5toTLGRM EA only sends text messages to a Telegram group or channel of your choice. The messages are customizable to show information about any trading activity in the account. Also it shows a daily PnL report. Several instances of this EA can be used simultaneously in the same MT5 terminal for sending messages to different Telegram group/channel but ensure that each one has a different number in [B13] setting. Following are the features of MT5toTLGRM EA send
FREE
Deal multiplier Mt5
Mikhail Mitin
4.5 (8)
The utility opens copies of open trades. It is very convenient if you use the   Signals   service and want to increase the volume of transactions. Settings: Symbols: all symbols only current symbol Orders: Buy Sell Magic Any Magic Input Magic Lot size Original - lot size from original order; Fix Lot - fix lot size (input); Lot X Mult - lot size X koef; Stop Loss From sender - Stop Loss from original; Without - without Stop Loss; Plus Fix - Stop Loss from original order + fix points; Fix Point -
FREE
The   Pivot Point indicator   automatically calculates and displays the pivot point line and support and resistance levels. Pivot can be calculated according to the Classic, Floor, Fibonacci, Woodie, Camarilla or DeMark formula. It is also possible to select the period for calculating the indicator. A trader can choose from daily, weekly, monthly, or user-defined periods. Types of pivots Classic Floor Fibonacci Woodie Camarilla DeMark Main features The indicator shows the current and historic
FREE
This utility is a graphical shell for other Expert Advisors that do not have their own graphical shell or whose graphical shell you do not like. Just run the utility on a free chart of any currency pair, specify in the input parameters the "Magic Number" of the advisor to which you want to connect the utility, and a graphical shell will appear on the graph, containing information about the traded currency pairs, current positions and trading results of your advisor. If you like this utility, tak
FREE
NORA NEWS SHIELD - Professional News Protection System Product Description Overview NORA NEWS SHIELD is a professional risk management tool that automatically protects your trading during high-impact economic news releases. It monitors major global currencies and temporarily suspends trading activity during critical market-moving events, helping you avoid sudden volatility spikes and potential losses. How It Works The system continuously scans the economic calendar for upcoming high-impact news
FREE
Morwa Symbols
Michael Mafate Mogajane
Smart Watermark Displays current symbol + timeframe Shows account name (or custom text) Customizable font/color/position One-Click Tools Timeframe Switcher:   Quick-access buttons (M1 to D1) Drawing Tools:   Create horizontal lines, trendlines, and Fibonacci retracements with consistent sizing Object Cleanup:   "Delete" button removes all indicator-created drawings Pips Meter Real-time P/L tracking in pips Color-coded (green/red) for profit/loss Supports magic number filtering Chart Zoom Contro
FREE
VR Watch list and Linker MT5
Vladimir Pastushak
4.83 (12)
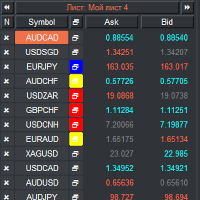
VR 감시 목록 및 링커 - 터미널용 스크리너 애플리케이션 메타트레이더 . 가장 흥미롭고 기술적인 금융 상품을 더 쉽게 찾을 수 있습니다. 이 스크리너는 bybit, Moscow Exchange, American Exchange, 외환 및 암호화폐 시장, 금속 시장 등의 거래소에서 트레이더가 거래하는 데 사용되며 소품 회사에서 거래하는 데 사용됩니다. 금융상품의 선택은 수동으로 수행됩니다. 스크리너는 MetaTrader 터미널의 오픈 차트를 연결하고, 금융상품 변경 시 각 차트의 데이터를 별도로 표시합니다. 설정, 파일 설정, 데모 버전, 지침, 문제 해결 등은 다음에서 얻을 수 있습니다. [블로그] 다음에서 리뷰를 읽거나 작성할 수 있습니다. [링크] 버전: [메타트레이더4] 스크리너를 사용하면 거래자가 가장 기술적인 금융 상품을 찾고 유동성이 낮고 위험이 높은 상품에 대한 거래를 제외하는 데 도움이 됩니다. 스크리너를 사용하면 티커가 포함된 시트를 쉽고 빠르게 생성 및 변경하
FREE
HandyThing
Alexey Oreshkin
Helper utility that does the following important actions: Shows or hides various groups of symbols - Forex, CFD, Futurex, Bonds and all others. Shows or hides symbols that have or do not have trade restrictions. Shows or hides symbols that currently have a trading/quoting session active. Shows or hides symbols that contain the specified words in their names. Closes or deleted all market or pending orders. Closes orders by type - Buy/Sell. Clears stop loss and take profit values. Downloads histor
FREE
MT5 to Telegram bot
Maksim Plotnikov
5 (1)
MT5 to Telegram Signals This utility is simple to use and supports a wide variety of settings: Pick your desired Telegram group and enter the bot token and the chat id Get notified when orders are placed, modified, executed, closed… or any combination of states Connect your broker account with Telegram and stop missing important notifications. Would you like to receive Telegram notifications? Are you looking for a simple way to share trade signals with your followers? Do you need to start docume
FREE
This is a decorative utility that replaces the standard marks of completed deals with "Kingdom Come: Deliverance" game style markers. In addition to the graphic display of the price and time of the transaction, the notes also contain a textual representation of the transaction volume. Running utility Drag the utility from the Navigator window to the desired graph. The utility does not use input parameters and does not require configuration. All trademarks available on the chart will be replaced
FREE
틱(Tick) 단위의 가격 추적과 차트 지연(Lag)이 전혀 없는 가볍고 실시간으로 작동하는 트레이딩 세션 시각화 도구입니다. Session Overlays Mastery Core는 차트를 어지럽히거나 터미널 속도를 저하시키지 않으면서 아시아, 런던, 뉴욕 트레이딩 세션을 깔끔하고 기관 투자가 수준의 뷰로 제공합니다. 새로운 봉이 닫힐 때마다 지워지고 다시 그려지며 깜빡이는 기존 세션 지표와 달리, Session Overlays Mastery Core는 과거 세션을 최초 1회만 처리하고 활성화된 세션은 매 틱마다 실시간으로 추적합니다. 극심한 시장 변동성이나 고영향 뉴스 스파이크 발생 시에도 가격이 활성 오버레이 영역 밖으로 벗어나지 않습니다. 주요 특징 실시간 틱 단위 가격 가두기: 활성화된 세션 상자가 실시간 가격 급등락에 맞춰 즉각 동적으로 확장됩니다. 캔들이 활성 오버레이 경계 밖으로 벗어나지 않습니다. 깜빡임 없는(Zero-Flicker) 아키텍처: 과거 세션 상자는 로드
FREE
MetaTrader 5 데이터를 Excel, Python, 외부 백테스트 또는 머신러닝으로 가져가고 싶은데, 불편한 내보내기 파일을 정리하느라 시간을 쓰고 싶지 않으신가요? Candle History Exporter는 현재 심볼의 캔들 히스토리를 research, 자동화, 정량 분석에 바로 활용할 수 있는 깔끔하고 설정 가능한 CSV 파일로 바꾸기 위해 만들어졌습니다. 원하는 날짜 범위 안에서 하나 또는 여러 타임프레임을 내보낼 수 있으며, 기본 종료 날짜로 현재 서버 시간을 자동 사용하도록 설정할 수 있습니다. 또한 이제 스크립트 입력값에서 어떤 열을 내보낼지 직접 선택할 수 있고, 기본값은 보다 풍부하고 실용적인 전체 출력 구성이 활성화되어 있습니다. 주요 기능 현재 차트 심볼의 캔들 히스토리를 내보냅니다. 분, 시간, 일, 주, 월 단위의 여러 타임프레임을 지원합니다. 현재 서버 시간을 기본 종료 날짜로 사용하며, 사용자 지정 종료 날짜도 설정할 수 있습니다. 스크립트 입력값
FREE
MediasBand
Andre Fonseca Loureiro
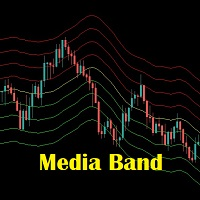
Media Band é um indicador que projeta 8 bandas paralelas a uma media movel de referencia. Podendo auxiliar na visualização da volatilidade do mercado financeiro.  Este indicador foi inspirado na necessidade de avaliar melhor uma boa oportunidade de compra e venda dos ativos de acordo com o "seu" operacional. Não pode ser utilizado como recomendação e sim a fins de estudos do Mercado Financeiro.
FREE
* This product was converted using  "BRiCK Convert4To5 MT4 "  based on the MQL4 source file of  "BRiCK Convert4To5 MT4 Free" . "Convert4To5" is a Script that converts MQL4 source files into MQL5 source files. Experts, Indicators, Scripts, and Libraries with extension ".mq4" will be available for MT5. Parameter None. Procedure 1. Open the following folder.     terminal_data_folder\MQL4\Files\ (in the terminal menu select to view "File" - "Open the data directory") 2. Confirm that the BRiCK_Conv
FREE
Core Positioning A lightweight risk calculation tool tailored exclusively for the MT5 platform, focusing on the core needs of traders' daily risk control calculations. It deeply optimizes the operation experience and data display effect, adapts to various chart viewing and trading scenarios such as intraday trading and swing trading, and is a highly practical auxiliary tool for traders' daily risk control operations. Core Functions Easy Lot Size Editing: Click the input box to enter values dire
FREE
이 제품의 구매자들이 또한 구매함
Trend Sniper X
Sarvarbek Abduvoxobov
4.86 (43)
Trend Sniper X 는 트레이더가 추세 방향과 잠재적 반전 지점을 명확하고 정확하게 포착할 수 있도록 도와주는 MetaTrader 5용 멀티 타임프레임 추세 추종 지표입니다. MT4용: https://www.mql5.com/en/market/product/193245 가격 정보: 현재 가격은 프로모션 할인가이며, 향후 업데이트 및 새로운 기능이 출시됨에 따라 변동될 수 있습니다. 보너스 혜택: 본 지표 전용 무료 자동매매 Assistant EA를 받으시려면 구매 후 작성자에게 메시지를 보내주시기 바랍니다. Code2Profit 채널 멀티 타임프레임 분석으로 시장을 마스터하세요! Trend Sniper X로 승률을 극대화하는 방법: 핵심 규칙 및 세션 팁 기술 사양 플랫폼 MetaTrader 5 지표 유형 멀티 타임프레임 추세 지표 운용 타임프레임 모든 차트 타임프레임 지원, 독립적으로 선택 가능한 상위 타임프레임(M1–MN1) 주요 상품 외환, 금(XAUUSD) 및 기타 C
Smart Trend Trading System — MetaTrader 5 구매 후 MQL5에서 저에게 메시지를 보내시면 Smart Universal Expert Advisor를 무료로 받으실 수 있으며, 온라인 강좌, PDF 매뉴얼 및 비공개 그룹 이용 권한도 함께 제공됩니다. STTS는 추세 방향, 진입·청산 신호, 반전 구간, 주요 가격 수준을 차트에 모아 보여줍니다. 시스템을 참고해 수동으로 거래하거나, 별도의 호환 EA를 연결하여 선택한 설정에 따라 자동으로 거래를 실행할 수 있습니다. 하나의 시스템, 네 가지 트레이딩 접근법 STTS의 트레이딩 접근법은 크게 네 가지로 나뉩니다. • 스캘핑 — 단기 신호와 시장 움직임을 살펴봅니다. • 추세 매매 — 방향을 평가하고 추세 안에서 기회를 찾습니다. • 반전 매매 — 잠재적인 전환 구간과 방향 변화를 파악합니다. • 거래량 매매 — 거래량 기반 정보로 시장 활동을 평가합니다. 진입·청산 화살표, 추세 정보, 지지·저항 수
새로운 왕의 등장 - 인디케이터 + 주문 관리 표시(TP1 + TP2 + TP3) + 선택형 텔레그램 시그널 전송 기능 포함 (무료) (완전한 트레이딩 및 시그널 시스템) 골드를 위한 최고의 EA: Gold Slayer 이 인디케이터는 고급 전략, 사용자 지정 가능한 주문 관리 시스템, 그리고 엔벨로프 확장을 결합한 평균 회귀(mean reversion) 시스템을 포함하고 있습니다. 또한 RSI와 같은 여러 지능형 확인 필터를 통해 높은 확률의 반전 진입 구간을 포착하여 BUY 및 SELL 시그널을 제공합니다. 단순히 거래 방법만 배우는 것이 아니라, 여러 포지션을 효과적으로 관리하고 이전에 수익 중인 오픈 포지션으로 손실 거래를 커버하는 방법까지 익힐 수 있습니다. M5 전용으로 설계 및 최적화되었으며, 유동성이 풍부해 시그널이 더 깔끔하고 신뢰도 높은 BTCUSD와 XAUUSD에서 뛰어난 성능을 발휘합니다. 이 인디케이터는 ATR 기반으로 자동 계산된 진입가, 손절가, 익절가와
Zoryk Gold
Reda El Koutbane
4.78 (18)
ZORYK — MetaTrader 5용 XAUUSD 전문 신호 및 트레이드 플래닝 시스템 이런 경험이 있을 것입니다. 골드를 분석하고 진입을 기다린 뒤 마침내 포지션을 열었지만 가격이 곧바로 반대 방향으로 움직입니다. 너무 일찍 청산하거나 Stop Loss를 옮기거나 몇 초 동안 망설입니다. 그 후 시장은 내가 없이도 처음 예상했던 목표까지 정확히 움직입니다. 문제는 항상 방향이 아니었습니다. 진짜 문제는 불확실성이었습니다. 정확한 진입 위치를 몰랐습니다. 어느 지점에서 원래의 트레이드 아이디어가 무효가 되는지 몰랐습니다. 가까운 수익을 확보해야 할지 더 큰 움직임을 기다려야 할지 판단하기 어려웠습니다. 현재 setup이 정말 강한지 아니면 단지 새로운 거래를 억지로 찾고 있는지도 확신하기 어려웠습니다. 골드는 매우 빠르게 움직입니다. 명확한 계획이 없다면 좋은 분석도 몇 초 만에 나쁜 결정으로 바뀔 수 있습니다. ZORYK는 이 문제를 해결하기 위해 개발되었습니다.
M5 Sniper
MeanFX
5 (3)
당신의 트레이딩 우위를 한눈에 확인하세요! M5 Sniper 는 MeanFX의 새로운 지표입니다. 정확한 트레이딩 신호 와 적응형 TP/SL 레벨 을 결합하여, 결과적으로 가능한 최고의 통계적 트레이딩을 만들어냅니다! 5회 구매마다 가격이 인상되며, 다음 가격은 69$입니다. 구매 후 저에게 메시지를 보내주시면 팁/가이드와 보너스 EA를 제공해 드립니다. 무엇이 이 지표를 특별하게 만들까요? Gold XAUUSD에서 검증된 통계적 성과 ( 거의 모든 자산에서 작동 하며, 일관된 결과 없이 모든 것을 다루려고 하기보다는 하나의 타임프레임을 완전히 익히는 데 집중합니다) 각 심볼당 하루 1~8회의 트레이드 와 높은 승률을 제공하며, 모든 통계적 우위를 우리의 편으로 가져갑니다. 차트에는 확인된 BUY 및 SELL 신호만 표시됩니다. 각 트레이드에 대해 지표가 생성하는 적응형 TP 및 SL 레벨 평균 승률 75%+ 평균 Signal Ratio 최소 1.1+ 알람 및 알림이 휴대폰 으로도
Ultra Indicator
Ihor Otkydach
5 (1)
ULTRA는 “올인원” 방식으로 작동하는 기술적 지표로, 시장을 독자적으로 분석하고, 매매 신호를 생성하며, 손절매 주문 설정 수준을 표시하고, 이익을 실현하거나 손실을 최소화하기 위해 포지션을 청산해야 할 시점을 제안합니다. 다시 말해, 시장을 분석하는 법을 모르거나, 가격 수준(손절매를 어디에 설정할지)을 파악하지 못하거나, 자금 관리에 어려움을 겪더라도 상관없습니다. ULTRA가 그 모든 것을 대신 해줄 테니까요! 구매자 특전 : ULTRA 지표를 구매하신 후, 저에게 비공개 메시지를 보내주시면 “ULTRA BOT”을 무료 선물로 드립니다. 이 도구는 해당 지표의 신호를 바탕으로 개설한 거래를 관리하는 데 도움을 주는 특별한 도구입니다(각 거래에 대해 손절매를 설정하고, 최상의 결과를 얻을 수 있도록 전략의 규칙에 따라 거래를 자동으로 청산해 줍니다).  또한 구매자분들께 다양한 자산에 바로 적용할 수 있는 설정값을 제공해 드리고 있으며, 이를 통해 지표가 최대 효율로 작동할
Entry Points Pro for MT5
Yury Orlov
4.52 (152)
2019년, 저는 이 지표가 무엇을 할 수 있는지 전 세계에 보여 주었습니다. 실계좌에서 지표의 시그널에 따라 수동으로, 모두가 볼 수 있게 공개적으로 거래했습니다 — 계좌는 Myfxbook에서 모니터링되었고, 저는 이 실험을 Facebook에 자세히 공유했습니다. 결과: 4개월 만에 10,000달러가 941,411달러가 되었습니다. 리스크는 의도적으로 극단적이었습니다 — 드로다운은 54%까지 이르렀습니다. 우리 직업에서 수익과 리스크는 언제나 함께 가기 때문입니다. Myfxbook 스크린샷은 갤러리의 첫 번째 이미지입니다. 아무래도 축하드려야 할 것 같습니다: 여러분의 탐색은 이제 끝났습니다. Entry Points Pro는 진입에서 추측을 없애고, 모든 트레이더가 찾는 것 — 확신과 평온함을 줍니다. 이 지표는 정말로 작동하고, 시그널을 절대 리페인팅하지 않으며, 그 결과를 여러분의 차트에서 곧바로 금액으로 보여 주기 때문입니다. 수많은 창과 서른 가지 설정, 그리고 작동하지도
SuperScalp Pro
Van Minh Nguyen
4.54 (37)
SuperScalp Pro - Professional Multi-Layer Confluence Scalping System SuperScalp Pro는 기존 Supertrend에 여러 지능형 확인 필터를 추가하여 기능을 강화한 고급 스캘핑 지표입니다. 잘못된 신호를 크게 줄이면서 성공 가능성이 더 높은 Buy/Sell 거래 기회를 식별하는 데 도움을 줍니다. 명확한 Buy 및 Sell 화살표가 차트에 직접 표시되며, ATR 기반 Stop Loss 및 Take Profit 레벨도 실시간으로 자동 계산됩니다. 구매 후 MQL5 메시지로 저에게 연락하시면 SuperScalp Pro Auto Trader EA를 무료로 받으실 수 있으며, 사용자 가이드와 비공개 그룹 이용 권한도 제공됩니다. 권장 설정 파일 다운로드: [Set File] 전체 문서는 제품 블로그에서 확인할 수 있습니다: [User Guide] 업데이트를 받으려면 공식 채널에 참여하세요: [Official Channel]
Gann Made Easy MT5
Oleg Rodin
5 (13)
Gann Made Easy 는 mr.의 이론을 사용하여 최고의 거래 원칙을 기반으로 하는 전문적이고 사용하기 쉬운 Forex 거래 시스템입니다. W.D. 간. 이 표시기는 Stop Loss 및 Take Profit Levels를 포함하여 정확한 BUY 및 SELL 신호를 제공합니다. PUSH 알림을 사용하여 이동 중에도 거래할 수 있습니다. 구매 후 거래 방법 안내 및 유용한 추가 지표를 무료로 받으시려면 저에게 연락주세요! 아마도 Gann 거래 방법에 대해 이미 여러 번 들었을 것입니다. 일반적으로 Gann의 이론은 초보자 거래자뿐만 아니라 이미 거래 경험이 있는 사람들에게도 매우 복잡한 것입니다. Gann의 거래 방식은 이론적으로 적용하기 쉽지 않기 때문입니다. 나는 그 지식을 연마하고 Forex 지표에 최고의 원칙을 적용하기 위해 몇 년을 보냈습니다. 표시기는 적용하기가 매우 쉽습니다. 차트에 첨부하고 간단한 거래 권장 사항을 따르기만 하면 됩니다. 지표는 지속적으로 시장 분석
SMC Intraday Formula
VividMind Digital Solutions
5 (26)
먼저 솔직하게 말하겠습니다. 어떤 인디케이터도 단독으로 당신을 수익성 있게 만들어주지 않습니다. 누군가 그렇게 말한다면, 그는 당신에게 꿈을 파는 것입니다. 완벽한 매수/매도 화살표를 보여주는 모든 인디케이터는 완벽하게 보이도록 만들 수 있습니다 — 단지 올바른 과거 구간을 확대하고 승리한 거래만 캡처하면 됩니다. 우리는 그렇게 하지 않습니다.  SMC Intraday Formula는 도구입니다. 시장 구조를 읽고, 가장 높은 확률의 가격 구간을 표시하며, 현재 스마트 머니의 흐름이 어떻게 보이는지 아주 단순한 언어로 보여줍니다. 최종 결정은 여전히 당신이 합니다. 실행도 당신이 합니다. 하지만 이제는 희망이 아니라 정확성으로 거래하게 됩니다. 우리는 이 인디케이터를 지난 약 3년 동안 골드(XAUUSD) 및 주요 외환 통화쌍의 데이 트레이딩 스캘핑에 사용해 왔습니다. M1, M5, M15, M30에서 우리의 핵심 도구입니다. 이 도구는 미래를 예측하려 하지 않습니다 — 지금 형성
M1 Sniper MT5
Oleg Rodin
5 (7)
M1 SNIPER 는 사용하기 쉬운 거래 지표 시스템입니다. M1 시간대에 맞춰 설계된 화살표 지표입니다. 이 지표는 M1 시간대 스캘핑을 위한 단독 시스템으로 사용할 수 있으며, 기존 거래 시스템의 일부로도 사용할 수 있습니다. 이 거래 시스템은 M1 시간대 거래용으로 특별히 설계되었지만, 다른 시간대에도 사용할 수 있습니다. 원래는 XAUUSD와 BTCUSD 거래를 위해 이 방법을 설계했지만, 다른 시장 거래에도 유용하다는 것을 알게 되었습니다. 이 지표의 신호는 추세 방향과 반대로 거래될 수 있습니다. 저는 지표의 신호를 활용하여 양방향으로 거래할 수 있도록 돕는 특별한 거래 기법을 알려드립니다. 이 방법은 특별한 동적 지지선과 저항선 가격 영역을 활용하는 것을 기반으로 합니다. 구매하시면 M1 SNIPER 화살표 지표를 바로 다운로드하실 수 있습니다. 또한, 아래 스크린샷에 표시된 Apollo Dynamic SR 지표는 M1 SNIPER 도구를 사용하는 모든 사용자에게 무료로
GoldenX Entry MT5
VividMind Digital Solutions
5 (17)
GoldenX Entry는 MT5용 인디케이터로, 적응형 Smart Entry Trend 알고리즘, 신호 스코어링 시스템, 시장 레짐 감지 기능, 그리고 변동성 필터를 포함합니다. 각 신호에는 계산된 진입 레벨, 3개의 익절(TP1, TP2, TP3) 레벨, 그리고 손절(Stop-Loss) 레벨이 포함됩니다. 이 인디케이터는 다양한 시장 환경에 적응하도록 설계된 다중 분석 레이어 구조 위에 구축되어 있으며, 내장 최적화기와 통계 추적 시스템을 결합합니다. 또한 Risk-to-Reward(RR) 지표와 과거 거래 행동 기반의 정량 분석을 제공합니다. 시작은 간단합니다 — 선택한 타임프레임에서 최적화기를 실행한 뒤 차트에서 바로 인디케이터를 사용하면 됩니다. 핵심 기능 GoldenX Entry는 하나의 차트에서 신호 엔진, 트레이드 관리 기능, 그리고 과거 통계 추적을 통합합니다: - 내장 최적화기: 최적화기는 차트에서 원클릭으로 실행됩니다. 200개의 파라미터 조합을 두 단계 탐색
Gold Entry Sniper
Tahir Mehmood
5 (21)
Gold Entry Sniper – 골드 스캘핑 & 스윙 트레이딩을 위한 전문 다중 시간 프레임 ATR 대시보드 Gold Entry Sniper 는 XAUUSD 및 기타 종목에 대해 정확한 매수/매도 신호 를 제공하는 고급 MetaTrader 5 지표입니다. ATR 트레일링 스톱 로직 과 다중 시간 프레임 분석 을 기반으로 설계되어 스캘핑과 스윙 트레이딩 모두에 적합합니다. 주요 기능 및 장점 다중 시간 프레임 분석 – M1, M5, M15 추세를 한눈에 확인. ATR 기반 트레일링 스톱 – 변동성에 따라 자동 조정. 전문 차트 대시보드 – 신호 상태, ATR 레벨, 회귀선, 매매 방향 표시. 명확한 매수/매도 마커 – 자동 화살표와 텍스트 라벨. 종료 알림 & 거래 관리 – 수익 보호를 위한 자동 종료 감지. 완전 사용자 설정 가능 – 대시보드 위치, 색상, ATR/회귀선 파라미터 조정. 골드(XAUUSD) 최적화 – M1~M15 스캘핑에 완벽, 외환/지수/암호화폐에도 적용 가능.
다음 업데이트 — 버전 2.52 곧 출시! [신규] 시장 분석 및 트레이딩 워크플로를 향상시키기 위해 설계된 4가지 주요 신규 기능을 기대해 주세요. 트레이딩 요구 사항을 충족하도록 설계된 4가지 새로운 기능으로 시장 분석을 한 단계 더 발전시킵니다. 다음 기능을 소개합니다: 1. TRADE OVERVIEW DASHBOARD 2. CONFLUENCE AT ZONE 3. STRONG & WEAK HIGH/LOW 4. OTE 1. TRADE OVERVIEW DASHBOARD 시장 전체 상황을 더 쉽게 파악할 수 있도록 도와주는 대시보드입니다. 트레이딩 의사결정을 지원하는 가이드를 제공하며, 하나의 화면에서 시장을 분석하고 체계적으로 트레이딩을 계획할 수 있도록 도와줍니다. 멀티 타임프레임 시장 개요 (Multi-Timeframe Market Overview) 시장 방향과 가격 구조를 더욱 명확하게 파악 시장 상황을 빠르게 확인 체계적인 시장 분석 및 진입 계획을 위한 가이드 2. CO
Gold Trend Coach MT5
Cristhian Alexander Gaibor Cuasquer
5 (4)
Gold Trend Coach는 MetaTrader 5용 금(XAUUSD) 추세 지표로, 캔들 마감에 확정되는 매수·매도 신호(리페인트 없음), 손절과 세 개의 익절 목표, 진입부터 TP3까지 안내하는 코치, 멀티 타임프레임 패널, 휴대폰과 텔레그램 알림을 제공합니다. 런던·뉴욕 세션의 M1·M5 스캘핑과 M15 데이 트레이딩용으로 만들었습니다. 보너스: Gold Trend Coach 자동매매 EA 무료 제공. 구매 후 메시지를 주시면 지표 신호로 자동 매매하는 EA와, 모든 신호·진입·손절·도달한 목표를 텔레그램 채팅, 그룹 또는 채널로 보내는 Telegram Alert Bridge를 set 파일과 설치 가이드와 함께 보내 드립니다. 출시 가격 $39는 처음 20개 한정이었고 이미 매진되었습니다. 현재 가격 40개까지 $45, 이후 $59. 예정된 최종 가격 $79. 아마 이미 수십 개의 금 지표를 써 보셨을 겁니다. 대부분은 화살표로 매수·매도 신호만 주고 가장 어려운 부분, 즉
Atomic Analyst MT5
Issam Kassas
4.5 (64)
Atomic Analyst — MetaTrader 5 구매 후 MQL5에서 저에게 메시지를 보내시면 Smart Universal Expert Advisor를 무료로 받으실 수 있으며, 온라인 강좌, PDF 매뉴얼 및 비공개 그룹 이용 권한도 함께 제공됩니다. Atomic Analyst는 가격 움직임 분석, 추세 방향, 진입·청산 신호, 손절 수준, 여러 익절 수준을 차트에 모아 보여줍니다. 신호를 확인하고 매매 상황을 이해하세요 Atomic Analyst는 분석 결과를 명확한 시각 정보로 정리합니다. • 잠재적인 진입 기회를 확인할 수 있는 매수·매도 화살표. • 거래 계획에 도움이 되는 손절 수준과 여러 익절 수준. • 시장 방향을 평가할 수 있는 추세, 강도, 모멘텀 수치. • 더 넓은 시장 맥락을 비교할 수 있는 여러 시간대 분석. • 변화하는 시장 상황을 따라갈 수 있는 색상별 캔들과 알림. 신호와 보조 분석을 함께 검토한 다음, 해당 매매 상황이 자신의 거래 규칙에
Boba Analysis Suite
Trade Ready Solutions LLC
5 (2)
Boba Analysis Suite Boba Analysis Suite는 MetaTrader 5용 분석 지표입니다. 시장 구조, 주요 가격 영역, 전반적인 시장 상황을 하나의 차트 화면에 통합하여 표시합니다. 트레이더이자 트레이딩 코치로서의 실무 경험을 바탕으로 개발되었으며, 시장 방향 평가, 주요 가격 수준 식별, 여러 시간대의 종합적인 분석 등 체계적인 분석 과정을 지원합니다. 시장 맥락을 고려한 분석 개별 신호의 의미는 시장 상황에 따라 달라집니다. Boba Analysis Suite는 현재 차트 상황을 더 넓은 시장 구조와 연결하고, 사전에 정한 규칙에 따라 매매 아이디어를 검토할 수 있도록 돕습니다. 주요 분석 기능은 다음과 같습니다. 추세 및 시장 구조: 시장 방향과 관련 구조적 맥락을 평가합니다. 주요 가격 영역 및 수준: 추가 분석이 필요한 중요한 영역을 차트에 시각적으로 표시합니다. 여러 시간대: 서로 다른 시간대의 정보를 통합하여 전반적인 시장 상황을 평가합니다.
Adaptive Price Action Engine 지표를 구매하면 EA(자동매매 프로그램)가 무료 멀티 타임프레임 기반 자기 최적화 추세 & 캔들 패턴 분석 시스템 시장은 끊임없이 변화하며, 모든 Price Action 패턴이 모든 시장 환경에서 동일한 가치를 가지는 것은 아닙니다. Adaptive Price Action Engine 은 변화하는 시장 환경에 적응할 수 있도록 설계되었으며, 추세 구조, 멀티 타임프레임 분석, 캔들 패턴 및 통계적 최적화 를 하나의 분석 프레임워크로 결합합니다. 두 가지 적응형 모드 Dual Alpha Trend Mode 낮은 타임프레임과 높은 타임프레임에서 적합한 Alpha Trend 파라미터를 자동으로 탐색하여, 최근 시장 움직임에 맞춰 추세 분석을 조정합니다. Candlestick + Alpha Mode Alpha Trend를 통한 시장 국면 분석과 22개의 상승 및 하락 캔들 패턴 을 결합합니다. 모든 패턴을 동일하게 취급하는 대신, 다양
Azimuth Pro
Ottaviano De Cicco
5 (7)
Azimuth Pro V2: Synthetic Fractal Structure and Confirmed Entries for MT5 Overview Azimuth Pro is a multi-level swing structure indicator by Merkava Labs . Four nested swing layers, swing-anchored VWAP, ABC pattern detection, three-timeframe structural filtering, and closed-bar confirmed entries — one chart, one workflow from micro-swings to macro-cycles. This is not a blind signal product. It is a structure-first workflow for traders who care about location, context, and timing. Halloween P
Auto Optimized SpeedAngle 은 지속적인 워크포워드 최적화(Walk-Forward Optimization, WFO)를 통해 곡선 적합(curve-fitting)을 제거한 기관 수준의 모멘텀 벡터화 시스템입니다. 시장 체제가 바뀔 때 성능이 떨어지는 정적 입력에 의존하는 대신, 이 지표는 표본 외(Out-of-Sample, OOS) 검증을 사용하여 매개변수를 동적으로 재보정하며, 표시되는 신호가 과거의 우연이 아닌 진정한 통계적 우위를 나타내도록 보장합니다. 핵심 기관용 프레임워크 워크포워드 최적화 엔진: 핵심 알고리즘은 수천 가지의 룩백(lookback) 및 임계값 조합을 지속적으로 스캔하며, 데이터를 인샘플(in-sample)과 표본 외(out-of-sample) 세트로 엄격하게 분리합니다. 미지의 데이터 환경에서 수학적 우수성이 증명된 경우에만 새로운 매개변수 구성을 채택합니다. 정량적 목적 함수: 순수한 총이익을 쫓는 대신, 최적화 엔진은 기관 수준의 안정성
Zain Gold Scalping
Ahmed Gamal Abdel Nasser Mohamed
A complete price-action analysis tool built around dual independent entry logic, each confirmed against a volatility band, combined with a configurable set of nine optional confirmation filters that let you shape exactly how conservative or aggressive the tool's signals behave. Core Strategy Two independent entry setups, each triggering only when price moves outside a dynamic volatility band — giving two distinct ways to spot potential reversal points, which can be used together or separately.
Tokyo mt5 Indicator
Vasiliy Strukov
5 (14)
Tokyo Indicator는 추세 방향, 잠재적 거래 신호 및 시장 상황을 명확하고 시각적으로 보여줍니다. 색상으로 구분된 계단식 추세선은 강세 구간(파란색)과 약세 구간(자홍색)을 명확히 구별해 줍니다. 추세가 전환될 때 나타나는 방향성 화살표는 잠재적인 매수 및 매도 기회를 강조하여 보여줍니다. 통합 대시보드는 현재 신호, 시장 성향(bias), 모멘텀, 변동성, 신호 품질 등의 정보를 한눈에 파악할 수 있도록 구성되어 있습니다. 이를 통해 트레이더는 별도의 패널을 오갈 필요 없이 가격 움직임(price action)과 지표의 데이터를 동시에 분석할 수 있습니다. 깔끔한 차트 화면과 간결한 시장 개요를 제공하는 Tokyo Indicator는 체계적인 추세 분석과 거래 결정을 지원합니다. 모든 시간대와 다양한 자산(특히 금)에서 활용할 수 있습니다. 추세 방향, 잠재적 거래 신호 및 시장 상황을 명확하고 시각적으로 보여줍니다. 색상으로 구분된 계단식 추세선은 강세 구간(파란색)
FiboSniper Pro
Van Minh Nguyen
5 (4)
FiboSniper Pro – Multi-Filter Fibonacci System with Auto SL/TP and Control Panel FiboSniper Pro는 동적 Fibonacci Envelopes와 여러 확인 필터를 결합하여 선별된 Buy 및 Sell 신호를 생성하는 기술적 지표입니다. Fibonacci 레벨은 Moving Average와 ATR을 기반으로 계산된 후 ADX, EMA, RSI, ATR, Volume, Time 및 Candle 구조를 통해 필터링됩니다. 이 지표는 ATR 기반의 자동 Stop Loss 및 Take Profit 레벨을 차트에 직접 표시하며, 빠른 설정 조정을 위한 인터랙티브 Control Panel을 제공합니다. 구매 후 MQL5 메시지로 저에게 연락하시면 Auto Trader X를 무료로 받으실 수 있으며, 이 지표의 거래 신호를 자동화하는 방법에 대한 안내도 제공됩니다. User Guide 및 Set Files: [Click here
Quantum TrendPulse
Bogdan Ion Puscasu
5 (26)
SuperTrend   ,   RSI   ,   Stochastic   의 힘을 하나의 포괄적인 지표로 결합하여 트레이딩 잠재력을 극대화하는 궁극의 트레이딩 도구   인 Quantum TrendPulse를   소개합니다. 정밀성과 효율성을 추구하는 트레이더를 위해 설계된 이 지표는 시장 추세, 모멘텀 변화, 최적의 진입 및 종료 지점을 자신 있게 식별하는 데 도움이 됩니다. 주요 특징: SuperTrend 통합:   주요 시장 추세를 쉽게 따라가고 수익성의 물결을 타세요. RSI 정밀도:   매수 과다 및 매도 과다 수준을 감지하여 시장 반전 시점을 파악하는 데 적합하며 SuperTrend 필터로 사용 가능 확률적 정확도:   변동성이 큰 시장에서 숨겨진 기회를 찾기 위해 확률적 진동   을 활용하고 SuperTrend의 필터로 사용 다중 시간대 분석:   M5부터 H1 또는 H4까지 다양한 시간대에 걸쳐 시장을 최신 상태로 유지하세요. 맞춤형 알림:   맞춤형 거래 조건이 충족되면
Superhero
Ihor Otkydach
5 (3)
SUPERHERO 지표는 “올인원” 방식으로 설계된 다중 통화 거래 시스템입니다. 이 지표는 시장을 독자적으로 분석하여 포지션을 개설하고 청산할 시점에 대한 신호를 제공합니다. 손절매(Stop Loss) 및 익절(Take Profit) 주문을 활용하며, 위험 대비 수익 비율(R:R)은 1:1입니다. 이 시스템은 스마트폰으로 푸시 알림을 전송할 수 있으므로, PC에 묶여 있을 필요 없이 “이동 중에도” 매매를 할 수 있습니다. 이는 자체 거래 전문 회사에 안성맞춤입니다. 모든 고객님께 드리는 특별 혜택: 이 지표를 구매하시는 모든 분께는 제가 특별히 준비한 유틸리티를 선물로 드릴 예정이며, 이 유틸리티는 다음과 같은 기능을 제공합니다: 손절매 및 익절 주문을 자동으로 설정합니다 가격이 목표 수준에 도달하면 자동으로 포지션을 청산합니다 미결제 주문 거래를 지원합니다 평균화 거래 모드를 지원합니다 이 훌륭하고 매우 편리한 유틸리티를 선물로 받고 싶으시다면, SUPERHERO 지표를 구매하
Dynamic Forex28 Navigator MT5
Bernhard Schweigert
5 (1)
다중 통화 강도 및 모멘텀 지표 MT5 Dynamic Forex28 Navigator는 오랫동안 사랑받아 온 저희 지표의 진화 버전으로, 세 가지 기능을 하나로 결합했습니다: Advanced Currency Strength28 Indicator (리뷰 700개) Advanced Currency IMPULSE with ALERT (리뷰 530개) CS28 Combo Signals (최근 보너스) 두 이전 지표는 MQL5 Market에서 합계 1,200개가 넘는 리뷰를 받았으며 2016년부터 MT4 커뮤니티의 필수품이었습니다. Dynamic Forex28 Navigator MT5는 검증된 동일한 로직을 그대로 이어갑니다. MetaTrader 5를 위해 완전히 다시 제작 – MT5의 네이티브 다중 심볼 아키텍처를 최대한 활용하도록 설계되었습니다. 사용 설명서: https://www.mql5.com/en/blogs/post/758844 MT4 버전을 찾고 계신가요? 여기를 클릭하세요: ht
Trend Catcher ind mt5
Ramil Minniakhmetov
5 (18)
트렌드 캐처 인디케이터 트렌드 캐처 인디케이터는 개발자가 자체 개발한 맞춤형 적응형 트렌드 분석 지표들을 조합하여 시장 가격 움직임을 분석합니다. 단기적인 노이즈를 제거하고 근본적인 모멘텀 강도, 변동성 확대, 가격 구조 움직임에 집중하여 진정한 시장 방향을 파악합니다. 또한 이동 평균, RSI, 변동성 필터와 같은 맞춤형 지표들을 활용하여 가격을 평활화하고 트렌드를 필터링합니다. 실제 운영 모니터링 및 기타 제품은 다음 링크에서 확인하실 수 있습니다:   https://www.mql5.com/en/users/mechanic/seller 텔레그램에서는 EA나 설정 파일을 판매하지 않습니다. 사기이니 주의하세요. 모든 설정 파일은 블로그에서 무료로 제공됩니다. 중요! 구매 후 즉시 연락 주시면 사용 방법 및 보너스를 드립니다!
Apex Patterns PRO 인디케이터 구매 시 - 기반 Expert Advisor 무료 제공. 자체 최적화 차트 패턴 및 브레이크아웃 분석 시스템 기존의 패턴 스캐너는 고정된 파라미터에 의존하므로 시장 변동성과 구조가 변화할 때 성능이 저하되는 경우가 많습니다. Apex Patterns PRO는 구조적 차트 패턴 인식, 모멘텀 필터링, 통계적 자체 최적화를 하나의 분석 프레임워크로 결합하여 변화하는 시장 환경에 적응하도록 설계되었습니다. 적응형 스캐닝 엔진 자체 최적화 패턴 모드 최근 과거 데이터를 바탕으로 적절한 패턴 파라미터를 자동으로 탐색하여, 정적인 설정 대신 현재 시장 행보에 맞춰 인디케이터의 구조 감지 방식을 적응시킵니다. 스마트 브레이크아웃 필터링 클래식 패턴 인식과 모멘텀, 거래량, 프라이스 액션 지표를 결합합니다. 모든 브레이크아웃을 동일하게 다루는 대신, 시장의 기저 구조를 평가하여 현재 통계적 환경에 부합하는 셋업을 식별합니다. 주요 기능 리페인트 없는 고
Neuro Poseidon MT5
Daria Rezueva
4.75 (52)
Neuro Poseidon is a new indicator by Daria Rezueva. It combines precise trading signals with adaptive TP/SL levels - creating best possible trades as a result! Message me and get  Neuro Poseidon Assistant  as a gift to automize your trading process! What makes it stand out? 1. Proven profitability on all assets and timeframes 2. Only confirmed BUY and SELL signals present on the chart 3. Adaptive TP & SL levels generated by the software for each trade 4. Easy to understand - suitable for al
Crystal Heikin Ashi Signals
Muhammad Jawad Shabir
5 (5)
Crystal Heikin Ashi Signals—Professional Trend & Signal Detection Indicator Advanced Heikin Ashi Visualization with Intelligent Signal System for Manual & Automated Trading Final Price: $149 ---------> Price goes up $10 after every 10 sales . Limited slots available — act fast . Overview User Guide PDF Crystal Heikin Ashi Signals is a professional-grade MetaTrader 5 indicator that combines pure Heikin Ashi candle visualization with an advanced momentum-shift detection system. Designed for both m
제작자의 제품 더 보기
Pivot Stop Gold
Vasilii Makarenko
Pivot Stop Gold는 금의 한 가지 상황을 중심으로 만들어졌습니다. 가격이 스윙에서 전환한 뒤 그 스윙을 통과해 움직이는 상황입니다. EA는 그 움직임을 쫓지 않습니다. 가격이 그곳에 도달하기 전에 이미 스톱과 목표가가 붙은 지정가 스톱 주문이 스윙 근처에서 대기하고 있습니다. 포지션은 짧습니다. 아래 보고서에서 평균 포지션은 5분 동안 유지되었습니다. 피벗 레벨 작업 타임프레임의 새 봉이 생길 때마다 EA는 최근 300개 봉으로 ZigZag를 만들고 가장 최근의 피벗 두 개를 취하며, 아직 형성 중인 봉은 절대 세지 않습니다. 그 둘 중 더 오래된 것이 고점이면 Buy Stop이 그 바로 아래에 놓입니다. 더 오래된 것이 저점이면 Sell Stop이 그 바로 위에 놓입니다. 거리는 프로필에 속하는 고정 오프셋입니다. 가격이 레벨의 0.10 이내에 있거나 이미 그 너머에 있으면 주문은 놓이지 않으며, EA는 한쪽당 최대 하나의 주문 또는 포지션만 유지합니다. 지정가 주문은
Swept Liquidity Pools
Vasilii Makarenko
5 (1)
A liquidity sweep is a bar that pushes past a prior swing high or swing low, where protective stop orders tend to rest, and then closes back on the inner side of that level. The same event is known under several names: a stop hunt, a stop run, a liquidity grab, a false breakout, a failed breakout, or a swing failure. Swept Liquidity Pools marks those levels and those bars on the chart. The indicator tracks liquidity pools - confirmed swing levels that have not yet been taken - and marks the exac
FREE
Auto Level Map
Vasilii Makarenko
What Gets Drawn Most level tools mark every swing they can find, and a chart with forty lines answers nothing. This one keeps a level only when price came back to it, and prints the evidence next to the line: the number of touches and the age in days. Lines above current price and lines below it are drawn in different colours, so the map reads at a glance without counting. What Puts A Level On The Chart A swing high is a bar whose high is not lower than its neighbours on both sides, within the n
FREE
Session Value Desk
Vasilii Makarenko
Three Anchors On One Chart Most volume weighted average lines restart once a day. This one draws three at the same time: one anchored to the current trading session, one to the day, one to the week. Their spread tells you something a single line cannot. When the session line sits far under the weekly one, the week has been trading higher than today is; when all three sit together, the market has spent the week in one place. Why The Session Anchor Is Not Midnight The session line starts where the
FREE
Hourly Spread Map
Vasilii Makarenko
Hourly Spread Map answers one question: at which hours does this symbol cost more to enter, and by how much. It reads the spread field that the terminal stores in every closed M1 bar of your own broker feed, sorts those measurements into 24 hours by 7 days of the week, and shows the result as a grid in the indicator sub-window. What It Measures Every closed M1 bar carries one spread measurement. The indicator collects them over the period you choose, groups them by the hour and weekday of the ba
FREE
Trade Risk Desk answers one question at the moment you need it answered: what volume makes this stop cost exactly what you decided to risk. Drag the stop line to where it belongs on the chart and the panel prints the volume, the money behind it, and the margin the position will hold. What It Answers Set the risk as a percent of balance or as a fixed amount in account currency. Put the stop where your idea says it belongs. The panel reads the symbol settings your broker publishes and prints: the
FREE
Candle Clock Desk
Vasilii Makarenko
What It Shows Candle Clock Desk puts four lines on the chart. The first is the time left until the current bar closes. The next three answer a question the clock alone cannot: is this bar unusually busy, or unusually quiet, right now. Bar closes in - the countdown, in minutes and seconds So far - volume this bar has accumulated since it opened Usual here - what this symbol had accumulated by this same minute, in the past Pace - the first divided by the second The Pace Line Pace of 1.00 means the
FREE
Range Zones M30
Vasilii Makarenko
Range Zones M30 draws zones on your chart where price was pushed back hard on the 30-minute timeframe. It works on any symbol and any chart timeframe, and reads only the prices your terminal already has. It does not use any server, does not send anything out, and does not open or change orders. What It Shows A resistance zone above the market and a support zone below it, as filled rectangles that start at the open of the swing candle that formed them and run to the right. At any moment there is
Signal Confirm
Vasilii Makarenko
Signal Confirm watches one symbol and tells you when a trend setup has passed a fixed chain of checks. It works on any symbol and any chart timeframe. It reads only the M1 prices, the prices of the oscillator timeframe (M5 by default) and the daily prices your terminal already has, does not use any server, does not send anything out, and does not open, change or close orders. It shows what happened and when; the decision stays with you. What It Does When the chain below is complete, the indicato
Volatility Dots
Vasilii Makarenko
Volatility Dots puts a trailing line of dots on your chart. In an uptrend the dots sit under the price, in a downtrend above it, and they flip when price closes through the opposite band. It works on any symbol and any timeframe. It reads only the prices your terminal already has, does not use any server, does not send anything out, and does not open or change orders. What It Shows One dot per bar. White dots under the candles mark a rising trend, red dots above the candles mark a falling trend.
Daily Range Ladder
Vasilii Makarenko
Daily Range Ladder draws six horizontal levels across the current trading day. The distances come from how far the symbol usually travels in a day, so the levels adapt to every symbol without any setting. It works on any symbol and any chart timeframe. It reads only the daily bars your terminal already has, does not use any server, does not send anything out, and does not open or change orders. What It Shows Three resistance levels above the day's low and three support levels below the day's hig
유동성 풀은 아직 회수되지 않은 확정된 스윙 고점 또는 스윙 저점입니다. 유동성 스윕은 가격이 그 레벨을 넘어 거래된 후 다시 범위 안으로 종가를 형성하는 바로 그 봉입니다 - 트레이더들이 스톱 헌트, 스톱 런, 유동성 그랩 또는 거짓 돌파라고도 부르는 동일한 이벤트입니다. Liquidity Sweep Pools MTF는 현재 차트와 선택한 상위 타임프레임에서 풀과 그 풀에서 발생한 유동성 스윕을 모두 표시하며, 활성 풀의 실시간 패널, 풀 형성 시의 거래량 필터, 감지된 스윕의 CSV 내보내기를 추가합니다. 여기서 다중 타임프레임 확인이란 각 유동성 스윕을 눈앞의 차트를 떠나지 않고 상위 타임프레임의 풀과 대조하여 읽을 수 있다는 뜻이며, 두 레벨 세트가 각자의 색으로 나란히 그려집니다. 표시하는 것 한 가지, 정확히: 풀의 기하학입니다. 그리는 모든 풀은 가격 레벨, 방향, 거리, 나이를 가지며, 동일한 네 가지 값이 패널과 CSV 파일에 들어갑니다. 그것이 전체 어휘입니다. 그
Structure Desk
Vasilii Makarenko
MetaTrader 5용 XAUUSD 전문가 어드바이저입니다. 한 번에 하나의 바스켓으로 작동합니다: 고정된 서버 시간대에 진입하고, 가격이 불리하게 움직이는 동안 포지션에 추가하며, 바스켓 전체를 함께 청산합니다. 개별 포지션에는 손절매도 익절도 없습니다. 거래 방식 하나의 심볼, XAUUSD, 한 번에 하나의 바스켓, 같은 방향으로 최대 5개의 주문. 진입은 고정된 서버 시간대에만 허용되며, 가격이 4시간 범위의 가장자리에 있을 때만 가능합니다. 서버 시간 14:00에서 22:00 사이에는 진입이 차단됩니다. 가격이 바스켓에 불리하게 움직이는 동안, 전문가 어드바이저는 달러 단위의 고정된 거리에서 주문을 추가하며, 주문 사이에는 최소 60초의 일시 정지가 있습니다. 바스켓은 전체로 청산됩니다: 계좌 통화 기준 목표, 진입 시간에 따라 달라지는 가격 목표, 또는 목표가 설정된 후의 트레일링 반납에 의해 청산됩니다. 주문 볼륨은 계좌 잔고에 따라 조정됩니다. 추가된 주문은 동일한 볼
Sarveon
Vasilii Makarenko
Sarveon은 MetaTrader 5의 XAUUSD용 전문가 자문입니다. 하나의 차트에서 동시에 실행되는 아홉 개의 독립 전략이 있습니다. 각 전략은 고유한 매직 넘버, 고유한 진입 시간대 및 고유한 거리 집합을 가지고 있으며, 다른 전략이 연다 포지션에 절대 추가되지 않습니다. 거래 방식 각 전략은 자체 진입 시간대의 최근 바를 스캔하여 스윙 레벨을 찾습니다: 이후 바가 초과하지 않은 고점 또는 이후 바가 깨지 않은 저점. 이 레벨은 현재 가격으로부터 최소 거리 이상 떨어져 있어야 하며, 그렇지 않으면 무시됩니다. 진입은 해당 레벨에 고정된 달러 오프셋을 두고 대기 중인 스톱 주문으로 배치됩니다. 매수 스톱은 저항 레벨 위가 아니라 아래에 위치하므로, 가격이 레벨에 도달하고 있을 때 주문이 체결되고, 레벨을 돌파한 후가 아닙니다. 손절매와 이익실현은 주문이 배치될 때 첨부되며, 주문 가격을 기준으로 측정됩니다, 체결 가격이 아니라. 각 전략은 동시에 보유할 수 있는 대기 주문 수
Ridgeline
Vasilii Makarenko
Ridgeline은 금이 건드리지 않은 가격대에서 기다립니다. 일봉을 읽고, 이후 어떤 봉도 돌파하지 못한 고점과 저점을 표시하고, 그곳에 예약 스톱 주문을 둡니다. 일곱 개의 규칙 세트가 서로 다른 역사적 깊이에서 탐색하므로, 하나는 지난주에 형성된 레벨에서 기다리고 다른 하나는 석 달 전의 레벨을 지켜볼 수 있습니다. 손실을 본 세트는 이틀 동안 물러난 뒤에야 다시 주문을 넣습니다. 각 세트는 고유한 매직 넘버와 고유한 거리를 가지며, 어떤 세트도 다른 세트가 연 포지션에 추가하지 않습니다. 손실 거래는 스톱으로 청산되며, 절대 물타기하지 않고 절대 두 배로 늘리지 않습니다. 레벨을 찾는 방법 각 세트는 일봉을 읽고 한 가지를 찾습니다: 형성된 이후 시장이 돌파하지 않은 레벨입니다. 저항은 그 이후의 모든 봉보다 높고 바로 앞의 봉들보다도 높은 일봉 고점입니다. 지지는 그 거울상입니다. 가격이 이미 지나간 레벨은 더 이상 레벨이 아니며, 세트는 다음 레벨로 넘어갑니다. 레벨은 또
Sixfold Gold
Vasilii Makarenko
Sixfold Gold trades XAUUSD on the hourly chart. It looks for the points where the market turned and left an extreme behind, places a pending stop order a little inside that level, and attaches a stop loss and a take profit before the order is ever filled. Six zones do this independently, each with its own search depth, and between them they read three timeframes and four sessions, so the advisor is rarely committed to a single view of the market. A trade that goes wrong is closed by its stop. No
GhBreak
Vasilii Makarenko
GhBreak는 금에 대한 하나의 아이디어를 기반으로 합니다: 형성된 이후 유지되어 온 스윙 고점 또는 저점의 돌파는 실패한 돌파들을 보상할 만큼 충분히 멀리 갈 수 있다는 것입니다. EA는 돌파를 추격하지 않습니다. 가격이 그곳에 도달하기 전에 대기 중인 스톱 주문이 이미 해당 레벨에 스톱과 목표를 붙인 채로 기다리고 있습니다. 포지션은 짧게 보유됩니다: 아래 보고서에서 평균 포지션은 22분 동안 지속되었습니다. 스윙 레벨 각 규칙 세트는 시간별 데이터로부터 자체 봉 - H2, H4 또는 D1 - 을 만들고 가장 최근의 스윙을 찾습니다: 왼쪽의 정해진 수의 봉보다 위에 서 있고, 오른쪽의 정해진 수의 봉으로 확인되며, 그 이후 어떤 봉에도 깨지지 않은 고점입니다. 가격 위의 가장 가까운 그러한 고점이 매수 레벨이 되고, 가격 아래의 가장 가까운 그러한 저점이 매도 레벨이 됩니다. 새로운 스윙이 형성되거나 이전 스윙이 깨지면, 대기 주문은 만료일을 기다리는 대신 새로운 레벨로 이동합
Signal Compass Desk
Vasilii Makarenko
다섯 개의 창 대신 하나의 패널 시장을 읽는다는 것은 보통 여러 개의 창을 동시에 열어 두는 것을 의미합니다: 방향을 위한 이동평균, 모멘텀을 위한 오실레이터, 추세와 횡보를 구분하기 위한 강도 지표, 그리고 레벨을 위한 또 다른 무언가. 각각은 화면의 자기 구석에서 자기 질문에 답합니다. Signal Compass Desk는 그러한 판독값들을 차트 구석의 하나의 블록에 넣습니다. 한 번 보면 시장이 어느 쪽으로 기울고 있는지, 움직임이 모멘텀을 얻고 있는지 잃고 있는지, 그 뒤에 강도가 있는지, 거래 설정이 스톱과 목표를 어디에 둘지, 그리고 현재 어느 거래 세션이 진행 중인지를 알 수 있습니다. 패널은 차트에 객체를 그리며 지표 버퍼를 계산하지 않으므로 차트 자체를 건드리지 않습니다. 새로운 바가 도착하면 업데이트됩니다. 패널이 보여주는 것 방향. 분석 타임프레임에서의 이동평균의 기울기로, 변동성으로 정규화되어 심볼과 주기에 걸쳐 판독값이 비교 가능하게 유지됩니다. 모멘텀. St
Tessera Footprint
Vasilii Makarenko
Tessera builds a footprint (cluster) chart from the trade ticks that your MetaTrader 5 terminal already receives from your broker. Prices, volumes and sides come from your own data feed; the indicator does not use any external server, does not send anything out and does not read or store your account details. What It Shows Buy and sell volume inside each bar, price by price, with numbers when they fit. Delta of the bar (the difference between buy and sell volume), cumulative delta and a delta st
What You See On The Chart Swing Percentile Desk places one table on one chart. Each row is a symbol from your watchlist and each column is a pullback size. A cell tells you what share of that symbol's earlier moves the current move has already outdone. A low number means a young move; a high number means the move is stretched compared with the history of the same symbol. Every symbol is compared only with itself, so a quiet pair and a restless pair are read on the same scale and no manual measur
Session Open Carry
Vasilii Makarenko
Session Open Carry is built on one idea: the side on which a session opened shows which way to hold a position until the next day. Once a day, at a set minute, the EA compares the last price with the open of the session. Price above the open - it buys. Price below the open - it sells. Price at the open - it stays out. The stop is placed at the extreme of the session, the position is carried overnight and it is closed at a set minute on a later day. The EA tests this idea on every session and doe
필터:
리뷰 없음
리뷰 답변