Sixfold Gold
- Experts
- 버전: 1.0
- 활성화: 20

Sixfold Gold trades XAUUSD on the hourly chart. It looks for the points where the market turned and left an extreme behind, places a pending stop order a little inside that level, and attaches a stop loss and a take profit before the order is ever filled. Six zones do this independently, each with its own search depth, and between them they read three timeframes and four sessions, so the advisor is rarely committed to a single view of the market.
A trade that goes wrong is closed by its stop. Nothing is averaged, nothing is doubled, and no position is opened to rescue another one.
How A Zone Finds Its Level
A zone reads a fixed number of bars back and looks for a bar whose high stands above a window of older bars and above a smaller window of newer ones. That asymmetry is the point: the level has to have survived the bars that came after it. A low is read the same way, mirrored.
A level that price has since covered is no longer a level, and the zone drops it. A level that sits too close to the current price is also refused: a minimum distance is required before an order is allowed, so the advisor does not trade a level the market is already standing on.
Why Six Zones Instead Of One
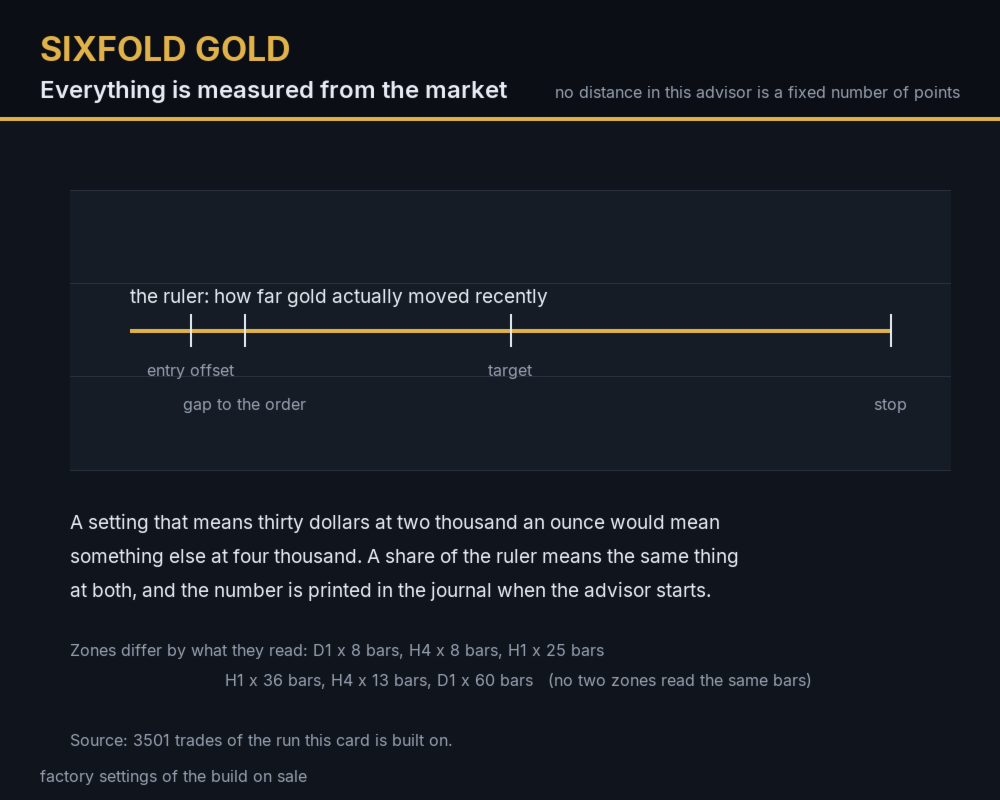
The six zones differ in what they read and when they work. One reads daily bars and rescans once an hour; another reads hourly bars and rescans every fifteen minutes. How far back a zone looks is written in days of history and turned into bars of that zone's own timeframe: eight and sixty days on the daily chart, one and a third and two and a sixth on the four hour one, one and one and a half on the hourly. In bars that is 8, 60, 8, 13, 25 and 36, and no two of them are the same - a zone that read the same bars as another one would simply place the same order twice.
Working hours are picked per zone out of the four sessions of the trading day, so a zone can be awake during the London session and silent overnight while another works around the clock.
Each zone carries its own magic number and its own caps on how many pending orders and open positions it may hold per side. They never manage each other's trades, and any of the six can be switched off without touching the rest.
The Entry Sits Inside The Level
The pending order is not placed at the level. It is offset inward by a share of the ruler, so a buy stop sits below a resistance rather than above it and the order is filled while price is still travelling towards the level. The offset breathes with the market: wider when gold is moving, tighter when it is quiet.
A pending order does not wait forever. It is withdrawn once price has walked away from it by about two and a half rulers, and in any case once it has rested for a hundred and twenty bars of its zone's timeframe.
The target is not a fixed number of points. It is a share of the range gold has covered over the last twenty four hours - half of it by default - so the same rule means one distance in a quiet week and another in a violent one. Entry distances are scaled by the price of gold for the same reason: the advisor does not become more aggressive simply because the instrument became more expensive.
One Defence For Every Trade
All six zones share one protection model, and it is measured in rulers like everything else. The stop is set when the order is placed. Once price has travelled a fraction of a ruler in favour of the trade, the stop is pulled to the entry plus a small lock, so the trade can no longer become a full loss. After that a trailing stop follows the price and only ever tightens, and it is only sent to the broker when the move is worth sending.
Before any stop is moved the advisor asks the broker for the minimum stop distance and the freeze distance, and it leaves the position alone when price is already at the target. Orders are never cancelled or modified while the market is closed.
Standing Aside Around The Jobs Report
The advisor computes the first Friday of each month itself, with the daylight saving shift applied, and stands aside from one hundred minutes before the release to sixty minutes after it. That one release is the whole of it: inflation prints and central bank decisions are not tracked, and the advisor trades through them like any other hour. Pending orders are pulled for that window and placed again when it passes. No news feed, no web request and no external file are involved.
What Stops The Account From Being Overloaded
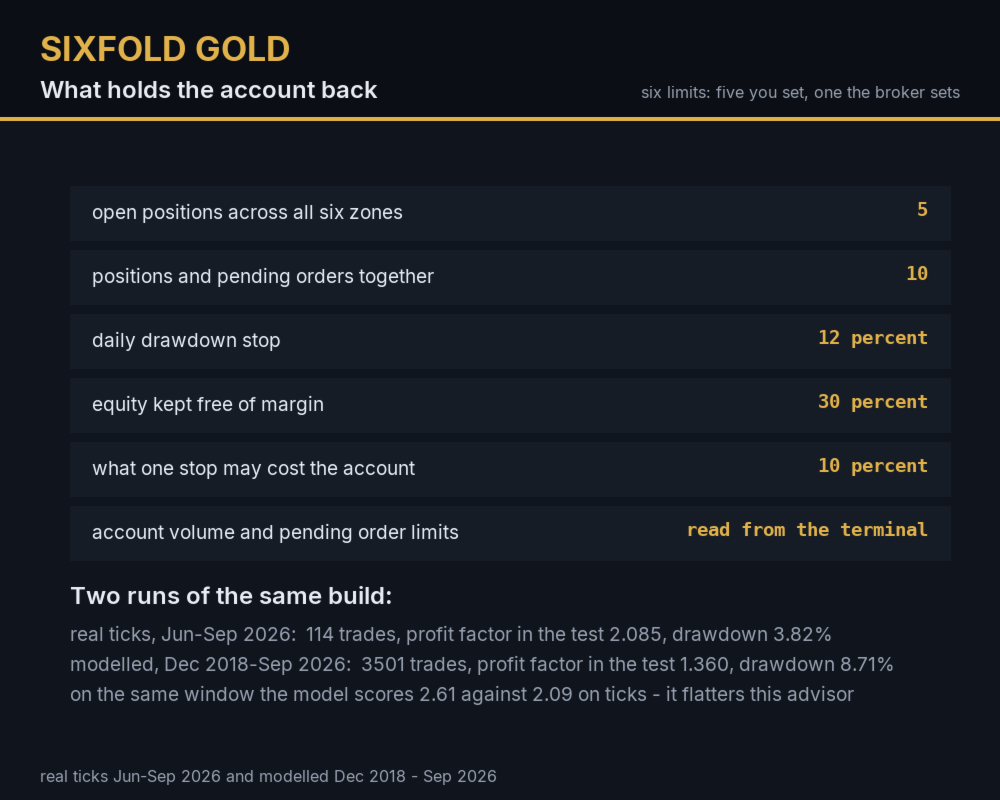
Six zones working together can queue up a lot of pending orders, and one strong trending day can fill all of them on the same side. Six limits stand in the way. Five of them you set yourself; the sixth the broker sets, and the advisor only reads it:
- new orders stop once five positions are open across all zones, and the pending orders still waiting are pulled. Orders already resting on the market can still fill together, so the count can go one or two higher: in the test run the peak was six;
- positions and pending orders are also capped TOGETHER, ten by default. A gap does not care which of them is which - it fills everything resting on the market at once, and this is the limit that decides what such a moment costs;
- a daily drawdown stop, twelve percent by default, which closes what is open and stops placing orders until the next day;
- a margin buffer: an order is not placed unless the account can still carry it together with every pending order already waiting, which is the moment when margin is actually needed;
- the account's own limits - the total volume allowed per symbol and the maximum number of pending orders - are read from the terminal, so the advisor stops before the broker refuses;
- a ceiling on what a single stop may cost the account, ten percent by default. The smallest lot a broker accepts is a floor the advisor cannot go under, so on a small account one stop can be worth a third of the balance. When that happens the advisor places nothing and says so in the journal instead of trading an account that is too small for it.
Numbers From The Test
Three runs of the same build with the factory settings, deposit 4 400 USD, fixed lot 0.01, leverage 1:500. Nothing was changed for any of them.
The first one uses the broker's real ticks rather than a model of them - XAUUSD H1, 1 June to 14 September 2026:
- the account went from 4 400.00 USD to 4 899.59 USD, a result of 499.59 USD in three and a half months
- 114 trades, 102 of them above zero
- profit factor in the test 2.085, average trade 4.382 USD
- maximal balance drawdown 191.13 USD, 3.82 percent; maximal equity drawdown 6.76 percent
- and the same warning as above, sharper on a short sample: 10 of those 114 trades carry most of the result. Three and a half months is a measurement, not a track record
The second one covers the whole history the broker has, December 2018 to September 2026, 46 009 bars, modelled from one minute bars instead of real ticks:
- the account went from 4 400.00 USD to 7 287.37 USD, a result of 2 887.37 USD
- 3 501 trades, 2 864 of them above zero
- profit factor in the test 1.360, average trade 0.825 USD
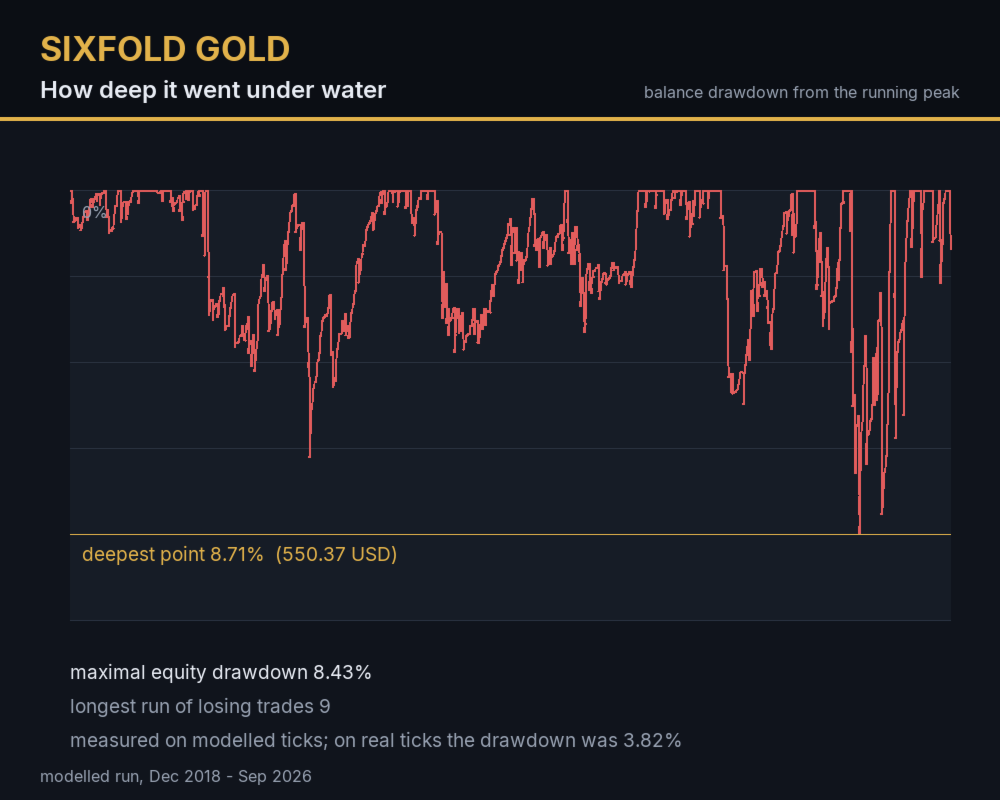
- maximal balance drawdown 550.37 USD, 8.71 percent; maximal equity drawdown 8.43 percent
- longest run of losing trades 9
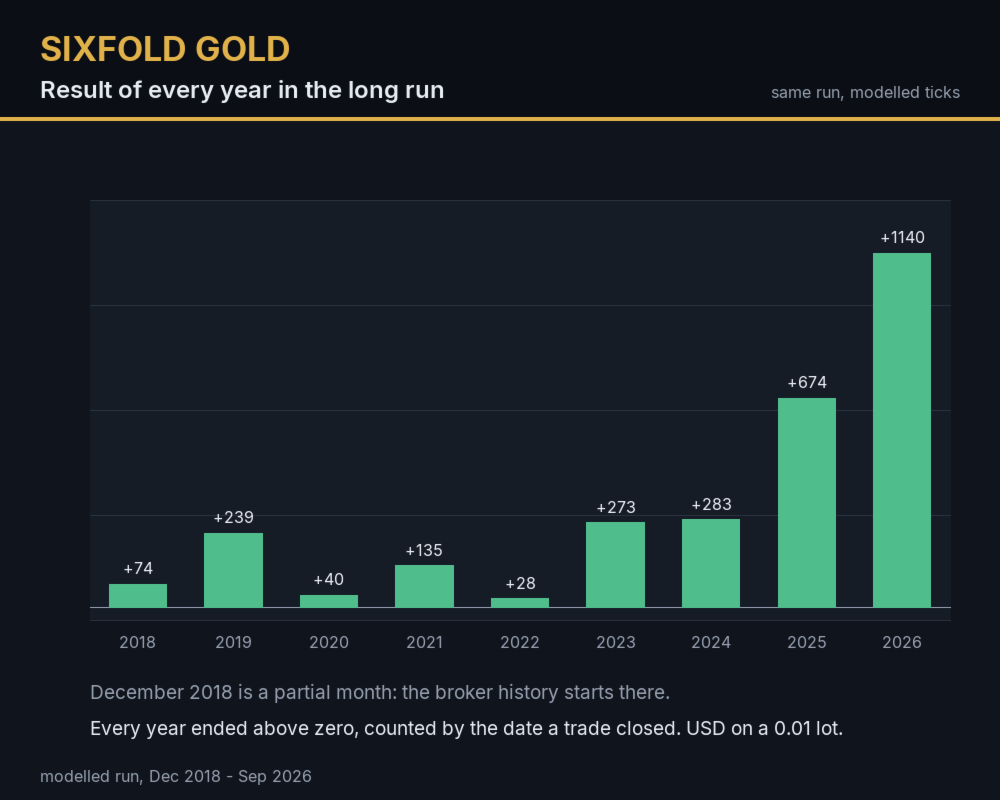
- every calendar year of that period closed above zero, counted by the date a trade was closed; the weakest of them added 28.35 USD, which is six tenths of a percent of the deposit. Counted by the date a trade was OPENED instead, 2022 comes out at -8.05 USD - the same trades, a different way of assigning them to years
- the result is concentrated: 50 of the 3 501 trades produce 85 percent of it, and the other 3 451 together make 432.76 USD over eight and a half years
The two runs above cover different periods, so comparing them says nothing about the model itself. The honest comparison is a third run: the same build, the same settings, the same 1 June to 14 September 2026, modelled instead of ticked. It gives profit factor in the test 2.601 against 2.085 on real ticks on the same 114 trades, and a shallower equity drawdown - 4.80 percent against 6.76. So the model does flatter this advisor, by about a fifth on that ratio, and the figures to trust are the ticked ones. The long run is printed here because eight and a half years of ticks do not exist in the terminal, not because it is the better measurement.
Almost nothing here was optimised. The stop, the trail and the target come straight from a measurement of gold's own range over 1 988 trading days. Four things were compared against results on the 2018-2024 part of the history, each against a rule written down beforehand: the gap to the order, the offset inside the level, the take profit and the pause at the start of the day. The 2026 window of real ticks was used for confirmation and has been re-run on several builds of this advisor, so treat it as a check that survived, not as an untouched sample. The six horizons were not searched for either. Each of them is written so that the number in the panel is what the zone actually reads after the conversion from days into bars of its own timeframe, and so that no two zones end up reading the same bars. That is also why the longest one is sixty days: at shorter depths the daily zone kept finding the same extreme as its neighbour and placing the same order twice.
One more decision came out of a measurement instead: for the first twenty five minutes of the trading day the advisor places no NEW orders. Across 2.7 million one minute bars of this broker's history the minute the day opens on moves about three and a half times as far as a median minute and costs about five times the median spread. The movement settles to the median within about a quarter of an hour; the spread does not - it is still above the daily median hours later, and the spread filter only catches the extreme cases, so it is the pause itself that keeps the advisor out of the expensive minutes. Orders placed before the pause can still be filled inside it: in the long run that happened nine times in eight years. Fewer knobs turned means fewer ways for a number to be true only on the sample it came from.
A tester run is a measurement, not a promise: it does not guarantee anything about the future. A different broker, a different spread and a different execution will not repeat these figures. One thing no tester shows at all is a gap: on these models the worst a single trade can do is its stop, while a weekend gap fills orders at the first available price instead. With ten orders and positions allowed at once, a gap of 100 USD against them costs about 1 000 USD - and that is on top of the ordinary case above, where the same ten positions stopping in a normal 2026 session cost around 1 812 USD.
Requirements
- XAUUSD (gold against the US dollar), H1 chart, hedging account
- minimum deposit 3 000 USD, recommended 4 400 USD. The factory lot is a fixed 0.01, and the smallest lot a broker accepts is a floor you cannot go under. What a stop costs is not a constant: the distance is a share of the range gold has just covered, and gold in 2026 travels further in dollars than it did in 2019. In the 2026 part of the test the median losing trade was 108.25 USD and the worst single loss was 181.15 USD on that fixed 0.01 lot. With the exposure cap at ten orders and positions together, the worst case of all of them filling and stopping at once is around 1 812 USD - about 41 percent of the recommended deposit and 60 percent of the minimum one. That number, not the average trade, is what the deposit has to survive
- a broker whose spread on gold stays small against the ruler; the advisor skips entries while the spread is wide, and that threshold is a share of the ruler, not a fixed number
- VPS or an always-on terminal is recommended: zones work on their own schedules around the clock
Input Parameters
- Sg_LotMode - 0 fixed lot, 1 percent of the account, 2 account currency per 0.01 lot
- Sg_FixLot, Sg_RiskPct, Sg_BalancePerLot - the sizes for the three modes
- Sg_RangeBars - how many bars the ruler is measured over
- Sg_GapR, Sg_EntryOffR, Sg_DupR - distance to the order, offset inside the level and the tolerance that rejects a duplicate, all in rulers
- Sg_StopR, Sg_BeTriggerR, Sg_FirstLockR, Sg_LockR, Sg_TrailR, Sg_TrailStepR - the shared defence, in rulers
- Sg_StaleR, Sg_MaxLifeBars - when a pending order is withdrawn
- Sg_MaxPendPerSide, Sg_MaxOpenPerSide - per zone, per side caps on orders and positions
- Sg_PivotShare, Sg_PivotBackMult - the confirmation windows on both sides of a level
- Sg_MaxTotalPos, Sg_MaxTotalExposure, Sg_MaxDailyDDPct, Sg_MarginBufferPct, Sg_MaxRiskPerTradePct - the account limits above
- Sg_TpR - the target, in rulers
- Sg_Z1_* ... Sg_Z6_* - the six zones: on or off, timeframe, horizon in days, session
Every zone can be switched off on its own, and the six enabled by default are the configuration all the numbers above were measured on.
Support
Questions through the product page or a private message on MQL5.
The factory configuration is the one every number above was measured on, and the advisor carries it inside itself: Reset in the inputs tab brings those values back at any time. A set file with the same values and a short manual are sent on request through the product page.