Session Value Desk

Three Anchors On One Chart

Most volume weighted average lines restart once a day. This one draws three at the same time: one anchored to the current trading session, one to the day, one to the week. Their spread tells you something a single line cannot. When the session line sits far under the weekly one, the week has been trading higher than today is; when all three sit together, the market has spent the week in one place.

Why The Session Anchor Is Not Midnight

The session line starts where the symbol's own schedule says the session starts, read from the terminal through the broker's trading hours for that weekday, not from midnight server time. On most brokers server midnight falls in the middle of nothing: the day you watch and the day the server counts are different days, and a line anchored to the wrong one carries the tail of the previous session inside it.

Where a symbol has no schedule at all, the line falls back to the start of the server day, and the panel keeps working.

The Distance In Money

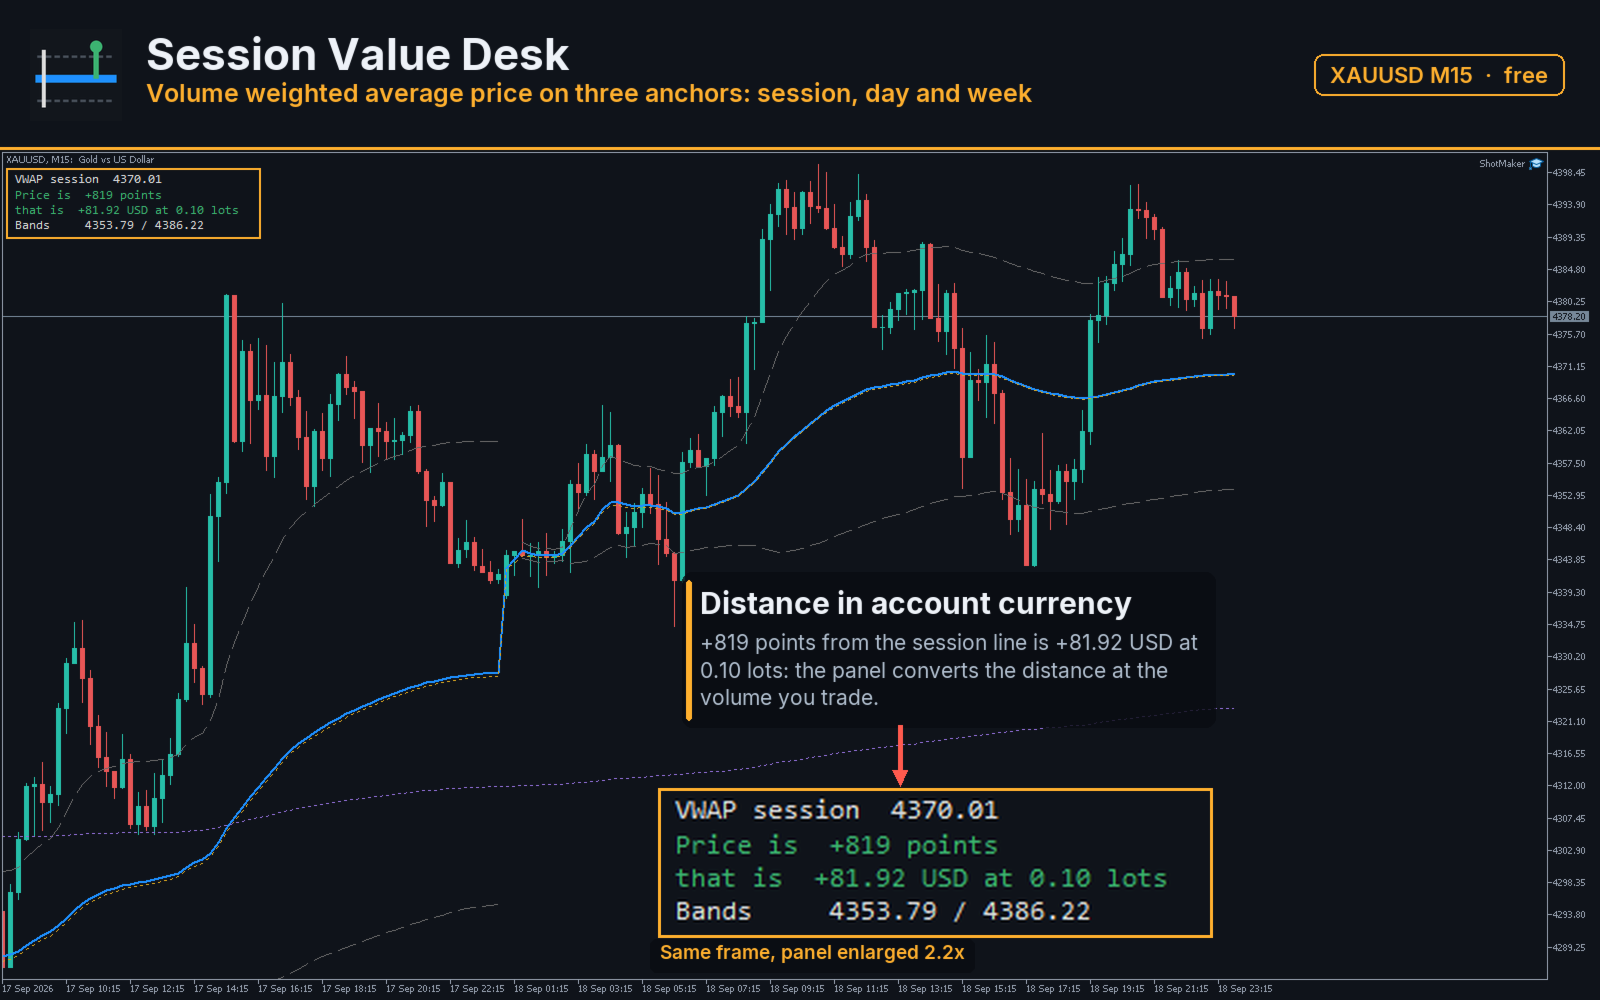
The panel prints how far price stands from the chosen line in points, and then what that distance amounts to at the volume you set. Both figures come from your own symbol specification - tick value and tick size - so the figure is in the currency of your account and at your contract size, not an example taken from another broker.

Sign is kept, not hidden: a positive figure means price is above the line, a negative one means below.

The Bands

The bands are the weighted deviation of price around the session line, at the width you set. They are not a forecast and not a signal. They answer one question: how far from the session average this instrument has been willing to trade today, measured in its own numbers rather than in a fixed number of points that means different things on gold and on a currency pair.

Input Parameters

  • PriceSource - typical, close or median price for each bar's contribution
  • BandSigma - band width in weighted deviations
  • PanelAnchor - which of the three lines the panel measures the distance to
  • PanelVolume - volume the distance is converted into money for
  • UseRealVolume - weight by real volume where the broker supplies it
  • ShowPanel - draw the panel or keep only the lines and buffers
  • PanelCorner - corner of the chart, offsets, font size
  • ColorAbove - colour used when price is above the line
  • ColorBelow - colour used when it is below
  • ObjectPrefix - prefix for every chart object created

Reading The Figures From An Expert Advisor

Five lines are published as buffers in this order: session, day, week, upper band, lower band. A sixth buffer carries the distance from price to the chosen anchor in points, so an expert advisor can read one number instead of recomputing the average. Buffers hold an empty value while a line has no bars to average yet.

Requirements

Any symbol and any timeframe. The indicator places no orders, writes nothing to disk, and every figure on the panel is recomputed from the terminal's own series, so a demo and a live account of the same broker show the same picture.

Support

Questions about a parameter, or a symbol where the session anchor looks wrong for your broker: reply in the comments of this page with the symbol and the broker, and I will look into it. A rating helps other traders decide whether a free tool is worth their time, whichever way it goes.
Altri dall’autore
Swept Liquidity Pools
Vasilii Makarenko
5 (1)
A liquidity sweep is a bar that pushes past a prior swing high or swing low, where protective stop orders tend to rest, and then closes back on the inner side of that level. The same event is known under several names: a stop hunt, a stop run, a liquidity grab, a false breakout, a failed breakout, or a swing failure. Swept Liquidity Pools marks those levels and those bars on the chart. The indicator tracks liquidity pools - confirmed swing levels that have not yet been taken - and marks the exac
FREE
Hourly Spread Map answers one question: at which hours does this symbol cost more to enter, and by how much. It reads the spread field that the terminal stores in every closed M1 bar of your own broker feed, sorts those measurements into 24 hours by 7 days of the week, and shows the result as a grid in the indicator sub-window. What It Measures Every closed M1 bar carries one spread measurement. The indicator collects them over the period you choose, groups them by the hour and weekday of the ba
FREE
Swap is the part of the cost that is easy to forget, because it arrives once a day, quietly, and never appears in the spread. Swap Cost Calendar puts it on the chart as a number you can act on. What It Shows The panel reads what the broker publishes for the current symbol and shows four things. The cost of one night for a long position and for a short one, in your account currency or in points. The weekday line, showing how many nightly charges a position carries on each day of the week. The tri
FREE
What It Shows Candle Clock Desk puts four lines on the chart. The first is the time left until the current bar closes. The next three answer a question the clock alone cannot: is this bar unusually busy, or unusually quiet, right now. Bar closes in - the countdown, in minutes and seconds So far - volume this bar has accumulated since it opened Usual here - what this symbol had accumulated by this same minute, in the past Pace - the first divided by the second The Pace Line Pace of 1.00 means the
FREE
Un pool di liquidità è un massimo o un minimo di swing confermato che non è ancora stato preso. Un liquidity sweep è la barra sulla quale il prezzo viene scambiato oltre quel livello e poi chiude di nuovo all'interno del range - lo stesso evento che i trader chiamano anche stop hunt, stop run, liquidity grab o falso breakout. Liquidity Sweep Pools MTF contrassegna sia i pool sia i liquidity sweep effettuati su di essi, sul grafico corrente e su un timeframe superiore che scegli, e aggiunge un pa
Structure Desk
Vasilii Makarenko
Un expert advisor per XAUUSD su MetaTrader 5. Lavora su un paniere alla volta: apre in un insieme fisso di ore del server, aggiunge alla posizione mentre il prezzo si muove contro di essa e chiude l'intero paniere insieme. Non c'è stop loss e non c'è take profit sulle singole posizioni. Come Opera Un simbolo, XAUUSD, un paniere alla volta, fino a 5 ordini nella stessa direzione. Le entrate sono consentite solo in ore fisse del server, e solo quando il prezzo si trova al bordo del suo intervallo
Sarveon
Vasilii Makarenko
Sarveon è un expert advisor per XAUUSD su MetaTrader 5. Nove strategie indipendenti funzionano fianco a fianco su un unico grafico. Ognuna ha il proprio magic number, il proprio timeframe di ingresso e il proprio insieme di distanze, e nessuna di esse aggiunge mai a una posizione aperta da un'altra. Come Opera Ogni strategia analizza le barre recenti del proprio timeframe di ingresso alla ricerca di un livello di swing: un massimo che nessuna barra successiva ha superato, o un minimo che nessuna
Ridgeline
Vasilii Makarenko
Ridgeline attende ai livelli di prezzo che l'oro ha lasciato in pace. Legge le barre giornaliere, segna i massimi e i minimi che nessuna barra successiva ha superato, e vi colloca un ordine stop pendente. Sette insiemi di regole cercano a profondità diverse della storia, così uno può essere in attesa a un livello formatosi la settimana scorsa mentre un altro ne osserva uno di tre mesi fa. Un insieme che incassa una perdita resta fermo per due giorni prima di collocare di nuovo qualcosa. Ogni ins
Sixfold Gold
Vasilii Makarenko
Sixfold Gold trades XAUUSD on the hourly chart. It looks for the points where the market turned and left an extreme behind, places a pending stop order a little inside that level, and attaches a stop loss and a take profit before the order is ever filled. Six zones do this independently, each with its own search depth, and between them they read three timeframes and four sessions, so the advisor is rarely committed to a single view of the market. A trade that goes wrong is closed by its stop. No
Filtro:
Nessuna recensione
Rispondi alla recensione