VWAP 3 Bands

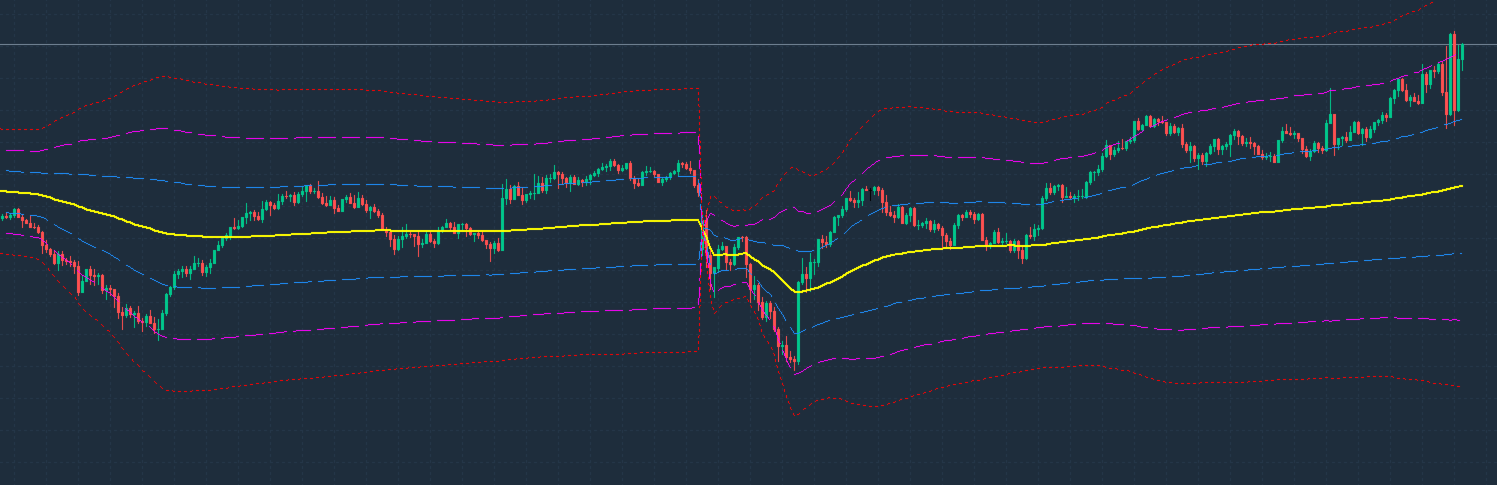
Anchored VWAP + 3 SD Bands. This tool combines the market's most respected volume indicator (VWAP) with statistical volatility (Standard Deviation), creating a complete map of price action.

Unlike simple moving averages, VWAP weights the price based on actual traded volume, offering much more reliable support and resistance levels. With the three standard deviation bands included, you can easily visualize statistically proven overbought and oversold zones.

Key Features:

  • 📈 Daily VWAP (Auto-Reset): Precise calculation restarted at the beginning of every session (D1).

  • 3 Volatility Niveis: Symmetrical bands at ±1, ±2, and ±3 Standard Deviations, each featuring its own color and line style (dashed/dotted) for effortless distinction.

  • 🛠️ Full Input Control: Easily toggle individual bands on or off, adjust custom multipliers, and choose the perfect colors to match your trading template.

  • 🚀 Optimized Performance: Clean, fast-loading code specifically optimized for the M5 timeframe, ensuring it won't lag or slow down your platform.


추천 제품
Daily High Low Danilo Monteiro
Danilo Hudson Couto Monteiro
4 (2)
# Indicador Daily High - Danilo Monteiro - MT5 ## Descrição O Daily High/Low Labels é um indicador personalizado para MetaTrader 5 que exibe automaticamente as máximas e mínimas diárias no gráfico, facilitando a identificação rápida dos níveis importantes de preço. O indicador marca os preços com etiquetas e linhas horizontais, permitindo uma visualização clara dos níveis críticos do dia atual e anterior. ## Principais Características ### 1. Marcação Automática - Exibe automaticamente as máxi
FREE
(Special New Year promotion - free price!) The indicator displays the actual 'Scale in points per bar' (identical to the manual setting in the Terminal, see screenshot) in the upper right corner of the chart. The displayed value changes INSTANTLY whenever the chart scale is changed! (This is very convenient when planning screenshots). In Settings: Change language (Russian/English), font size of the displayed text, text label offset coefficient from the graph corner, equally in X and Y directi
FREE
VFI Quantum
Nikita Berdnikov
5 (1)
Introducing VFI (Volume Flow Indicator) – a trading indicator that analyzes the relationship between volume and price movement to identify key trading opportunities. The indicator displays the strength and direction of volume flow, providing clear signals about potential entry and exit points. Signals are formed based on zero line crossovers, crossovers between the VFI line and its exponential moving average (EMA), and when the indicator exits overbought and oversold zones. Attention! This stra
FREE
IFR Stochastic MT5
Danrlei Hornke
5 (1)
The Stochastic RSI (StochRSI) is a technical indicator that combines the characteristics of the Relative Strength Index (RSI) with the Stochastic Oscillator, resulting in a more sensitive tool that generates a higher number of trading signals. Developed by Tushar Chande and Stanley Kroll, the indicator was designed to overcome a perceived limitation of the traditional RSI: the low frequency of overbought and oversold levels activation (commonly 80 and 20), especially in less volatile assets. Ho
FREE
Aggression Wave RSJ
JETINVEST
4.57 (7)
This indicator sums up the difference between the sells aggression and the buys aggression that occurred in each Candle, graphically plotting the waves of accumulation of the aggression volumes.   Through these waves an exponential average is calculated that indicates the direction of the business flow. Note: This indicator DOES NOT WORK for Brokers and/or Markets WITHOUT the type of aggression (BUY or SELL).   Be sure to try our Professional version with configurable features and alerts:  Agre
FREE
Weis Waves
Flavio Javier Jarabeck
2.83 (18)
The original author is David Weis, an expert in the Wyckoff Method. The Weis Wave is a modern adaptation of the 1930's Wyckoff Method, another expert in Tape Reading techniques and Chart Analysis. Weis Waves takes market volume and stacks it into waves according to price conditions giving the trader valuable insights about the market conditions. If you want to learn more about this subject you can find tons of videos in YouTube. Just look for "The Wickoff Method", "Weis Wave" and "Volume Spread
FREE
Easy Correlations Indicator The Easy Correlations Indicator is designed to help traders analyze the relationship between two correlated instruments. By monitoring the distance between their Relative Strength Index (RSI) values, the indicator highlights situations where one instrument has moved significantly further than the other. This creates potential trading opportunities: Sell the stronger instrument (overstretched RSI) Buy the weaker instrument (lagging RSI) Because the positions are opened
FREE
Stackable VWAP
Flavio Javier Jarabeck
3.5 (4)
Volume Weighted Average Price (VWAP) is a trading benchmark commonly used by Big Players that gives the average price a Symbol has traded throughout the day. It is based on both Volume and price. Additionally we put in this indicator the MVWAP (Moving Volume Weighted Average Price). For those who do not know the usage and the importance od this indicator I recommend a great article about this subject at Investopedia ( https://www.investopedia.com/articles/trading/11/trading-with-vwap-mvwap.asp
FREE
RSI abcd
Francisco Gomes Da Silva
4.33 (3)
RSI ABCD 패턴 파인더: 기술적 전략 1. 지표 작동 방식 클래식 RSI 와 ABCD 하모닉 패턴 자동 감지를 결합합니다. 주요 구성 요소 표준 RSI (조정 가능한 기간) 고점 및 저점 마커 (화살표) ABCD 패턴 (초록/빨강 선) 과매수 (70) 및 과매도 (30) 필터 2. MT5 설정 period = 14 ; // RSI 기간 size = 4 ; // 최대 패턴 크기 OverBought = 70 ; // 과매수 수준 OverSold = 30 ; // 과매도 수준 Filter = USE_FILTER_ YES ; // 확인 필터 3. 트레이딩 전략 3.1. 매수 진입 (강세 ABCD) 조건: RSI가 다음을 형성: 저점 ( A ) → 고점 ( B ) → 더 높은 저점 ( C ) D 는 과매도 (30) 위지만 C 아래 확인: A-B-C-D 연결 초록 선 목표: TP1: B-C의 61.8% TP2: B-C의 100% 손절: D 아래 3.2. 매도 진입 (약세 ABCD) 조건:
FREE
Prometheus Analyst
Humphrey Mangera
PROMETHEUS TECHNICAN VERSION Free | By THE SONS A gift from The Sons — no strings, no trial, no expiry. Every trader deserves access to professional-grade market intelligence. That belief is why Prometheus Technical Version exists, and why it costs nothing. Consider it our handshake to the trading community. What You're Getting This is not a simplified tool dressed up as a gift. Prometheus Technican Version is a fully built, institutional-quality technical analysis indicator running a dual-model
FREE
Fimathe PCM Indicador
Cristiano Rodrigo Olegini
Velas Forex FIMATHE PCM Indicator (무료) Velas Forex FIMATHE PCM Indicator 는 트레이더가 시장을 쉽고 빠르며 직관적으로 분석할 수 있도록 개발된 무료 지표입니다. 명확한 시각적 신호를 통해 시장 상황을 쉽게 파악할 수 있도록 지원하며, 보다 자신감 있게 매매 결정을 내릴 수 있도록 도와줍니다. 주요 기능 간단하고 직관적인 사용자 인터페이스 쉬운 설치 및 설정 MetaTrader 5에서 제공하는 모든 금융상품과 호환 다양한 시간 프레임(Timeframe)에서 사용 가능 초보자와 숙련된 트레이더 모두에게 적합 플랫폼 리소스를 적게 사용하는 가벼운 설계 무료 이 지표는 MQL5 커뮤니티를 위해 100% 무료 로 제공됩니다. 이 지표가 도움이 되었다면 평점과 리뷰를 남겨 주세요. 여러분의 소중한 의견은 더 나은 도구를 개발하는 데 큰 도움이 됩니다. 면책 조항 이 지표는 기술적 분석을 지원하기 위한 도구이며 수익이나 투자 성과를 보장하
FREE
Intraday Momentum Index IMI
Danilo Hudson Couto Monteiro
Indicador IMI (Intraday Momentum Index) Descrição O Indicador IMI (Intraday Momentum Index) é uma poderosa ferramenta de análise técnica desenvolvida para identificar a força do momentum e potenciais reversões no mercado. Este indicador quantifica a relação entre ganhos e perdas durante um período específico, ajudando traders a avaliar a dinâmica atual do mercado. Características Oscila entre 0 e 100, facilitando a interpretação das condições de mercado Identifica com precisão áreas de sobrecomp
FREE
Simple Weis Wave
Jean Jacques Huve Ribeiro
3.67 (3)
One of the best tools for analyzing volume, Weis Wave was idelized by David Weis, to facilitate the reading of directional flow. For the VSA method disciples it is an evolution of the practices created by Richard Wycoff, facilitating a predictive reading of the market, always seeking an accumulation and distribution of the negotiated contracts. Cumulative wave volume  Range of wave ( removed) Average Wave volume Ref "Tim Ord lectures" ( removed)
FREE
Aggression Volume
Flavio Javier Jarabeck
4.29 (17)
Aggression Volume Indicator is the kind of indicator that is rarely found in the MQL5 community because it is not based on the standard Volume data provided by the Metatrader 5 platform. It requires the scrutiny of all traffic Ticks requested on the platform... That said, Aggression Volume indicator requests all Tick Data from your Broker and processes it to build a very special version of a Volume Indicator, where Buyers and Sellers aggressions are plotted in a form of Histogram. Additionally,
FREE
OmniSignal Navigator
Fatih Klavun
5 (2)
OmniSignal Navigator – Smart Entries at Key Levels Trade Like a Professional  with this daily/weekly High-Low-Close indicator, designed for   scalping or intraday short term trading   and precision breakout trading. Suggested Timeframes to trade with: M5 |  DONT USE THE INDICATOR ON THE M1 TIMEFRAME!!! Why It Works   Perfect for Scalping/Intraday:   Targets key zones ( PDH/PDL/PDC & PWH/PWL/PWC ) on   M2, M3, M5, M15   timeframes. (Lower Timeframes = More Signals, Higher Timeframes = Le
FREE
Volume-to-Price Movement Oscillator (VP Oscillator) for MT5 The VP Oscillator highlights the balance (or imbalance) between trading volume and price movement, helping traders spot hidden accumulation, distribution, or weakening trends. How It Works: Calculates each bar’s price range (High–Low) and tick volume. Normalizes both values over a set period (default: 14). Plots the absolute difference between them ×100 — showing how closely price action aligns with trading activity. Interpretation: Hig
FREE
Value Chart Candlesticks
Flavio Javier Jarabeck
4.57 (14)
The idea of a Value Chart indicator was presented in the very good book I read back in 2020 , " Dynamic Trading Indicators: Winning with Value Charts and Price Action Profile ", from the authors Mark Helweg and David Stendahl. The idea is simple and the result is pure genius: Present candlestick Price analysis in a detrended way! HOW TO READ THIS INDICATOR Look for Overbought and Oversold levels. Of course, you will need to test the settings a lot to find the "correct" one for your approach. It
FREE
Weis Waves RSJ
JETINVEST
4.6 (10)
The Weis Waves RSJ Indicator sums up volumes in each wave. This is how we receive a bar chart of cumulative volumes of alternating waves. Namely the cumulative volume makes the Weis wave charts unique. It allows comparing the relation of the wave sequence characteristics, such as correspondence of the applied force (expressed in the volume) and received result (the price progress). If you still have questions, please contact me by direct message:  https://www.mql5.com/en/users/robsjunqueira/
FREE
Reversal Oscillator — Advanced Momentum Shift Detector Reversal Oscillator is a free indicator designed to highlight price zones that are statistically outside their normal movement patterns, helping traders anticipate potential turning points before they occur. Unlike traditional oscillators that react mainly to overbought/oversold conditions, this indicator applies third derivative analysis (the "acceleration of the acceleration" of price) calculated using two independent methods within a n
FREE
Weis Waves(와이스 웨이브) 는 데이비드 와이스(David Weis)가 개발하고 리차드 와이코프(Richard Wyckoff)의 원리에 기반한 기술적 지표입니다. 전통적인 거래량이 캔들마다 표시되는 것과 달리, Weis Waves는 거래량을 상승 또는 하락 “파동”으로 누적하며, 가격 방향이 바뀔 때마다 계산을 새로 시작합니다. 이 방법은 트레이더가 시장 움직임의 실제 힘 을 명확하게 파악할 수 있게 해줍니다. 각 파동은 일련의 캔들을 지탱하는 거래량의 강도를 보여줍니다. 주요 특징: 거래량을 매수 및 매도 파동으로 그룹화. 지배적인 압력(매수세 또는 매도세)을 강조. 추세 지속 또는 잠재적 반전 을 식별하는 데 도움. 와이코프 방법론에 기반하며, 거래량 및 흐름 분석에 널리 사용됨. Weis Waves는 가격과 거래량의 균형을 평가하기 위해 많은 전문 트레이더들이 활용하며, 시장 역학에 대한 더 깊은 통찰을 제공합니다.
FREE
Super Trend eu
Emin Ulucanli
4.83 (6)
SUPERTREND; It is a trend following indicator based on the SuperTrend ATR created by Olivier Seban. It can be used to detect changes in trend direction and locate stops. When the price falls below the indicator curve, it turns red and indicates a downtrend. Conversely, when the price moves above the curve, the indicator turns green, indicating an uptrend. Like other indicators, it works well on SuperTrend when used in conjunction with other indicators such as MACD, parabolik SAR, Bollinger Band
FREE
DS RVOL: The Relative Volume Indicator for MT5 RVOL is a straightforward Relative Volume (RVOL) indicator for MetaTrader 5. It shows you how current volume compares to a historical average, providing a quick way to gauge the strength of a price move. How it Works Relative Volume is a simple ratio: R V O L = C u rre n t V o l u m e ​/ A v er a g e H i s t or i c a l V o l u m e RVOL > 1.0 : Volume is higher than usual. This suggests there's strong interest and potential for a sustained move. RVOL
FREE
Pip Calculator
Breneer Jacinto
1 (1)
Pip Value Calculator - Instant Risk Assessment on Your Chart This powerful and lightweight utility instantly calculates the precise monetary value for any pip movement, displaying it directly on your chart so you can assess risk and potential profit at a glance. At its core, the indicator's sophisticated calculation engine runs silently with every price tick, ensuring the information you see is always up-to-date. It automatically detects the instrument you are trading—whether it's a Forex pair,
FREE
MIDAS Super VWAP
Flavio Javier Jarabeck
4.27 (11)
Imagine VWAP, MVWAP and MIDAS in one place... Well, you found it! Now you can track the movement of Big Players in various ways, as they in general pursue the benchmarks related to this measuring, gauging if they had good execution or poor execution on their orders. Traders and analysts use the VWAP to eliminate the noise that occurs throughout the day, so they can measure what prices buyers and sellers are really trading. VWAP gives traders insight into how a stock trades for that day and deter
FREE
Best SAR MT5
Ashkan Hazegh Nikrou
4.33 (3)
설명 :  우리는 외환 시장(PSAR)에서 전문적이고 인기 있는 지표 중 하나를 기반으로 하는 새로운 무료 지표를 도입하게 된 것을 기쁘게 생각합니다. 이 지표는 원래 포물선 SAR 지표에 대한 새로운 수정이며, 프로 SAR 지표에서 점과 가격 차트 사이의 교차를 볼 수 있습니다. 교차는 신호가 아니지만 이동 가능성의 끝을 말하는 것입니다. 새로운 파란색 점으로 매수를 시작하고 첫 번째 파란색 점 앞에 손절매를 1 attr 배치하고 마지막으로 점이 가격 차트를 교차하는 즉시 종료할 수 있습니다. 매수 또는 매도 신호를 여는 방법은 무엇입니까? 첫 번째 파란색 점으로 공개 매수 거래 및 첫 번째 빨간색 점으로 공개 매도 거래 정확한 손절매는 어디에 있습니까? 안전한 정지 손실은 첫 번째 점에 있을 수 있습니다(구매의 경우 첫 번째 파란색 점, 매도의 경우 첫 번째 빨간색 점) 올바른 이익실현은 어디에 있습니까? 이익실현은 손절매 거리와 RR에 따라 조정할 수 있으므로 내 제
FREE
Market Momentum
Flavio Javier Jarabeck
4.43 (7)
The Market Momentum indicator is based on the Volume Zone Oscillator (VZO), presented by Waleed Aly Khalil in the 2009 edition of the International Federation of Technical Analysts journal, and presents a fresh view of this market valuable data that is oftenly misunderstood and neglected: VOLUME. With this new approach of "seeing" Volume data, traders can infer more properly market behavior and increase their odds in a winning trade. "The VZO is a leading volume oscillator; its basic usefulness
FREE
Welles Wilder
Maycon Sussuarana
Wilder Trend Indicator (MT5) The Wilder Trend Indicator is a clean and lightweight trend-following tool based on Wilder’s Moving Average smoothing method . It visually highlights market direction by separating uptrend and downtrend movements directly on the price chart. The indicator is designed to be simple, flexible, and non-intrusive , making it ideal for discretionary traders who want clear trend confirmation without cluttering the chart. Key Features Uses Wilder-style smoothing for st
FREE
ZScore Mean Reversion Indicator
Diego Vinicius Righetti Sa
Z-Score Mean Reversion Indicator INTRODUCTION Financial markets are constantly shifting between periods of equilibrium and disequilibrium. At certain moments, price can move significantly away from its normal behavior, creating conditions that deserve special attention. The Z-Score Mean Reversion Indicator was developed to identify these situations objectively, transforming complex market movements into a clear reading of market imbalance. Designed for traders who value quantitative analysis a
FREE
VWAP and MVWAP
Flavio Javier Jarabeck
3.88 (8)
Volume Weighted Average Price (VWAP) is a trading benchmark commonly used by Big Players that gives the average price a Symbol has traded throughout the day. It is based on both Volume and price. Additionally we put in this indicator the MVWAP (Moving Volume Weighted Average Price). For those who do not know the usage and the importance od this indicator I recommend a great article about this subject at Investopedia ( https://www.investopedia.com/articles/trading/11/trading-with-vwap-mvwap.asp )
FREE
Donchian Pro
Paulo Henrique Faquineli Garcia
4.75 (4)
The Donchian Channel Channels are among the most popular tools of technical analysis, as they visually convey to the analyst the limits within which most price movement tends to occur. Channel users know that valuable information can be obtained at any time, whether prices are in the central region of a band or close to one of the border lines. One of the best known techniques to explore these concepts is Bollinger Bands. However, John Bollinger was not the only one to research the application
FREE
이 제품의 구매자들이 또한 구매함
Neuro Poseidon MT5
Daria Rezueva
4.8 (54)
Neuro Poseidon is a new indicator by Daria Rezueva. It combines precise trading signals with adaptive TP/SL levels - creating best possible trades as a result! Message me and get  Neuro Poseidon Assistant  as a gift to automize your trading process! What makes it stand out? 1. Proven profitability on all assets and timeframes 2. Only confirmed BUY and SELL signals present on the chart 3. Adaptive TP & SL levels generated by the software for each trade 4. Easy to understand - suitable for al
SuperScalp Pro
Van Minh Nguyen
4.68 (28)
SuperScalp Pro – 전문 멀티 레이어 컨플루언스 스캘핑 시스템 SuperScalp Pro는 지능형 다중 요소 확인 시스템을 통해 높은 확률의 거래 기회를 식별하도록 설계된 전문적인 다중 컨플루언스 트레이딩 시스템입니다. Supertrend, VWAP, EMA, RSI, ADX, 거래량 분석, 볼린저 밴드 및 MACD 다이버전스를 통합하여 저품질 신호를 필터링하고, 가짜 돌파 신호를 줄이며, 진입 정확도를 향상시킵니다. XAUUSD, BTCUSD 및 주요 Forex 통화쌍에 특별히 최적화된 SuperScalp Pro는 ATR 기반 변동성 로직과 규칙 기반 신호 검증을 통해 변화하는 시장 환경에 적응하며, M1부터 H4까지 다양한 시간대에서 일관되고 객관적인 거래 확인 신호를 제공합니다. 내장된 스마트 제어 패널을 통해 실시간으로 완전한 사용자 설정이 가능하며, 트레이더는 개별 확인 필터를 활성화하거나 비활성화하여 다양한 시장 환경, 거래 스타일 및 위험 선호도에 맞게 시스템
SMC Intraday Formula
Kareem Abbas
5 (18)
먼저 솔직하게 말하겠습니다. 어떤 인디케이터도 단독으로 당신을 수익성 있게 만들어주지 않습니다. 누군가 그렇게 말한다면, 그는 당신에게 꿈을 파는 것입니다. 완벽한 매수/매도 화살표를 보여주는 모든 인디케이터는 완벽하게 보이도록 만들 수 있습니다 — 단지 올바른 과거 구간을 확대하고 승리한 거래만 캡처하면 됩니다. 우리는 그렇게 하지 않습니다.  SMC Intraday Formula는 도구입니다. 시장 구조를 읽고, 가장 높은 확률의 가격 구간을 표시하며, 현재 스마트 머니의 흐름이 어떻게 보이는지 아주 단순한 언어로 보여줍니다. 최종 결정은 여전히 당신이 합니다. 실행도 당신이 합니다. 하지만 이제는 희망이 아니라 정확성으로 거래하게 됩니다. 우리는 이 인디케이터를 지난 약 3년 동안 골드(XAUUSD) 및 주요 외환 통화쌍의 데이 트레이딩 스캘핑에 사용해 왔습니다. M1, M5, M15, M30에서 우리의 핵심 도구입니다. 이 도구는 미래를 예측하려 하지 않습니다 — 지금 형성
M1 Quantum MT5
Hamed Dehgani
5 (6)
M1 Quantum을 이용한 실시간 트레이딩 신호 : 신호   ( Quantum Trade Assistant 에 의해 거래가 자동으로 실행되며, 이 제품에 무료 로 포함되어 있습니다.) 가격 계획: 현재 가격: $149 (얼리 어답터 혜택) 다음 예정 가격: $169 예정 소매 가격: $299 개발자 안내: 구매 후 저에게 연락하시면 최신 권장 설정 파일(Set File) , 사용 팁, 그리고 다른 M1 Quantum 사용자들과 소통할 수 있는 VIP 지원 그룹 초대장을 받으실 수 있습니다. M1 Quantum 은 M1 전용 전문 트레이딩 시스템으로, 손절(Stop Loss), 익절(Take Profit), 그리고 스마트 자금 관리 기능이 내장된 빠르고 정확한 거래 신호를 제공합니다. M1 Quantum 은 연속 수익 거래 에 집중하여 계좌를 빠르게 성장시키도록 설계된 전문 자금 관리 시스템을 포함하고 있습니다. M1 Quantum 인디케이터 의 주요 기능 M1 타임프레임 및 모든
Gold Entry Sniper
Tahir Mehmood
5 (14)
Gold Entry Sniper – 골드 스캘핑 & 스윙 트레이딩을 위한 전문 다중 시간 프레임 ATR 대시보드 Gold Entry Sniper 는 XAUUSD 및 기타 종목에 대해 정확한 매수/매도 신호 를 제공하는 고급 MetaTrader 5 지표입니다. ATR 트레일링 스톱 로직 과 다중 시간 프레임 분석 을 기반으로 설계되어 스캘핑과 스윙 트레이딩 모두에 적합합니다. 주요 기능 및 장점 다중 시간 프레임 분석 – M1, M5, M15 추세를 한눈에 확인. ATR 기반 트레일링 스톱 – 변동성에 따라 자동 조정. 전문 차트 대시보드 – 신호 상태, ATR 레벨, 회귀선, 매매 방향 표시. 명확한 매수/매도 마커 – 자동 화살표와 텍스트 라벨. 종료 알림 & 거래 관리 – 수익 보호를 위한 자동 종료 감지. 완전 사용자 설정 가능 – 대시보드 위치, 색상, ATR/회귀선 파라미터 조정. 골드(XAUUSD) 최적화 – M1~M15 스캘핑에 완벽, 외환/지수/암호화폐에도 적용 가능.
이 제품은 2026년 시장에 맞게 업데이트되었으며 최신 MT5 빌드에 최적화되었습니다. 가격 업데이트 안내: Smart Trend Trading System은 현재 $99 에 제공됩니다. 다음 30회 구매 후 가격은 $199 로 인상됩니다. 특별 혜택: Smart Trend Trading System 구매 후 저에게 개인 메시지를 보내시면 Smart Universal EA를 무료 로 받을 수 있으며, Smart Trend 신호를 자동 거래로 전환할 수 있습니다. Smart Trend Trading System은 리페인트 없음, 재그리기 없음, 지연 없음의 완전한 트레이딩 시스템으로, 더 깨끗한 신호, 더 나은 추세 방향, 그리고 더 체계적인 시장 거래 방식을 원하는 트레이더를 위해 제작되었습니다. Online course , manual and [download presets] . 이 시스템은 추세 감지, 반전 구간, Smart Cloud, 트레일링 스톱 로직, 지지와 저항, 캔들
Entry In The Zone and SMC Multi Timeframe is a real-time 2-in-1 market analysis tool that combines market structure analysis and a No Repaint BUY / SELL signal system into a single indicator, built on Smart Money Concepts (SMC) — a widely adopted framework used by professional traders to understand market structure. This indicator helps you see the market more clearly, make decisions based on structure rather than guesswork, and focus on high-probability zones where price is more likely to react
Power Candles MT5
Daniel Stein
5 (8)
Power Candles V3 - 자체 최적화 강도 지표 파워 캔들 V3는 적용된 모든 차트에서 통화 및 상품의 강세를 실행 가능한 거래 계획으로 전환합니다. 단순히 캔들에 색상을 입히는 대신, 백그라운드에서 실시간 자동 최적화를 수행하여 현재 보고 있는 종목에 대한 최적의 손절매, 익절 및 신호 임계값을 제공합니다. 한 번의 클릭으로 실시간 거래에 적용할 수 있으며, 진입점, 손절매 및 익절 선이 정확한 가격에 맞춰 차트에 표시되고, 방향과 함께 알림이 발령됩니다. 이 도구는 Stein Investments 에코시스템의 일부입니다. 18개 이상의 도구와 함께 당신의 1대1 AI 트레이딩 멘토 Max.  항상 대기 중, 모든 인디케이터를 깊이 있게 이해, 무언가를 차근차근 생각해보고 싶은 순간에 도움을 줍니다.  https://stein.investments 에서 만나보세요 매 종가 바마다 3,000회 이상의 트레이딩 시뮬레이션. 9가지 강도 상태. 2가지 전략을 병렬로 테스트.
Trend Sniper X
Sarvarbek Abduvoxobov
5 (3)
Trend Sniper X 는 MetaTrader 5용 멀티 타임프레임 추세 추종 지표로, 트레이더가 추세 방향과 잠재적 반전 지점을 명확하고 정확하게 식별하도록 돕습니다. 가격 정보: 현재 가격은 프로모션 가격이며, 향후 업데이트 및 새로운 기능 출시 시 변경될 수 있습니다. Code2Profit 채널 멀티 타임프레임 분석으로 시장을 마스터하세요! 기술 사양 플랫폼 MetaTrader 5 지표 유형 멀티 타임프레임 추세 지표 운용 타임프레임 모든 차트 타임프레임 지원, 독립적으로 선택 가능한 상위 타임프레임(M1–MN1) 주요 상품 외환, 금(XAUUSD) 및 기타 CFD 권장 계좌 모든 계좌 유형 시각화 색상별 추세 캔들(매수/매도/약세/변경) + 매수/매도 화살표 추가 모듈 세션 시장 박스(시드니, 도쿄, 런던, 뉴욕) 주요 기능 멀티 타임프레임 추세 분석: 상위 타임프레임의 추세 방향을 현재 차트에 직접 투영하여 명확한 매크로 관점을 제공합니다. 약세/불확실한 바 감지: 추세
Divergence Bomber
Ihor Otkydach
4.9 (92)
이 지표를 구매하신 분께는 다음과 같은 혜택이 무료로 제공됩니다: 각 거래를 자동으로 관리하고, 손절/익절 수준을 설정하며, 전략 규칙에 따라 거래를 종료하는 전용 도우미 툴 "Bomber Utility" 다양한 자산에 맞게 지표를 설정할 수 있는 셋업 파일(Set Files) "최소 위험", "균형 잡힌 위험", "관망 전략" 모드로 설정 가능한 Bomber Utility의 셋업 파일 이 전략을 빠르게 설치, 설정, 시작할 수 있도록 돕는 단계별 영상 매뉴얼 주의: 위의 모든 보너스를 받기 위해서는 MQL5 개인 메시지 시스템을 통해 판매자에게 연락해 주세요. 독창적인 커스텀 지표인 “Divergence Bomber(다이버전스 봄버)”를 소개합니다. 이 지표는 MACD 다이버전스(괴리) 전략을 기반으로 한 올인원(All-in-One) 거래 시스템입니다. 이 기술 지표의 주요 목적은 가격과 MACD 지표 간의 다이버전스를 감지하고, **향후 가격이 어느 방향으로 움직일지를 알려주는
Gann Made Easy MT5
Oleg Rodin
5 (7)
Gann Made Easy 는 mr.의 이론을 사용하여 최고의 거래 원칙을 기반으로 하는 전문적이고 사용하기 쉬운 Forex 거래 시스템입니다. W.D. 간. 이 표시기는 Stop Loss 및 Take Profit Levels를 포함하여 정확한 BUY 및 SELL 신호를 제공합니다. PUSH 알림을 사용하여 이동 중에도 거래할 수 있습니다. 구매 후 거래 방법 안내 및 유용한 추가 지표를 무료로 받으시려면 저에게 연락주세요! 아마도 Gann 거래 방법에 대해 이미 여러 번 들었을 것입니다. 일반적으로 Gann의 이론은 초보자 거래자뿐만 아니라 이미 거래 경험이 있는 사람들에게도 매우 복잡한 것입니다. Gann의 거래 방식은 이론적으로 적용하기 쉽지 않기 때문입니다. 나는 그 지식을 연마하고 Forex 지표에 최고의 원칙을 적용하기 위해 몇 년을 보냈습니다. 표시기는 적용하기가 매우 쉽습니다. 차트에 첨부하고 간단한 거래 권장 사항을 따르기만 하면 됩니다. 지표는 지속적으로 시장 분석
The Oracle Pro
Ottaviano De Cicco
The Oracle Pro: Synthetic Multi-Timeframe Bias Engine for MT5 ️ Summer Launch Offer — Get The Oracle Pro for USD 199 (early buyers). Price rises with traction; final price USD 399. The Oracle Pro is a premium multi-timeframe bias engine for MetaTrader 5, built for demanding and professional traders. It answers one question with discipline: what is the directional bias on each timeframe right now, how strong is it, and how much do the timeframes agree? Everything is computed on closed bars only
Trend Catcher ind mt5
Ramil Minniakhmetov
5 (8)
트렌드 캐처 인디케이터 트렌드 캐처 인디케이터는 개발자가 자체 개발한 맞춤형 적응형 트렌드 분석 지표들을 조합하여 시장 가격 움직임을 분석합니다. 단기적인 노이즈를 제거하고 근본적인 모멘텀 강도, 변동성 확대, 가격 구조 움직임에 집중하여 진정한 시장 방향을 파악합니다. 또한 이동 평균, RSI, 변동성 필터와 같은 맞춤형 지표들을 활용하여 가격을 평활화하고 트렌드를 필터링합니다. 실제 운영 모니터링 및 기타 제품은 다음 링크에서 확인하실 수 있습니다:   https://www.mql5.com/en/users/mechanic/seller 텔레그램에서는 EA나 설정 파일을 판매하지 않습니다. 사기이니 주의하세요. 모든 설정 파일은 블로그에서 무료로 제공됩니다. 중요! 구매 후 즉시 연락 주시면 사용 방법 및 보너스를 드립니다!
UZFX {SSS} 스캘핑 스마트 시그널 v4.0 MT5는 급변하는 시장에서 정확한 실시간 시그널을 필요로 하는 스캘퍼, 데이 트레이더, 스윙 트레이더를 위해 설계된 리페인팅이 없는 고성능 트레이딩 지표입니다. (UZFX-LABS)에서 개발한 이 지표는 가격 움직임 분석, 추세 확인 및 스마트 필터링을 결합하여 모든 통화 쌍과 시간대에서 높은 확률의 매수 및 매도 신호, 경고 신호, 추세 지속 기회를 생성합니다. 거래에 대한 의구심을 떨쳐버리고, 명확성, 정밀성, 그리고 규율 있는 시장 실행을 원하는 트레이더를 위해 설계된 체계적인 신호 시스템을 따르기 시작하세요. 제 추천* 최적의 시간대: 15분 이상. {H1}이 제가 가장 선호하는 시간대입니다. 그리고 그 결과는 정말 놀라울 정도입니다...!! 주요 기능 업데이트 • 자동 매수 및 매도 신호 감지 • 고급 반전 인식 로직 • 잠재적인 시장 반전 전 조기 경고 신호 • 추세 지속 확인 신호 • 진입, 손절, TP1, TP2,
Transaction Speed MT5
Ivan Stefanov
5 (3)
이 지표는 시장에서 관심이 나타나는 영역 을 강조 표시한 후, 주문이 누적되는 영역 을 보여줍니다. 이는 **대규모 오더북(호가창)**처럼 작동합니다. 이것은 거대한 자금 을 위한 인디케이터입니다. 성능은 탁월하며, 시장에서 어떤 관심이 있든 반드시 포착할 수 있습니다 . (이것은 완전히 새로 작성되고 자동화된 버전 입니다 – 이제 수동 분석은 필요하지 않습니다.) **거래 속도(Transaction Speed)**는 새로운 개념의 인디케이터로, 시장에 대규모 주문이 언제, 어디에 쌓이는지를 보여주며 , 그 이점을 분석합니다. 매우 초기 단계에서 트렌드 전환 을 감지할 수 있습니다. FX 시장에서 흔히 사용하는 "거래량(volume)"은 오해입니다. 실제로는 시간당 가격 변화량 이므로, 올바른 용어는 거래 속도 입니다. 우리가 어떻게 사고하고, 행동하며, 분석하느냐 가 가장 중요합니다. 분석 패러다임의 전환 은 필수적입니다. 이 인디케이터는 외환 시장에서의 볼륨 개념을 논리적으로
Gem SIGNAL
Shengzu Zhong
5 (1)
GEM Signal Pro GEM Signal Pro는 MetaTrader 5용 추세추종형 지표로, 차트에서 더 명확한 신호, 더 구조적인 트레이드 설정, 그리고 더 실용적인 리스크 관리를 원하는 트레이더를 위해 설계되었습니다. 단순한 화살표만 표시하는 것이 아니라, GEM Signal Pro는 전체 트레이드 아이디어를 더 깔끔하고 읽기 쉬운 방식으로 보여줍니다. 조건이 확인되면 진입가, 손절가, 목표가를 차트에 표시하여 트레이더가 설정을 더 효율적으로 검토할 수 있도록 도와줍니다. 작동 방식 이 지표는 먼저 내부 로직에 따라 유효한 초기 신호를 식별합니다. 확인 조건이 충족되면, GEM Signal Pro는 차트에 전체 설정을 표시합니다. 이를 통해 트레이더는 거래 구조를 더 명확하게 보고, 수동 분석 작업을 줄일 수 있습니다. 차트에 표시되는 거래 레벨 확인된 신호에 대해, GEM Signal Pro는 다음을 표시할 수 있습니다. 진입가 손절가 목표가 1 목표가 2 목표가 3 손
Atomic Analyst MT5
Issam Kassas
4.26 (39)
이 제품은 2026년 시장에 맞게 업데이트되었으며 최신 MT5 빌드에 최적화되었습니다. 가격 업데이트 안내: Atomic Analyst는 현재 $99 에 제공됩니다. 다음 30회 구매 후 가격은 $199 로 인상됩니다. 특별 혜택: Atomic Analyst 구매 후 저에게 개인 메시지를 보내시면 Smart Universal EA를 무료 로 받을 수 있으며, Atomic Analyst 신호를 자동 거래로 전환할 수 있습니다. Atomic Analyst는 리페인트 없음, 재그리기 없음, 지연 없음의 Price Action 거래 인디케이터로, 수동 거래, 신호 명확성, EA 자동화를 위해 설계되었습니다. User manual: settings, inputs and strategy.   &   User Manual PDF . 가격 움직임, 강도, 모멘텀, 다중 시간대 방향 및 고급 필터를 분석하여 트레이더가 노이즈를 줄이고 약한 세팅을 피하며 더 체계적인 거래 결정을 내릴 수 있도록
GoldenX Entry MT5
Kareem Abbas
5 (14)
GoldenX Entry는 MT5용 인디케이터로, 적응형 Smart Entry Trend 알고리즘, 신호 스코어링 시스템, 시장 레짐 감지 기능, 그리고 변동성 필터를 포함합니다. 각 신호에는 계산된 진입 레벨, 3개의 익절(TP1, TP2, TP3) 레벨, 그리고 손절(Stop-Loss) 레벨이 포함됩니다. 이 인디케이터는 다양한 시장 환경에 적응하도록 설계된 다중 분석 레이어 구조 위에 구축되어 있으며, 내장 최적화기와 통계 추적 시스템을 결합합니다. 또한 Risk-to-Reward(RR) 지표와 과거 거래 행동 기반의 정량 분석을 제공합니다. 시작은 간단합니다 — 선택한 타임프레임에서 최적화기를 실행한 뒤 차트에서 바로 인디케이터를 사용하면 됩니다. 핵심 기능 GoldenX Entry는 하나의 차트에서 신호 엔진, 트레이드 관리 기능, 그리고 과거 통계 추적을 통합합니다: - 내장 최적화기: 최적화기는 차트에서 원클릭으로 실행됩니다. 200개의 파라미터 조합을 두 단계 탐색
소개       Quantum Breakout PRO   , 브레이크아웃 존 거래 방식을 변화시키는 획기적인 MQL5 지표! 13년 이상의 거래 경험을 가진 숙련된 트레이더 팀이 개발한       퀀텀 브레이크아웃 PRO       혁신적이고 역동적인 브레이크아웃 존 전략으로 거래 여정을 새로운 차원으로 끌어올리도록 설계되었습니다. Quantum Breakout Indicator는 5개의 이익 목표 영역이 있는 브레이크아웃 영역의 신호 화살표와 브레이크아웃 상자를 기반으로 한 손절 제안을 제공합니다. 초보자 거래자와 전문 거래자 모두에게 적합합니다. Quantum EA 채널:       여기를 클릭하세요 중요한! 구매 후 설치 매뉴얼을 받으려면 개인 메시지를 보내주십시오. 추천: 기간: M15 통화쌍: GBPJPY, EURJPY, USDJPY,NZDUSD, XAUUSD 계정 유형: 스프레드가 매우 낮은 ECN, Raw 또는 Razor 브로커 시간: GMT +3 중개인 :
FX Trend MT5 NG
Daniel Stein
5 (6)
FX Trend NG: 차세대 멀티 마켓 트렌드 인텔리전스 개요 FX Trend NG 는 다중 시간 프레임 기반의 전문 트렌드 분석 및 시장 모니터링 도구입니다. 몇 초 만에 전체 시장 구조를 파악할 수 있도록 설계되었습니다. 여러 차트를 일일이 전환할 필요 없이, 어떤 종목이 추세에 있는지, 어디에서 모멘텀이 약화되고 있는지, 그리고 어떤 시간 프레임이 서로 정렬되어 있는지 즉시 확인할 수 있습니다. 출시 기념 특별 혜택 – FX Trend NG 를 $30 (6개월) 또는 $80 평생 라이선스 로 이용할 수 있습니다. 이미 Stein Investments 고객이신가요? -> 메시지를 보내 전용 고객 그룹에 참여하세요. 설정이나 사용 방법이 필요하신가요? -> Stein Investments 공식 페이지 를 방문하세요. 1. FX Trend NG가 특별한 이유 3단계 추세 로직 – 단순한 Buy / Sell이 아닙니다 • 대부분의 지표는 Buy 또는 Sell 두 가지 상태만 제
ARIPoint
Temirlan Kdyrkhan
1 (1)
ARIPoint is a powerful trading companion designed to generate high-probability entry signals with dynamic TP/SL/DP levels based on volatility. Built-in performance tracking shows win/loss stats, PP1/PP2 hits, and success rates all updated live. Key Features: Buy/Sell signals with adaptive volatility bands Real-time TP/SL/DP levels based on ATR Built-in MA Filter with optional ATR/StdDev volatility Performance stats panel (Success, Profit/Loss, PP1/PP2) Alerts via popup, sound, push, or email Cu
FX Power MT5 NG
Daniel Stein
5 (33)
FX Power: 통화 강세 분석으로 더 스마트한 거래 결정을 개요 FX Power 는 어떤 시장 상황에서도 주요 통화와 금의 실제 강세를 이해하기 위한 필수 도구입니다. 강한 통화를 매수하고 약한 통화를 매도함으로써 FX Power 는 거래 결정을 단순화하고 높은 확률의 기회를 발견합니다. 트렌드를 따르거나 극단적인 델타 값을 사용해 반전을 예측하고자 한다면, 이 도구는 귀하의 거래 스타일에 완벽히 적응합니다. 단순히 거래하지 말고, FX Power 로 더 스마트하게 거래하세요. 1. FX Power가 거래자에게 매우 유용한 이유 통화와 금의 실시간 강세 분석 • FX Power 는 주요 통화와 금의 상대적 강세를 계산하고 표시하여 시장 역학에 대한 명확한 통찰력을 제공합니다. • 어떤 자산이 앞서고 있고 어떤 자산이 뒤처지는지 모니터링하여 보다 현명한 거래 결정을 내릴 수 있습니다. 포괄적인 멀티 타임프레임 뷰 • 단기, 중기 및 장기 타임프레임에서 통화와 금의 강세를
Axiom Matrix
Issam Kassas
5 (3)
AXIOM MATRIX MT5 출시 가격: $99 Axiom Matrix는 출시 가격 $99에 제공됩니다. 첫 30회 구매 이후 가격은 $199로 인상됩니다. 구매 후, 안내 사항을 받고 독점 선물 보너스를 받기 위해 저에게 직접 DM을 보내주세요. Axiom Matrix는 MetaTrader 5용 전문 멀티 심볼, 멀티 타임프레임 시장 스캐너이자 의사결정 대시보드입니다. Axiom Matrix는 사용자의 Market Watch를 스캔하고, 여러 타임프레임을 분석하며, 여러 근거 엔진을 읽고, 가장 강한 기회를 비교하여 하나의 깔끔한 매트릭스 대시보드 안에서 최적의 BUY, SELL, WAIT 또는 차단 상태를 보여줍니다. 저는 무거운 시장 스캔 작업을 대신 처리해 줄 수 있는 하나의 도구가 필요했기 때문에 Axiom Matrix를 만들었습니다. 저는 RSI만 따로 확인하고 싶지 않았습니다. 그다음 MACD만 따로 확인하고. 그다음 이동평균. 그다음 거래량. 그다음 변동성. 그다음
Advanced Supply Demand MT5
Bernhard Schweigert
4.53 (15)
현재 33% 할인! 초보자나 전문 트레이더를 위한 최고의 솔루션! 이 보조지표는 우리가 다수의 독창적 기능과 새로운 공식을 통합한 독특하고 고품질이며 저렴한 거래 도구입니다. 이 업데이트를 통해 이중 시간대를 표시할 수 있습니다. 더 높은 TF를 표시할 수 있을 뿐만 아니라 차트 TF와 더 높은 TF 모두를 표시할 수 있습니다: 중첩 영역 표시. 모든 Supply Demand 트레이더들이 좋아할 것입니다. :) 중요한 정보 공개 Advanced Supply Demand의 잠재력을 극대화하려면 다음을 방문하십시오. https://www.mql5.com/ko/blogs/post/720245   진입 또는 목표의 명확한 트리거 포인트를 정확히 찾아냄으로 해서 거래가 어떻게 개선될지 상상해 보십시오. 새로운 알고리즘을 기반으로 매수자와 매도자 간의 잠재적인 불균형을 훨씬 더 쉽게 분간할 수 있습니다. 왜냐하면 가장 강한 공급영역과 가장 강한 수요 영역과 과거에 어떻게 진행 되었는지를(이전
Reversion King Indicator
Eugen-alexandru Zibileanu
5 (5)
새로운 왕의 등장 - 인디케이터 + 주문 관리 표시(TP1 + TP2 + TP3) + 선택형 텔레그램 시그널 전송 기능 포함 (무료) (완전한 트레이딩 및 시그널 시스템) 골드를 위한 최고의 EA: Gold Slayer 이 인디케이터는 고급 전략, 사용자 지정 가능한 주문 관리 시스템, 그리고 엔벨로프 확장을 결합한 평균 회귀(mean reversion) 시스템을 포함하고 있습니다. 또한 RSI와 같은 여러 지능형 확인 필터를 통해 높은 확률의 반전 진입 구간을 포착하여 BUY 및 SELL 시그널을 제공합니다. 단순히 거래 방법만 배우는 것이 아니라, 여러 포지션을 효과적으로 관리하고 이전에 수익 중인 오픈 포지션으로 손실 거래를 커버하는 방법까지 익힐 수 있습니다. M5 전용으로 설계 및 최적화되었으며, 유동성이 풍부해 시그널이 더 깔끔하고 신뢰도 높은 BTCUSD와 XAUUSD에서 뛰어난 성능을 발휘합니다. 이 인디케이터는 ATR 기반으로 자동 계산된 진입가, 손절가, 익절가와
Quantum TrendPulse
Bogdan Ion Puscasu
5 (25)
SuperTrend   ,   RSI   ,   Stochastic   의 힘을 하나의 포괄적인 지표로 결합하여 트레이딩 잠재력을 극대화하는 궁극의 트레이딩 도구   인 Quantum TrendPulse를   소개합니다. 정밀성과 효율성을 추구하는 트레이더를 위해 설계된 이 지표는 시장 추세, 모멘텀 변화, 최적의 진입 및 종료 지점을 자신 있게 식별하는 데 도움이 됩니다. 주요 특징: SuperTrend 통합:   주요 시장 추세를 쉽게 따라가고 수익성의 물결을 타세요. RSI 정밀도:   매수 과다 및 매도 과다 수준을 감지하여 시장 반전 시점을 파악하는 데 적합하며 SuperTrend 필터로 사용 가능 확률적 정확도:   변동성이 큰 시장에서 숨겨진 기회를 찾기 위해 확률적 진동   을 활용하고 SuperTrend의 필터로 사용 다중 시간대 분석:   M5부터 H1 또는 H4까지 다양한 시간대에 걸쳐 시장을 최신 상태로 유지하세요. 맞춤형 알림:   맞춤형 거래 조건이 충족되면
Meridian Pro
Ottaviano De Cicco
5 (2)
Meridian Pro 2.00: Professional Multi-Timeframe Trend Matrix for MT5 Meridian Pro 2.00 is a professional adaptive trend matrix for MetaTrader 5. It combines the original Meridian trend engine, a clean chart ribbon, closed-bar signal arrows, an 8-timeframe dashboard, Fuel momentum, weighted consensus, synthetic HTF processing and chart-native higher-timeframe context lines. The goal is simple: read current trend, multi-timeframe structure, strength, momentum and EA-ready state from one discipline
이 제품은 2026년 시장에 맞게 업데이트되었으며 최신 MT5 빌드에 최적화되었습니다. 가격 업데이트 안내: Smart Price Action Concepts는 현재 $200 에 제공됩니다. 다음 30회 구매 후 가격은 $299 로 인상됩니다. 특별 혜택: 구매 후 저에게 개인 메시지를 보내시면 무료 보너스 + 선물 을 받을 수 있습니다. 먼저, 이 트레이딩 도구는 리페인트 없음, 재그리기 없음, 지연 없음의 인디케이터이므로 전문적인 트레이딩에 적합하다는 점을 강조하고 싶습니다. Online course , and manual Smart Price Action Concepts Indicator는 초보자와 경험 많은 트레이더 모두에게 매우 강력한 도구입니다. 20개 이상의 유용한 인디케이터를 하나로 결합하고, Inner Circle Trader Analysis와 Smart Money Concepts Trading Strategies 같은 고급 트레이딩 아이디어를 통합합니다. 이 인디
Atbot
Zaha Feiz
4.69 (54)
AtBot: 작동 방식 및 사용 방법 ### 작동 방식 MT5 플랫폼용 "AtBot" 지표는 기술 분석 도구의 조합을 사용하여 매수 및 매도 신호를 생성합니다. 01:37 단순 이동 평균(SMA), 지수 이동 평균(EMA), 평균 진폭 범위(ATR) 지수를 통합하여 거래 기회를 식별합니다. 또한 Heikin Ashi 캔들을 사용하여 신호의 정확성을 향상시킬 수 있습니다. 구매 후 리뷰를 남기면 특별 보너스 선물을 받게 됩니다. ### 주요 기능: - 비재표시: 신호는 플로팅 후 변경되지 않습니다. - 비재작성: 신호는 일관되며 변경되지 않습니다. - 지연 없음: 지연 없이 시기적절한 신호를 제공합니다. - 다양한 시간대: 거래 전략에 맞게 모든 시간대에서 사용할 수 있습니다. ### 운영 단계: #### 입력 및 설정: - firstkey (TrendValue): 추세 감지의 민감도를 조정합니다. - Secondkey (SignalValue): 매수/매도 신호 생성의 민감도를 정의
Azimuth Pro
Ottaviano De Cicco
5 (7)
Azimuth Pro V2: Synthetic Fractal Structure and Confirmed Entries for MT5 Overview Azimuth Pro is a multi-level swing structure indicator by Merkava Labs . Four nested swing layers, swing-anchored VWAP, ABC pattern detection, three-timeframe structural filtering, and closed-bar confirmed entries — one chart, one workflow from micro-swings to macro-cycles. This is not a blind signal product. It is a structure-first workflow for traders who care about location, context, and timing. ️ Summer Sale
제작자의 제품 더 보기
Fimathe Painel
Thiago Pereira Pinho
5 (1)
Fimathe 3.0: Your Intelligent EA for Trend Detection and Automated Trades! Discover the power of Fimathe (strategy created by Marcelo Ferreira), now with integrated automation for precise and profitable entries in MetaTrader 5. Designed for traders seeking efficiency, this Expert Advisor combines advanced trend analysis with an intuitive and customizable panel. Trade with confidence, minimize risks, and maximize gains! Key Features: Customizable Panel: Choose the size and position of the panel t
Indicador Fimathe
Thiago Pereira Pinho
5 (4)
Fimathe Indicator The   Fimathe Indicator   is a tool for MetaTrader 5 designed to help traders identify support, resistance, neutral zones, and price channels. It features an interactive interface for drawing and managing support and resistance levels, generating take-profit channels and neutral zones, and providing visual and sound alerts for breakouts. Key Features Support and Resistance Lines: Dynamic and draggable lines to identify key levels. Reference Channel: Creates a channel between su
FREE
The Dynamic Market Profile allows you to analyze the volume of any specific chart region manually and instantly. No more being restricted to fixed daily or weekly profiles: you choose the exact move, consolidation, or trend leg you want to analyze . The indicator lets you draw up to 5 independent areas at the same time using interactive rectangles . How It Works on a Daily Basis Create the zone: Press keys 1, 2, 3, 4, or 5 on your keyboard (or use the on-screen buttons) to plot a rectangle . A
FREE
Follow Line
Thiago Pereira Pinho
4 (1)
The Follow Line Indicator is an essential technical analysis tool that provides a clear, immediate visualization of the trend while detecting high-probability reversals in real-time. By combining adaptive price tracking with clear visual alerts, it transforms complex data into actionable trading signals. Key Features Dynamic Trend Line: Tracks the market's prevailing direction, automatically adjusting to each new price extreme. Clear Colors: The line turns Blue during uptrends and Red during dow
FREE
Kairi Ritsu KRI MT5
Thiago Pereira Pinho
5 (1)
The Kairi Ritsu (KRI) is a technical momentum oscillator primarily used to identify overextended market conditions. It measures the percentage deviation of the current price from its Moving Average. Here is a guide on how to interpret and trade using this indicator: 1. Core Logic: Mean Reversion The fundamental principle of the KRI is that prices eventually return to their average. When the KRI is at a high positive value , the price is "stretched" too far above the average (Overbought). When th
FREE
ADX Histogram Indicator
Thiago Pereira Pinho
The   ADX  Histogram   is a modern and visual upgrade of the classic   Average Directional Index (ADX) . It transforms the standard ADX and DI+ / DI– values into a   color-coded histogram , making trend analysis much clearer and faster.  Key Features: Histogram with four states :  Blue = Normal Buy Trend Green = Strong Buy Trend  Orange = Normal Sell Trend  Red = Strong Sell Trend Automatic strength detection : uses the ADX line to separate “normal” vs. “strong” signals.  Fully customizable: ADX
FREE
Kairi Ritsu KRI
Thiago Pereira Pinho
The Kairi Ritsu (KRI) is a technical momentum oscillator primarily used to identify overextended market conditions. It measures the percentage deviation of the current price from its Moving Average. Here is a guide on how to interpret and trade using this indicator: 1. Core Logic: Mean Reversion The fundamental principle of the KRI is that prices eventually return to their average. When the KRI is at a high positive value , the price is "stretched" too far above the average (Overbought). When th
FREE
DTK Scalping Panel
Thiago Pereira Pinho
A powerful and intuitive trade management tool designed for scalpers and intraday traders. Created to complement the Nampim Samba Scalper strategy , it allows traders to open, manage, and close positions quickly without leaving the chart.  Key Features: Customizable trading panel – choose position (left, right, center, top, bottom). One-click trading buttons – instantly open Buy/Sell trades with pre-set lot sizes. Close management – close last 1/2/3 trades or all Buy/Sell positions with one clic
FREE
Keltner Channels Modern
Thiago Pereira Pinho
The Keltner Channel Pro is a modern and enhanced version of the classic Keltner Channel , designed for traders who want to identify trends, reversals, and overbought/oversold zones with greater accuracy.  Built with EMA (Exponential Moving Average) and ATR (Average True Range) , this indicator automatically adapts to market volatility, providing dynamic channels that help filter noise and improve trade timing.  Key Features: Main channel (upper, middle, and lower) based on EMA + ATR. Optional ad
FREE
Volume Compair
Thiago Pereira Pinho
5 (1)
Professional Cumulative Delta & Volume Median Indicator Track   real buying/selling pressure   with this powerful volume analysis tool. The   Volume Compare Indicator   combines   Cumulative Delta   and   Volume Medians   to help you identify institutional activity, imbalances, and potential reversals. Key Features: Cumulative Delta Histogram   – Visualizes net buying vs. selling volume in real-time. Buy/Sell Volume Medians   – Horizontal lines showing average buy & sell volume levels. Smart Vo
Follow Line MT4
Thiago Pereira Pinho
Stop chasing the market. The Follow Line Indicator provides clear, high-probability signals right on your chart. This advanced tool features a Dynamic Trend Line that instantly adapts to market structure. It’s your immediate visual reference: Blue means you're in an uptrend, and Red signals a downtrend. The core function tracks price extremes and volatility to define the true trend strength. The best part is the automatic signal generation: Buy Arrow: Appears when the trend line flips from Red t
FREE
Real Flow Defense Levels
Thiago Pereira Pinho
The   Real Flow Defense Levels   indicator is a proprietary tool designed to identify and plot   significant, high-conviction price zones   directly onto your main trading chart. It uses a dynamic, volume-based analysis to determine where the market has previously demonstrated the   strongest defense or concentration of activity . These plotted lines serve as   dynamic support and resistance levels , highlighting the prices where major participants are most likely to enter or defend their positi
FREE
VForce Pro MT4
Thiago Pereira Pinho
5 (1)
**V-FORCE PRO - MetaTrader 5를 위한 고급 거래량 지표** **V-Force Pro로 실제 거래량의 힘을 발견하세요 - 시장 분석의 혁명!** **더 이상 어둠 속에서 거래하지 마세요! 실시간으로 대형 투자자들의 힘을 시각화하세요.** **모든 트레이더가 직면하는 문제:** 모든 기술적 지표가 같은 방향을 가리키는데도 왜 일부 시장 움직임은 실패할까요? 그 해답은 **실제 거래량**에 있습니다 - 대부분의 트레이더들이 간과하는 퍼즐의 가장 중요한 조각입니다! **V-Force Pro 5.3 - Speed Edition을 소개합니다** 단순한 히스토그램을 넘어서, 각 움직임 뒤에 숨겨진 **진정한 강도**를 드러내는 유일무이한 거래량 지표입니다! **독점적인 기능:** **1. 다단계 지배력 분석** *   **강력한 강세(진한 파랑):** 강한 확신을 가진 **매수** 거래량이 지배적 *   **약한 강세(연한 파랑):** 매수 압력은 있지만 주저함이
CMF Scalping
Thiago Pereira Pinho
Dynamic CMF Calculation: Customize the period for the Chaikin Money Flow (CMF) to fine-tune your analysis and maximize signal precision. Intuitive Color-Coded Alerts: Instantly interpret market conditions with clear visual cues: Green Alert: Indicates the Overbought zone – signaling a potential selling opportunity. Red Alert: Indicates the Oversold zone – suggesting a potential buying opportunity. Gray Alert: Represents the Neutral zone – a signal to wait for a confirmed trend or reversal. Autom
Market Profile TPO MT4
Thiago Pereira Pinho
The   MarketProfileTPO   indicator for MetaTrader 5 is a powerful tool designed to bring the   Market Profile concept, based on Time Price Opportunity (TPO) analysis , directly onto your main chart window. This indicator calculates and displays the price distribution over a specified period, highlighting key areas of market activity and concentration. It is particularly optimized for   high-volatility instruments   like   NAS100, US30, and XAUUSD   when used on the M1 (1-minute) timeframe, offer
Volume Compair Indicator
Thiago Pereira Pinho
It allows traders to better understand the balance between buying and selling pressure, providing clear visual signals for potential reversals and breakouts .  Key Features:   Cumulative Delta Volume : separates buying and selling pressure in real time. Median Buy & Sell Volume lines : highlight equilibrium zones in order flow. Volume Velocity Factor : adjusts delta strength based on sudden volume changes. Smart MFI Alerts : automatic buy/sell arrows appear when Money Flow Index (MFI) reaches ov
VForce Pro
Thiago Pereira Pinho
**V-FORCE PRO - MetaTrader 5를 위한 고급 거래량 지표** **V-Force Pro로 실제 거래량의 힘을 발견하세요 - 시장 분석의 혁명!** **더 이상 어둠 속에서 거래하지 마세요! 실시간으로 대형 투자자들의 힘을 시각화하세요.** **모든 트레이더가 직면하는 문제:** 모든 기술적 지표가 같은 방향을 가리키는데도 왜 일부 시장 움직임은 실패할까요? 그 해답은 **실제 거래량**에 있습니다 - 대부분의 트레이더들이 간과하는 퍼즐의 가장 중요한 조각입니다! **V-Force Pro 5.3 - Speed Edition을 소개합니다** 단순한 히스토그램을 넘어서, 각 움직임 뒤에 숨겨진 **진정한 강도**를 드러내는 유일무이한 거래량 지표입니다! **독점적인 기능:** **1. 다단계 지배력 분석** *   **강력한 강세(진한 파랑):** 강한 확신을 가진 **매수** 거래량이 지배적 *   **약한 강세(연한 파랑):** 매수 압력은 있지만 주저함
CMF Scalping Indicator
Thiago Pereira Pinho
Dynamic CMF Calculation: Customize the period for the Chaikin Money Flow (CMF) to fine-tune your analysis and maximize signal precision. Intuitive Color-Coded Alerts: Instantly interpret market conditions with clear visual cues: Green Alert: Indicates the Overbought zone – signaling a potential selling opportunity. Red Alert: Indicates the Oversold zone – suggesting a potential buying opportunity. Gray Alert: Represents the Neutral zone – a signal to wait for a confirmed trend or reversal. Autom
The MarketProfileTPO indicator for MetaTrader 5 is a powerful tool designed to bring the Market Profile concept, based on Time Price Opportunity (TPO) analysis , directly onto your main chart window. This indicator calculates and displays the price distribution over a specified period, highlighting key areas of market activity and concentration. It is particularly optimized for high-volatility instruments like NAS100, US30, and XAUUSD when used on the M1 (1-minute) timeframe, offering a detailed
Sync
Thiago Pereira Pinho
5 (1)
**Sync MT5 – Real-Time Multi-Chart Analysis Manager** chart sync Transform your MT5 platform into a professional analysis workstation. Sync is a comprehensive tool that synchronizes charts, objects, and crosshairs across multiple windows, allowing you to trade with unprecedented precision and efficiency. **MAIN FEATURES** 1. **Smart Chart Synchronization**    - Synchronize symbols and timeframes across multiple charts with one click.    - Group system – Organize your charts by strategy or as
Price Compass
Thiago Pereira Pinho
프라이스 컴파스 는 금융 시장에서 추세 내비게이션 시스템 역할을 하도록 설계된 강력한 기술 분석 도구입니다. 이 지표는 시장의 평균적인 방향성 압력 을 평가하여 단기적인 노이즈를 효과적으로 걸러내고, 지배적인 움직임을 명확하게 식별합니다. 현재 가격이 '중앙 평균'에서 얼마나 벗어나 있는지 정량화하여, 시장 방향 에 대한 정확한 신호(강세, 약세 또는 중립)를 제공합니다. 해석 (나침반의 세 가지 상태) (Interpretação - Os Três Estados do Compass) 이 지표는 제로 라인 을 중심으로 별도의 보조 창에 표시되며, 현재 시장 상태를 알리기 위해 세 가지 다른 색상을 사용합니다: 나침반 상태 (Estado do Compass) 위치 (Localização) 신호 (Sinalização) 해석 (Interpretação) 북쪽 (강세) 제로 라인 위 긍정 (Positive) 시장이 강한 매수 압력 하에 있음을 나타냅니다. 상승 추세 의 시작 또는 지속을 시
필터:
리뷰 없음
리뷰 답변