Weis Waves RSJ

4.56

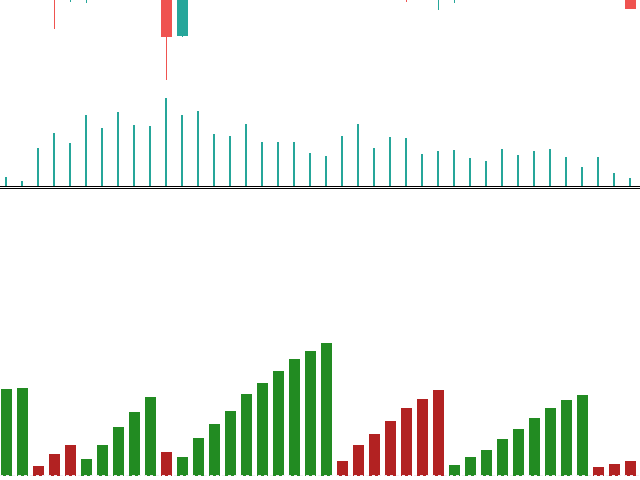
The Weis Waves RSJ Indicator sums up volumes in each wave.

This is how we receive a bar chart of cumulative volumes of alternating waves.

Namely the cumulative volume makes the Weis wave charts unique.

It allows comparing the relation of the wave sequence characteristics, such as correspondence of the applied force (expressed in the volume) and received result (the price progress).


If you still have questions, please contact me by direct message: https://www.mql5.com/en/users/robsjunqueira/


리뷰 14
Alessandro Lopes Da Silva
283
Alessandro Lopes Da Silva 2024.02.26 19:16 
 

Pessoal deixo aqui meu comentário e espero contribuir com voces! Esse indicador juntamente com medias moveis 9,21,50 no ativo US30 é uma maquina de fazer dinheiro, principalmente para quem trabalha com mesa proprietária. O melhor horário para operar é o de New York, excelentes gatilhos de entradas e saídas. Observação importante, procure sempre ir a favor da tendencia. No demais, muito obrigado Roberto Junqueira!!!

fj6hCuoc
119
fj6hCuoc 2023.09.12 09:46 
 

An excellent Volume Indicator

CARLOS CESTARI
33
CARLOS CESTARI 2022.03.31 05:12 
 

Muito bom, fica melhor se for usado junto com o Heiken_Ashi. Obrigado.

추천 제품
Weis Waves
Flavio Javier Jarabeck
2.83 (18)
The original author is David Weis, an expert in the Wyckoff Method. The Weis Wave is a modern adaptation of the 1930's Wyckoff Method, another expert in Tape Reading techniques and Chart Analysis. Weis Waves takes market volume and stacks it into waves according to price conditions giving the trader valuable insights about the market conditions. If you want to learn more about this subject you can find tons of videos in YouTube. Just look for "The Wickoff Method", "Weis Wave" and "Volume Spread
FREE
Weis Waves(와이스 웨이브) 는 데이비드 와이스(David Weis)가 개발하고 리차드 와이코프(Richard Wyckoff)의 원리에 기반한 기술적 지표입니다. 전통적인 거래량이 캔들마다 표시되는 것과 달리, Weis Waves는 거래량을 상승 또는 하락 “파동”으로 누적하며, 가격 방향이 바뀔 때마다 계산을 새로 시작합니다. 이 방법은 트레이더가 시장 움직임의 실제 힘 을 명확하게 파악할 수 있게 해줍니다. 각 파동은 일련의 캔들을 지탱하는 거래량의 강도를 보여줍니다. 주요 특징: 거래량을 매수 및 매도 파동으로 그룹화. 지배적인 압력(매수세 또는 매도세)을 강조. 추세 지속 또는 잠재적 반전 을 식별하는 데 도움. 와이코프 방법론에 기반하며, 거래량 및 흐름 분석에 널리 사용됨. Weis Waves는 가격과 거래량의 균형을 평가하기 위해 많은 전문 트레이더들이 활용하며, 시장 역학에 대한 더 깊은 통찰을 제공합니다.
FREE
Value Chart Candlesticks
Flavio Javier Jarabeck
4.69 (13)
The idea of a Value Chart indicator was presented in the very good book I read back in 2020 , " Dynamic Trading Indicators: Winning with Value Charts and Price Action Profile ", from the authors Mark Helweg and David Stendahl. The idea is simple and the result is pure genius: Present candlestick Price analysis in a detrended way! HOW TO READ THIS INDICATOR Look for Overbought and Oversold levels. Of course, you will need to test the settings a lot to find the "correct" one for your approach. It
FREE
Girassol Sunflower MT5 Indicator
Saullo De Oliveira Pacheco
3.86 (7)
This is the famous Sunflower indicator for Metatrader5. This indicator marks possible tops and bottoms on price charts. The indicator identifies tops and bottoms in the asset's price history, keep in mind that the current sunflower of the last candle repaints, as it is not possible to identify a top until the market reverses and it is also not possible to identify a bottom without the market stop falling and start rising. If you are looking for a professional programmer for Metatrader5, please
FREE
Waves Sizer
Flavio Javier Jarabeck
3.86 (7)
Wyckoff fans, enjoy! Ideally to be used with the Weis Waves indicator, but it can be easily used alone, the Waves Sizer puts the range (in resulting Price movement) done by the Price on its market swings. You can control how accurate or loose will be the swings. This tool is very helpful for visually know how much the Price has traveled in your Timeframe. This way you can confront this level of effort with the resulting Volume, etc... Weis Waves indicator: https://www.mql5.com/en/market/produc
FREE
Big Player Candles
Flavio Javier Jarabeck
4.91 (23)
If you heard about The Wyckoff Method, Volume Spread Analysis, etc... You are probably searching for the candlestick indicator that shows you the Volume spread all over the current bar, signaling every types of market status... You can control the several Market Levels with custom colors... It is up to you to decide how to use it. Our job is provide you with the indicator... If you like this indicator, all I am asking is a little Review (not a Comment, but a REVIEW! )...    This will mean A LO
FREE
Stackable VWAP
Flavio Javier Jarabeck
3.5 (4)
Volume Weighted Average Price (VWAP) is a trading benchmark commonly used by Big Players that gives the average price a Symbol has traded throughout the day. It is based on both Volume and price. Additionally we put in this indicator the MVWAP (Moving Volume Weighted Average Price). For those who do not know the usage and the importance od this indicator I recommend a great article about this subject at Investopedia ( https://www.investopedia.com/articles/trading/11/trading-with-vwap-mvwap.asp
FREE
Basic Vwap
james mugendi
4 (1)
Simple Vwap with the daily, weekly and monthly VWAP is the abbreviation for   volume-weighted average price , which is a technical analysis tool that shows the ratio of an asset's price to its total trade volume. It provides traders and investors with a measure of the average price at which a stock is traded over a given period of time. How it's used Identify entry and exit points:   Traders can use VWAP to determine when to buy or sell an asset.   Understand price trends :  Traders can use V
FREE
Tabajara V5
Flavio Javier Jarabeck
4.83 (36)
Metatrader 5 version of the famous Andre Machado's Tabajara indicator. If you don't know Andre Machado's Technical Analysis work you don't need this indicator... For those who need it and for those several friend traders who asked this porting from other platforms, here it is... FEATURES 8-period Moving Average 20-period Moving Average 50-period Moving Average 200-period Moving Average Colored candles according to the inflexion of the 20-period MA SETTINGS You can change the Period of all MA's
FREE
Quantitative Candlesticks Qstick
Flavio Javier Jarabeck
4 (2)
Qstick is a way to objectively quantify candlestick analysis and improve the interpretation of candlestick patterns. Qstick was developed by Tushar Chande and published in his book " The New Technical Trader - Boost Your Profit by Plugging Into the Latest Indicators (1994) ". Qstick is built based on a moving average of the difference between the Open and Close prices. The basis of the idea is that the Opening and Closing prices are the heart of candlestick analysis. We strongly recommend the re
FREE
Aggression Volume
Flavio Javier Jarabeck
4.29 (17)
Aggression Volume Indicator is the kind of indicator that is rarely found in the MQL5 community because it is not based on the standard Volume data provided by the Metatrader 5 platform. It requires the scrutiny of all traffic Ticks requested on the platform... That said, Aggression Volume indicator requests all Tick Data from your Broker and processes it to build a very special version of a Volume Indicator, where Buyers and Sellers aggressions are plotted in a form of Histogram. Additionally,
FREE
MIDAS Super VWAP
Flavio Javier Jarabeck
4.27 (11)
Imagine VWAP, MVWAP and MIDAS in one place... Well, you found it! Now you can track the movement of Big Players in various ways, as they in general pursue the benchmarks related to this measuring, gauging if they had good execution or poor execution on their orders. Traders and analysts use the VWAP to eliminate the noise that occurs throughout the day, so they can measure what prices buyers and sellers are really trading. VWAP gives traders insight into how a stock trades for that day and deter
FREE
Aggression Wave RSJ
JETINVEST
4.83 (6)
This indicator sums up the difference between the sells aggression and the buys aggression that occurred in each Candle, graphically plotting the waves of accumulation of the aggression volumes.   Through these waves an exponential average is calculated that indicates the direction of the business flow. Note: This indicator DOES NOT WORK for Brokers and/or Markets WITHOUT the type of aggression (BUY or SELL).   Be sure to try our Professional version with configurable features and alerts:  Agre
FREE
LT Donchian Channel
Thiago Duarte
4.86 (7)
Donchian Channel is an indicator created by Richard Donchian. It is formed by taking the highest high and the lowest low of the last specified period in candles. The area between high and low is the channel for the chosen period. Its configuration is simple. It is possible to have the average between the upper and lower lines, plus you have alerts when price hits one side. If you have any questions or find any bugs, please contact me. Enjoy!
FREE
Simple Weis Wave
Jean Jacques Huve Ribeiro
3.67 (3)
One of the best tools for analyzing volume, Weis Wave was idelized by David Weis, to facilitate the reading of directional flow. For the VSA method disciples it is an evolution of the practices created by Richard Wycoff, facilitating a predictive reading of the market, always seeking an accumulation and distribution of the negotiated contracts. Cumulative wave volume  Range of wave ( removed) Average Wave volume Ref "Tim Ord lectures" ( removed)
FREE
MACD Enhanced
Nikita Berdnikov
5 (3)
Introducing the MACD  Enhanced – an advanced MACD (Moving Average Convergence Divergence) indicator that provides traders with extended capabilities for trend and momentum analysis in financial markets. The indicator uses the difference between the fast and slow exponential moving averages to determine momentum, direction, and strength of the trend, creating clear visual signals for potential entry and exit points. Attention! To achieve the best results, it is recommended to adapt the indicator
FREE
VisualVol EURUSD
Maxim Kuznetsov
The indicator highlights the points that a professional trader sees in ordinary indicators. VisualVol visually displays different volatility indicators on a single scale and a common align. Highlights the excess of volume indicators in color. At the same time, Tick and Real Volume, Actual range, ATR, candle size and return (open-close difference) can be displayed. Thanks to VisualVol, you will see the market periods and the right time for different trading operations. This version is intended f
FREE
VWAP and MVWAP
Flavio Javier Jarabeck
3.88 (8)
Volume Weighted Average Price (VWAP) is a trading benchmark commonly used by Big Players that gives the average price a Symbol has traded throughout the day. It is based on both Volume and price. Additionally we put in this indicator the MVWAP (Moving Volume Weighted Average Price). For those who do not know the usage and the importance od this indicator I recommend a great article about this subject at Investopedia ( https://www.investopedia.com/articles/trading/11/trading-with-vwap-mvwap.asp )
FREE
Phoenix Delta Volume
Nigel Nii Darku Narnor Darko
This is the Phoenix Institutional SMC Dashboard (Emerald-Teal Edition). It is engineered to provide retail traders with the same "Volume-at-Price" clarity used by institutional desks. Below is a full breakdown of the benefits, the high-confluence logic for entries, and how to manage your trades using the current visual engine. Strategic Benefits to the User Sentiment over Price: Most indicators only look at where the price is. This dashboard tells you how much effort (Volume Delta) was required
FREE
Donchian Breakout And Rsi
Mattia Impicciatore
5 (1)
개요 이 지표는 클래식 돈치안 채널(Donchian Channel) 의 향상된 버전으로, 실전 트레이딩을 위한 다양한 기능이 추가되었습니다. 표준 세 개의 선(상단, 하단, 중앙선) 외에도 브레이크아웃 을 감지하여 차트에 화살표로 시각적으로 표시하며, 차트를 깔끔하게 보기 위해 현재 추세 방향의 반대 라인만 표시 합니다. 지표 기능: 시각적 신호 : 브레이크아웃 시 컬러 화살표 표시 자동 알림 : 팝업, 푸시 알림, 이메일 RSI 필터 : 시장의 상대 강도를 기반으로 신호 검증 사용자 맞춤 설정 : 색상, 선 두께, 화살표 코드, RSI 임계값 등 동작 원리 돈치안 채널은 다음을 계산합니다: 상단선 : 최근 N개의 종가 완료 캔들에서 가장 높은 고가 하단선 : 최근 N개의 종가 완료 캔들에서 가장 낮은 저가 중앙선 : 고가와 저가의 평균값 상방 브레이크아웃 은 종가가 상단선을 돌파할 때 발생하며, 하방 브레이크아웃 은 종가가 하단선 아래로 내려갈 때 발생합니다. 이 지표는: 세 개의
FREE
Wave Box Market Frenquency
Jean Jacques Huve Ribeiro
4.75 (4)
Totally linked to the result of a movement and the duration he had. Its height records how many ticks the asset walked during a given movement, its width shows us the duration that movement had. Its configuration must be in line with the Weis Wave Indicator configuration to observe the movement force and can indicate a possible accumulation or distribution of the movement;
FREE
Weis Wave Scouter Basic
Jean Carlos Martins Roso
5 (1)
Weis Wave Scouter Basic은 MetaTrader 5용으로 설계된 당사의 유명한 인디케이터의 기본 버전으로, Wyckoff 방법론과 VSA(Volume Spread Analysis) 개념을 쉽고 효율적으로 탐색하려는 트레이더를 위해 설계되었습니다. 볼륨 파동 읽기를 기반으로 하여 시장 움직임을 명확하게 식별할 수 있으며, Richard Wyckoff가 가르친 노력 대 결과 및 수요 공급 원칙에 중점을 둡니다. Weis Wave Scouter Basic을 사용하면 기본 색상 테마(Classic)로 상승 및 하락 파동을 직관적인 히스토그램으로 시각화할 수 있어 트렌드 및 반전 해석이 쉬워집니다. Brick Size 및 Volume Scale Factor와 같은 기본 조정을 지원하며, 틱 볼륨 또는 실제 볼륨을 사용할 수 있는 옵션을 제공하여 Forex, 주식, 암호화폐 등 다양한 시장에 적합합니다. 초보자나 간단한 도구를 원하는 트레이더에게 완벽한 Weis Wave Sco
FREE
Risk Calculator EA – Utility for Precise Trade Sizing If you find this tool useful consider to  Buy me a coffee!   The Ultimate Risk Calculator is a lightweight in-chart Expert Advisor (EA) designed to help you easily and quickly calculate position size and set stop-loss / take-profit levels with full control over risk management directly on the chart. What it does? It turns manual risk decisions into fast, visual, and accurate calculations. You draw or adjust the Entry, Stop-Loss and Take-P
FREE
FVGs
Andrii Hurin
5 (10)
A simple indicator that automatically highlights all FVGs (Fair Value Gaps) formed on the chart, as well as FVGs on history. It is possible to select colors for FVGs of different directions (long or short), select the time interval, select the color of middle point and you can also choose whether to delete filled FVGs or leave them on the chart (the option is beneficial for backtesting). The indicator can be very useful for those, who trade according to the concept of smart money, ICT, or simply
FREE
Rainbow MT5
Jamal El Alama
4 (1)
Description : Rainbow MT5 is a technical indicator based on Moving Average with period 34 and very easy to use. When price crosses above MA and MA changes color to green, then this is a signal to buy. When price crosses below MA and MA changes color to red, then this is a signal to sell. The Expert advisor ( Rainbow EA MT5 ) based on Rainbow MT5 indicator is now available here . MT4 version is available here .
FREE
Easy VWAP
Luca Spinello
VWAP Indicator, the short form of Volume Weighted Average Price, is similar to a moving average but takes into consideration the tick volume of the candles. The indicator calculates the moving average multiplying the price of each candle for the tick volume in the candle. Said calculation weighs with more significance price where more transactions were made. Features: Visual styling customizable Period customizable Ease of use
FREE
Midas VWAP
Paulo Henrique Faquineli Garcia
4 (2)
Volume Weighted Average Price (VWAP) is a trading benchmark commonly used by Big Players that gives the average price a Symbol has traded throughout the day. It is based on both Volume and price. This indicator contains Daily VWAP and MIDAS' VWAP, which means you are able to anchor the beggining of MIDAS' calculations and, therefore you will be able to use this methodology to study price versus volume moves after anchor point. You will be able to anchor up to 3 HIGH MIDAS VWAP's and 3 LOW. Wish
FREE
Follow The Line MT5
Oliver Gideon Amofa Appiah
4.6 (35)
This indicator obeys the popular maxim that: "THE TREND IS YOUR FRIEND" It paints a GREEN line for BUY and also paints a RED line for SELL. (you can change the colors). It gives alarms and alerts of all kinds. IT DOES NOT REPAINT and can be used for all currency pairs and timeframes. Yes, as easy and simple as that. Even a newbie can use it to make great and reliable trades. NB: For best results, get my other premium indicators for more powerful and reliable signals. Get them here: https://www.m
FREE
Friend of the trend
Anderson De Assis
Friend of the Trend: Your Trend Tracker Master the market with Friend of the Trend , the indicator that simplifies trend analysis and helps you identify the best moments to buy, sell, or wait. With an intuitive and visually striking design, Friend of the Trend analyzes price movements and delivers signals through a colorful histogram: Green Bars : Signal an uptrend, indicating buying opportunities. Red Bars : Alert to a downtrend, suggesting potential selling points. Orange Bars : Represent cons
FREE
Haven FVG Indicator
Maksim Tarutin
5 (8)
인디케이터   Haven FVG   는 시장을 분석하는 도구로, 차트에서 비효율성 영역(Fair Value Gaps, FVG)을 식별하여 트레이더에게 가격 분석 및 거래 결정을 위한 주요 수준을 제공합니다. 다른 제품 ->  여기 주요 특징: 개별 색상 설정: 상승 FVG 색상   (Bullish FVG Color). 하락 FVG 색상   (Bearish FVG Color). 유연한 FVG 시각화: FVG를 검색할 최대 캔들 수. FVG 영역을 특정 바 수만큼 추가로 연장. FVG에 대한 채우기를 활성화할 수 있습니다. 중앙선(Middle Line): 색상 및 선 스타일 선택(예: 점선). 더 정확한 선 두께 조정. 일반 설정: FVG를 현재 바까지 확장. 채우기가 있는 역사적 FVG 제외하여 최신 데이터에 집중. 차트에서 비효율성 영역을 분석하고 근거 있는 거래 결정을 내리는 간단하고 효과적인 방법.
FREE
이 제품의 구매자들이 또한 구매함
SuperScalp Pro
Van Minh Nguyen
5 (14)
SuperScalp Pro – 고급 다중 필터 스캘핑 인디케이터 시스템 SuperScalp Pro는 클래식 Supertrend와 여러 지능형 확인 필터를 결합한 고급 스캘핑 인디케이터 시스템입니다. 해당 인디케이터는 M1부터 H4까지 모든 타임프레임에서 효율적으로 작동하며, 특히 XAUUSD, BTCUSD 및 주요 외환 통화쌍에 적합합니다. 독립형 시스템으로 사용하거나 기존 거래 전략에 유연하게 통합할 수 있습니다. 이 인디케이터는 11개 이상의 필터를 통합하며, 빠른/느린 EMA, 추세 판별용 3개의 EMA, EMA 기울기(EMA slope), RSI, ADX, 거래량(Volume), VWAP, 볼린저 밴드 돌파(Bollinger Bands Breakout) 및 MACD 다이버전스 필터 등을 포함합니다. 스마트 캔들 필터는 캔들 종가를 확인하여 약한 신호를 제거하고, 3 EMA와 MACD 다이버전스 필터를 결합한 추세 인식 메커니즘은 더 높은 승률의 신호를 선별하는 데 도움을 줍니
Azimuth Pro
Ottaviano De Cicco
5 (6)
LAUNCH PROMO Azimuth Pro price is initially set at 299$ for the first 100 buyers. Final price will be 499$ . THE DIFFERENCE BETWEEN RETAIL AND INSTITUTIONAL ENTRIES ISN'T THE INDICATOR — IT'S THE LOCATION. Most traders enter at arbitrary price levels, chasing momentum or reacting to lagging signals. Institutions wait for price to reach structured levels where supply and demand actually shift. Azimuth Pro maps these levels automatically: swing-anchored VWAP, multi-timeframe structure lines, an
Divergence Bomber
Ihor Otkydach
4.89 (85)
이 지표를 구매하신 분께는 다음과 같은 혜택이 무료로 제공됩니다: 각 거래를 자동으로 관리하고, 손절/익절 수준을 설정하며, 전략 규칙에 따라 거래를 종료하는 전용 도우미 툴 "Bomber Utility" 다양한 자산에 맞게 지표를 설정할 수 있는 셋업 파일(Set Files) "최소 위험", "균형 잡힌 위험", "관망 전략" 모드로 설정 가능한 Bomber Utility의 셋업 파일 이 전략을 빠르게 설치, 설정, 시작할 수 있도록 돕는 단계별 영상 매뉴얼 주의: 위의 모든 보너스를 받기 위해서는 MQL5 개인 메시지 시스템을 통해 판매자에게 연락해 주세요. 독창적인 커스텀 지표인 “Divergence Bomber(다이버전스 봄버)”를 소개합니다. 이 지표는 MACD 다이버전스(괴리) 전략을 기반으로 한 올인원(All-in-One) 거래 시스템입니다. 이 기술 지표의 주요 목적은 가격과 MACD 지표 간의 다이버전스를 감지하고, **향후 가격이 어느 방향으로 움직일지를 알려주는
ARICoins
Temirlan Kdyrkhan
ARICoin is a powerful trading companion designed to generate high-probability entry signals with dynamic TP/SL/DP levels based on volatility. Built-in performance tracking shows win/loss stats, PP1/PP2 hits, and success rates all updated live. Key Features: Buy/Sell signals with adaptive volatility bands Real-time TP/SL/DP levels based on ATR Built-in MA Filter with optional ATR/StdDev volatility Performance stats panel (Success, Profit/Loss, PP1/PP2) Alerts via popup, sound, push, or email Cust
Entry In The Zone and SMC Multi Timeframe is a real-time market analysis tool developed based on Smart Money Concepts (SMC). It is designed to analyze market structure, price direction, reversal points, and key zones across multiple timeframes in a systematic way. The system displays Points of Interest (POI) and real-time No Repaint signals, with instant alerts when price reaches key zones or when signals occur within those zones. It functions as both an Indicator and a Signal System (2-in-1), c
CGE Trading Suite
Carl Gustav Johan Ekstrom
5 (1)
CGE Trading Suite delivers the analytical edge typically reserved for professional trading desks. The platform integrates a full suite of analytical tools into one seamless workflow: dynamic grid mapping, liquidity behavior analysis, ECM, trend lines, MIDAS, trade cycles, and directional channel projections. Together, these provide a unified view of market structure and momentum. Directional clarity is further enhanced by the capital flow index, which measures currency basket strength to identif
이 지표를 구매하면 제 프로페셔널 트레이드 매니저를 무료로 드립니다. 우선 이 거래 시스템이 리페인팅, 리드로잉 및 레이그 인디케이터가 아니라는 점을 강조하는 것이 중요합니다. 이는 수동 및 로봇 거래 모두에 이상적인 것으로 만듭니다. 온라인 강좌, 설명서 및 프리셋 다운로드. "스마트 트렌드 트레이딩 시스템 MT5"은 새로운 및 경험이 풍부한 트레이더를 위해 맞춤형으로 제작된 종합적인 거래 솔루션입니다. 10개 이상의 프리미엄 인디케이터를 결합하고 7개 이상의 견고한 거래 전략을 특징으로 하여 다양한 시장 조건에 대한 다목적 선택이 가능합니다. 트렌드 추종 전략: 효과적인 트렌드 추이를 타기 위한 정확한 진입 및 손절 관리를 제공합니다. 반전 전략: 잠재적인 트렌드 반전을 식별하여 트레이더가 범위 시장을 활용할 수 있게 합니다. 스캘핑 전략: 빠르고 정확한 데이 트레이딩 및 단기 거래를 위해 설계되었습니다. 안정성: 모든 인디케이터가 리페인팅, 리드로잉 및 레이그가 아니므로 신뢰
Gold Entry Sniper
Tahir Mehmood
5 (6)
Gold Entry Sniper – 골드 스캘핑 & 스윙 트레이딩을 위한 전문 다중 시간 프레임 ATR 대시보드 Gold Entry Sniper 는 XAUUSD 및 기타 종목에 대해 정확한 매수/매도 신호 를 제공하는 고급 MetaTrader 5 지표입니다. ATR 트레일링 스톱 로직 과 다중 시간 프레임 분석 을 기반으로 설계되어 스캘핑과 스윙 트레이딩 모두에 적합합니다. 주요 기능 및 장점 다중 시간 프레임 분석 – M1, M5, M15 추세를 한눈에 확인. ATR 기반 트레일링 스톱 – 변동성에 따라 자동 조정. 전문 차트 대시보드 – 신호 상태, ATR 레벨, 회귀선, 매매 방향 표시. 명확한 매수/매도 마커 – 자동 화살표와 텍스트 라벨. 종료 알림 & 거래 관리 – 수익 보호를 위한 자동 종료 감지. 완전 사용자 설정 가능 – 대시보드 위치, 색상, ATR/회귀선 파라미터 조정. 골드(XAUUSD) 최적화 – M1~M15 스캘핑에 완벽, 외환/지수/암호화폐에도 적용 가능.
Meridian Pro
Ottaviano De Cicco
5 (1)
Meridian Pro: Professional Multi-Timeframe Trend Matrix for MT5 Overview Meridian Pro is a multi-timeframe trend matrix by Merkava Labs that compresses directional state, strength, momentum condition and matrix agreement into one compact panel. One adaptive engine, applied consistently from M1 to W1. No per-symbol tuning. No indicator stacking. One structured readout across every asset and every timeframe. Launch Offer — Get Meridian Pro for USD 99 (introductory). Regular price: USD 149. 1. Why
RelicusRoad Pro MT5
Relicus LLC
5 (24)
RelicusRoad Pro: 퀀트 시장 운영 체제 70% 할인 평생 이용권 (한정 시간) - 2,000명 이상의 트레이더와 함께하세요 왜 대부분의 트레이더는 "완벽한" 지표를 가지고도 실패할까요? 진공 상태에서 단일 개념 만으로 거래하기 때문입니다. 문맥 없는 신호는 도박입니다. 지속적인 승리를 위해서는 컨플루언스(중첩) 가 필요합니다. RelicusRoad Pro는 단순한 화살표 지표가 아닙니다. 완전한 퀀트 시장 생태계 입니다. 독점적인 변동성 모델링을 사용하여 가격이 이동하는 "공정 가치 로드"를 매핑하고, 단순 노이즈와 실제 구조적 돌파를 구분합니다. 추측은 그만두세요. 기관급 로드 로직으로 거래를 시작하세요. 핵심 엔진: "Road" 알고리즘 시스템의 중심에는 시장 상황에 실시간으로 적응하는 동적 변동성 채널인 Road Algo 가 있습니다. 세이프 라인(평형) 과 가격이 수학적으로 반전될 가능성이 높은 확장 레벨 을 투영합니다. Simple Road: 일반적인 시장을 위
FX Trend MT5 NG
Daniel Stein
5 (4)
FX Trend NG: 차세대 멀티 마켓 트렌드 인텔리전스 개요 FX Trend NG 는 다중 시간 프레임 기반의 전문 트렌드 분석 및 시장 모니터링 도구입니다. 몇 초 만에 전체 시장 구조를 파악할 수 있도록 설계되었습니다. 여러 차트를 일일이 전환할 필요 없이, 어떤 종목이 추세에 있는지, 어디에서 모멘텀이 약화되고 있는지, 그리고 어떤 시간 프레임이 서로 정렬되어 있는지 즉시 확인할 수 있습니다. 출시 기념 특별 혜택 – FX Trend NG 를 $30 (6개월) 또는 $80 평생 라이선스 로 이용할 수 있습니다. 이미 Stein Investments 고객이신가요? -> 메시지를 보내 전용 고객 그룹에 참여하세요. 설정이나 사용 방법이 필요하신가요? -> Stein Investments 공식 페이지 를 방문하세요. 1. FX Trend NG가 특별한 이유 3단계 추세 로직 – 단순한 Buy / Sell이 아닙니다 • 대부분의 지표는 Buy 또는 Sell 두 가지 상태만 제
Power Candles MT5
Daniel Stein
5 (6)
Power Candles – 모든 시장을 위한 강도 기반 진입 신호 Power Candles 는 Stein Investments의 검증된 강도 분석을 가격 차트에 직접 제공합니다. 가격 움직임에만 반응하는 대신, 각 캔들은 실제 시장 강도를 기준으로 색상화되어 모멘텀 형성, 강도 가속, 명확한 추세 전환을 즉시 파악할 수 있습니다. 모든 시장을 위한 단일 로직 Power Candles는 모든 거래 심볼 에서 자동으로 작동합니다. 현재 심볼이 Forex인지 비-Forex 시장인지 자동으로 감지하여 내부적으로 적절한 강도 모델을 적용합니다. Forex 및 Gold 는 FX Power Delta 값을 사용합니다 (절대값 범위 최대 100) 지수, 크립토 및 CFD 는 IX Power Strength 값을 사용합니다 (절대값 범위 최대 50) 필요한 강도 계산은 Power Candles에 완전히 내장되어 있습니다. 캔들 색상이나 신호 로직을 위해 추가 인디케이터는 필요하지 않습니다. 가격
AriX
Temirlan Kdyrkhan
1 (4)
AriX Indicator for MT5 A powerful trend-following and signal-evaluation tool AriX is a custom MT5 indicator that combines Moving Averages and ATR-based risk/reward logic to generate clear buy/sell signals. It visualizes dynamic SL/TP levels, evaluates past trade outcomes, and displays win/loss statistics in a clean on-chart panel. Key features include: Buy/Sell signals based on MA crossovers ATR-based SL/TP1/TP2/TP3 levels with visual lines and labels Signal outcome tracking with real-time stat
Quantum TrendPulse
Bogdan Ion Puscasu
5 (22)
SuperTrend   ,   RSI   ,   Stochastic   의 힘을 하나의 포괄적인 지표로 결합하여 트레이딩 잠재력을 극대화하는 궁극의 트레이딩 도구   인 Quantum TrendPulse를   소개합니다. 정밀성과 효율성을 추구하는 트레이더를 위해 설계된 이 지표는 시장 추세, 모멘텀 변화, 최적의 진입 및 종료 지점을 자신 있게 식별하는 데 도움이 됩니다. 주요 특징: SuperTrend 통합:   주요 시장 추세를 쉽게 따라가고 수익성의 물결을 타세요. RSI 정밀도:   매수 과다 및 매도 과다 수준을 감지하여 시장 반전 시점을 파악하는 데 적합하며 SuperTrend 필터로 사용 가능 확률적 정확도:   변동성이 큰 시장에서 숨겨진 기회를 찾기 위해 확률적 진동   을 활용하고 SuperTrend의 필터로 사용 다중 시간대 분석:   M5부터 H1 또는 H4까지 다양한 시간대에 걸쳐 시장을 최신 상태로 유지하세요. 맞춤형 알림:   맞춤형 거래 조건이 충족되면
Trend Screener Pro MT5
STE S.S.COMPANY
4.84 (103)
트렌드 표시기, 트렌드 트레이딩 및 필터링을 위한 획기적인 고유 솔루션, 하나의 도구 안에 내장된 모든 중요한 트렌드 기능! Forex, 상품, 암호 화폐, 지수 및 주식과 같은 모든 기호/도구에 사용할 수 있는 100% 다시 칠하지 않는 다중 시간 프레임 및 다중 통화 표시기입니다. Trend Screener는 차트에 점이 있는 화살표 추세 신호를 제공하는 효율적인 지표 추세 추종 지표입니다. 추세 분석기 표시기에서 사용할 수 있는 기능: 1. 트렌드 스캐너. 2. 최대 이익 분석이 있는 추세선. 3. 추세 통화 강도 측정기. 4. 경고가 있는 추세 반전 점. 5. 경고가 있는 강력한 추세 점. 6. 추세 화살표 Trend Screener Indicator가 있는 일일 분석 예, 일일 신호 성능...등은 여기에서 찾을 수 있습니다. 여기를 클릭하십시오. LIMITED TIME OFFER : Trend Screener Indicator는 50$ 및 평생 동안만 사용할 수 있습니다.
HFT Spike Detector
OMG FZE LLC
5 (2)
[ My Products ] , [ My Channel ]   ,  [ LIVE SIGNAL ] HFT Spike Detector HFT Spike Detector는 HFT로 인해 발생하는 급격한 가격 변동을 실시간으로 분석하고 측정하기 위해 개발된 전문적인 틱 모니터링 도구입니다. 목적은 브로커로 인해 발생하는 비정상적인 슬리피지, 유동성 공백 및 밀리초 단위 가격 스파이크를 수치 데이터로 감지할 수 있도록 하는 것입니다. 실시간 틱 흐름과 체결 조건을 분석하기 때문에 백테스트로는 정확하게 평가할 수 없습니다. 이 EA는 자동화를 위해 준비된 세트 파일과 함께 사용할 수 있도록 구매할 수 있습니다:  VolumeHedger EA 작동 원리 이 Expert Advisor는 들어오는 모든 틱을 실시간으로 분석하고: 가격 변화 속도 초당 틱 밀도 슬리피지 크기 같은 방향의 마이크로 흐름 측정하여 차트의 패널에 표시합니다. 이를 통해 스프레드를 제외한 실제 실행 품질을 확인할 수
Atomic Analyst MT5
Issam Kassas
3.94 (31)
우선적으로 언급할 점은이 거래 지표가 다시 그리지 않고 지연되지 않으며 이를 통해 수동 및 로봇 거래 모두에 이상적이라는 점입니다. 사용자 매뉴얼: 설정, 입력 및 전략. Atomic Analyst는 가격의 강도와 모멘텀을 활용하여 시장에서 더 나은 이점을 찾는 PA Price Action Indicator입니다. 고급 필터를 장착하여 잡음과 거짓 신호를 제거하고 거래 잠재력을 높이는 데 도움이 됩니다. 복잡한 지표의 다중 레이어를 사용하여 Atomic Analyst는 차트를 스캔하고 복잡한 수학적 계산을 간단한 신호와 색상으로 변환하여 초보 트레이더가 이해하고 일관된 거래 결정을 내릴 수 있도록합니다. "Atomic Analyst"는 새로운 및 경험이 풍부한 트레이더를위한 종합적인 거래 솔루션입니다. 프리미엄 지표와 최고 수준의 기능을 하나의 거래 전략에 결합하여 모든 종류의 트레이더에 대한 다재다능한 선택지가되었습니다. 인트라데이 거래 및 스캘핑 전략 : 빠르고 정확한 일일
Meravith MT5
Ivan Stefanov
마켓 메이커를 위한 도구. Meravith는 다음과 같은 기능을 제공합니다: 모든 타임프레임을 분석하고 현재 유효한 추세를 표시합니다. 강세와 약세 거래량이 동일한 유동성 구간(거래량 균형 구간)을 강조 표시합니다. 서로 다른 타임프레임의 모든 유동성 레벨을 차트에 직접 표시합니다. 텍스트 기반 시장 분석을 생성하여 참고용으로 제공합니다. 현재 추세를 기반으로 목표가, 지지선 및 손절가를 계산합니다. 거래의 위험 대비 보상 비율(Risk/Reward)을 계산합니다. 계좌 잔고에 따라 포지션 크기를 산출하고 잠재 수익을 추정합니다. 시장에 중대한 변화가 발생할 경우 경고도 제공합니다. 지표의 주요 라인: 강세/약세 거래량 소진 라인 — 목표가로 사용됩니다. 시장 추세를 나타내는 라인. 시장이 강세인지 약세인지에 따라 색상이 변경되며 추세 지지선 역할을 합니다. 색상은 주로 시장 심리를 보여줍니다. 거래량 균형선(Eq). Eq(Volume Equilibrium) 라인은 시스템의 핵심입니
OmniSync Projection
Antonio-alin Teculescu
5 (1)
Chronos Fractal Engine is an innovative price projection indicator for MetaTrader 5, designed to transform your technical analysis by intelligently identifying and projecting historical price patterns. Built upon an advanced correlation algorithm and the fractal principles of the market, this powerful tool visualizes potential future price movements, giving you a unique edge in your trading decisions. What is Chronos Fractal Engine? At its core, the Chronos Fractal Engine employs a sophisticat
Bill Williams Advanced
Siarhei Vashchylka
5 (11)
Bill Williams Advanced is designed for automatic chart analysis using Bill Williams' "Profitunity" system. The indicator analyzes four timeframes at once. Manual (Be sure to read before purchasing) Advantages 1. Analyzes the chart using Bill Williams' "Profitunity" system. Signals are displayed in a table in the corner of the screen and on the price chart. 2. Finds all known AO and AC signals, as well as zone signals. Equipped with a trend filter based on the Alligator. 3. Finds "Divergence Bar
Currency Strength Dashboard Pro
Anastasia Danilova
5 (1)
Currency Strength Dashboard Pro MetaTrader 5 를 위한 실시간 통화 강도 분석 전문 대시보드 입니다. 이 지표는 8개의 주요 통화 (EUR, USD, GBP, JPY, CHF, AUD, CAD, NZD)의 강도를 계산하고, 28개의 통화쌍 을 동시에 여러 시간 프레임에서 분석하여 표시합니다. 이 대시보드는 트레이더가 추가 계산이나 여러 차트 간 전환 없이 한눈에 시장 전체 상황을 파악 할 수 있도록 해줍니다. 계산 방법 이 지표는 고급 수학적 통화 강도 분석 방법 을 기반으로 합니다. 이는 유사한 지표에서 널리 사용되는 RSI 기반 방법 보다 더 정확하고 객관적인 결과를 제공합니다. 이 방법은 28개의 모든 통화쌍 간의 관계를 동시에 분석 하여 시장에서 실제로 형성되는 힘의 균형을 보다 명확하고 편향 없이 보여줍니다. 실시간 대시보드 메인 테이블에는 8개의 통화 에 대한 전체 데이터가 표시됩니다. Rank (순위) — 전체 강도 기준 통화 순위, 1
Grabber System MT5
Ihor Otkydach
4.83 (23)
탁월한 기술적 지표인 Grabber를 소개합니다. 이 도구는 즉시 사용 가능한 “올인원(All-Inclusive)” 트레이딩 전략으로 작동합니다. 하나의 코드 안에 강력한 시장 기술 분석 도구, 매매 신호(화살표), 알림 기능, 푸시 알림이 통합되어 있습니다. 이 인디케이터를 구매하신 모든 분들께는 다음의 항목이 무료로 제공됩니다: Grabber 유틸리티: 오픈 포지션을 자동으로 관리하는 도구 단계별 영상 매뉴얼: 설치, 설정, 그리고 실제 거래 방법을 안내 맞춤형 세트 파일: 인디케이터를 빠르게 자동 설정하여 최고의 성과를 낼 수 있도록 도와줍니다 다른 전략은 이제 잊어버리세요! Grabber만이 여러분을 새로운 트레이딩의 정점으로 이끌어 줄 수 있습니다. Grabber 전략의 주요 특징: 거래 시간 프레임: M5부터 H4까지 거래 가능한 자산: 어떤 자산이든 사용 가능하지만, 제가 직접 테스트한 종목들을 추천드립니다 (GBPUSD, GBPCAD, GBPCHF, AUDCAD, AU
소개       Quantum Breakout PRO   , 브레이크아웃 존 거래 방식을 변화시키는 획기적인 MQL5 지표! 13년 이상의 거래 경험을 가진 숙련된 트레이더 팀이 개발한       퀀텀 브레이크아웃 PRO       혁신적이고 역동적인 브레이크아웃 존 전략으로 거래 여정을 새로운 차원으로 끌어올리도록 설계되었습니다. Quantum Breakout Indicator는 5개의 이익 목표 영역이 있는 브레이크아웃 영역의 신호 화살표와 브레이크아웃 상자를 기반으로 한 손절 제안을 제공합니다. 초보자 거래자와 전문 거래자 모두에게 적합합니다. Quantum EA 채널:       여기를 클릭하세요 중요한! 구매 후 설치 매뉴얼을 받으려면 개인 메시지를 보내주십시오. 추천: 기간: M15 통화쌍: GBPJPY, EURJPY, USDJPY,NZDUSD, XAUUSD 계정 유형: 스프레드가 매우 낮은 ECN, Raw 또는 Razor 브로커 시간: GMT +3 중개인 :
FX Power MT5 NG
Daniel Stein
5 (31)
FX Power: 통화 강세 분석으로 더 스마트한 거래 결정을 개요 FX Power 는 어떤 시장 상황에서도 주요 통화와 금의 실제 강세를 이해하기 위한 필수 도구입니다. 강한 통화를 매수하고 약한 통화를 매도함으로써 FX Power 는 거래 결정을 단순화하고 높은 확률의 기회를 발견합니다. 트렌드를 따르거나 극단적인 델타 값을 사용해 반전을 예측하고자 한다면, 이 도구는 귀하의 거래 스타일에 완벽히 적응합니다. 단순히 거래하지 말고, FX Power 로 더 스마트하게 거래하세요. 1. FX Power가 거래자에게 매우 유용한 이유 통화와 금의 실시간 강세 분석 • FX Power 는 주요 통화와 금의 상대적 강세를 계산하고 표시하여 시장 역학에 대한 명확한 통찰력을 제공합니다. • 어떤 자산이 앞서고 있고 어떤 자산이 뒤처지는지 모니터링하여 보다 현명한 거래 결정을 내릴 수 있습니다. 포괄적인 멀티 타임프레임 뷰 • 단기, 중기 및 장기 타임프레임에서 통화와 금의 강세를
Advanced Supply Demand MT5
Bernhard Schweigert
4.53 (15)
현재 33% 할인! 초보자나 전문 트레이더를 위한 최고의 솔루션! 이 보조지표는 우리가 다수의 독창적 기능과 새로운 공식을 통합한 독특하고 고품질이며 저렴한 거래 도구입니다. 이 업데이트를 통해 이중 시간대를 표시할 수 있습니다. 더 높은 TF를 표시할 수 있을 뿐만 아니라 차트 TF와 더 높은 TF 모두를 표시할 수 있습니다: 중첩 영역 표시. 모든 Supply Demand 트레이더들이 좋아할 것입니다. :) 중요한 정보 공개 Advanced Supply Demand의 잠재력을 극대화하려면 다음을 방문하십시오. https://www.mql5.com/ko/blogs/post/720245   진입 또는 목표의 명확한 트리거 포인트를 정확히 찾아냄으로 해서 거래가 어떻게 개선될지 상상해 보십시오. 새로운 알고리즘을 기반으로 매수자와 매도자 간의 잠재적인 불균형을 훨씬 더 쉽게 분간할 수 있습니다. 왜냐하면 가장 강한 공급영역과 가장 강한 수요 영역과 과거에 어떻게 진행 되었는지를(이전
RFI levels PRO MT5
Roman Podpora
3.67 (3)
이 지표는 추세 반전 지점과 가격 반등 영역을 정확하게 보여줍니다.       주요 투자자들   . 새로운 트렌드가 형성되는 곳을 파악하고 최대한 정확하게 의사결정을 내리며 모든 거래를 완벽하게 통제합니다. TREND LINES PRO   지표와 함께 사용할 때 최대의 잠재력을 발휘합니다.  VERSION MT4 지표가 보여주는 내용: 새로운 추세의 시작 시 활성화되는 반전 구조 및 반전 수준. 최소한의 위험 대비 수익률을 갖는 이익 실현   (TAKE PROFIT)   및   손절매(STOP LOSS)   레벨 표시       RR 1:2   . 지능형 손실 감소 로직이 적용된 손절매 기능. 지정된 지표에서 두 가지 추세 유형에 대한 반전 패턴을 표시합니다. 지표: 트렌드를 따라   트렌드 라인 프로   (글로벌 트렌드 변화) 트렌드 프로   (빠른 트렌드 변화) 간단하고 효과적입니다       스캐너       실시간 추세 (신규). 다중 시간 프레임 도구 필터링. 표시하다  
Market Structure Order Block Dashboard MT5 는 MetaTrader 5용 MT5 인디케이터 로, 시장 구조 및 ICT / Smart Money Concepts에 기반합니다: HH/HL/LH/LL , BOS , ChoCH 뿐 아니라 Order Blocks , Fair Value Gaps (FVG) , 유동성 (EQH/EQL, sweeps), 세션 / Kill Zones , 그리고 Volume Profile 을 통합하여 콤팩트한 컨플루언스 대시보드를 제공합니다. 중요: 본 제품은 분석 도구 입니다. 자동 매매를 실행하지 않습니다( EA가 아님 ). 구매자 보너스 구매 후 제 스토어에서 보너스 인디케이터 2개 를 (선택하여) 무료로 받을 수 있습니다. 보너스 수령 방법: 1) 본 제품에 대한 솔직한 리뷰를 남겨주세요. 2) MQL5 메시지로 BONUS MSOB + 선택한 인디케이터 2개 이름 을 보내주세요. 주요 기능 시장 구조: HH/HL/LH/LL
Trend Forecaster
Alexey Minkov
5 (7)
The Trend Forecaster indicator utilizes a unique proprietary algorithm to determine entry points for a breakout trading strategy. The indicator identifies price clusters, analyzes price movement near levels, and provides a signal when the price breaks through a level. The Trend Forecaster indicator is suitable for all financial assets, including currencies (Forex), metals, stocks, indices, and cryptocurrencies. You can also adjust the indicator to work on any time frames, although it is recommen
Crystal Heikin Ashi Signals
Muhammad Jawad Shabir
5 (1)
Crystal Heikin Ashi Signals - Professional Trend & Signal Detection Indicator Advanced Heikin Ashi Visualization with Intelligent Signal System for Manual & Automated Trading Final Price: $149 ---------> Price goes up $10 after every 10 sales . Limited slots available — act fast . Overview Crystal Heikin Ashi Signals is a professional-grade MetaTrader 5 indicator that combines pure Heikin Ashi candle visualization with an advanced momentum-shift detection system. Designed for both manual traders
Power Bar MT5
Daniel Stein
실제 자금을 투입하기 전에 어떤 전략이 내 심볼에서 효과적인지 확인하세요. Power Bar는 모든 심볼과 모든 타임프레임에서 극단적인 가격 바 를 감지한 다음, 3가지 다른 트레이딩 전략을 즉시 백테스트하여 승률, 수익 팩터, 손익을 나란히 비교할 수 있습니다. 모든 것이 하나의 인터랙티브 패널에 담겨 있습니다. 추측 없음. 커브 피팅 없음. 오직 데이터뿐입니다. Power Bar가 특별한 이유 대부분의 인디케이터는 신호를 주고 그것이 효과가 있는지는 추측에 맡깁니다. Power Bar는 한 걸음 더 나아갑니다 - 모든 신호를 세 가지 전략 에 대해 테스트하고 통계를 보여줍니다. FlipFlop, Momentum, Reversal을 원클릭으로 전환하고 숫자가 즉시 변하는 것을 확인하세요. FlipFlop - 항상 포지션 유지. 신호에 진입하고, 반대 신호에 청산. 당사의 연구에 따르면 US30, US500, DAX와 같은 추세가 있는 지수에서 가장 효과적입니다. Momentum
제작자의 제품 더 보기
Candle Timer Countdown
JETINVEST
4.7 (105)
캔들 타이머 카운트다운은 현재 막대가 닫히고 새 막대가 형성되기까지 남은 시간을 표시합니다. 시간 관리에 사용할 수 있습니다. MT4 버전은 여기 ! 기능 하이라이트 현지 시간이 아닌 서버 시간을 추적합니다. 구성 가능한 텍스트 색상 및 글꼴 크기 기호 일일 변동의 선택적 시각화 CPU 사용량을 줄이기 위해 최적화 입력 매개변수 일별 편차 표시: 참/거짓 텍스트 글꼴 크기 텍스트 색상 여전히 질문이 있는 경우 다이렉트 메시지로 저에게 연락하십시오.   https://www.mql5.com/ko/users/robsjunqueira/ 이것이 우리가 지속적으로 발전 할 수있는 유일한 방법이기 때문에 개선을위한 제안에 부담없이 문의하십시오. 또한 당사의 다른 지표 및 전문 고문에 대해 알아보십시오. 다양한 유형의 자산을 거래할 수 있는 다양한 상품이 있음을 알 수 있습니다.
FREE
MACD Intraday Trend PRO는 1960년대 Gerald Appel이 만든 원본 MACD를 개조하여 개발한 지표입니다. 수년간의 거래를 통해 MACD의 매개변수를 피보나치 비율로 변경함으로써 추세 움직임의 연속성을 더 잘 표현함으로써 가격 추세의 시작과 끝을 보다 효율적으로 감지할 수 있다는 것이 관찰되었습니다. 가격 추세를 감지하는 효율성으로 인해 상단과 하단의 차이를 매우 명확하게 식별하여 거래 기회를 더 잘 활용할 수도 있습니다. 특징 표시기 MACD Intraday Trend PRO는 모든 통화 쌍, 모든 시간대 및 Renko 차트에서 작동합니다. 5가지 모드를 선택하여 추세 감지 속도를 설정할 수 있습니다. 가장 빠른 빠른 정상 느린 가장 느림 자원 6개의 구성 가능한 경고가 있습니다. MACD는 신호 라인에서 후퇴 MACD가 신호선을 넘다 MACD는 레벨 0을 교차 신호선이 레벨 0을 넘습니다. MACD 변경 트렌드 색상 신호선 변경 TREND 색상
MACD Intraday Trend
JETINVEST
4.8 (55)
MACD 장중 추세는 1960년대 Gerald Appel이 만든 원본 MACD를 개조하여 개발한 지표입니다. 수년간의 거래를 통해 MACD의 매개변수를 피보나치 비율로 변경함으로써 추세 움직임의 연속성을 더 잘 표현함으로써 가격 추세의 시작과 끝을 보다 효율적으로 감지할 수 있다는 것이 관찰되었습니다. 가격 추세를 감지하는 효율성으로 인해 상단과 하단의 차이를 매우 명확하게 식별하여 거래 기회를 더 잘 활용할 수도 있습니다. 구성 가능한 기능과 경고가 있는 전문가용 버전을 사용해 보십시오: MACD Intraday Trend PRO 특징 모든 통화 쌍에서 작동 모든 시간대에 작동 Renko 차트와 함께 작동 여전히 질문이 있는 경우 다이렉트 메시지로 저에게 연락하십시오.   https://www.mql5.com/ko/users/robsjunqueira/
FREE
캔들 타이머 카운트다운은 현재 막대가 닫히고 새 막대가 형성되기까지 남은 시간을 표시합니다. 시간 관리에 사용할 수 있습니다. MT5 버전은 여기 ! 기능 하이라이트 현지 시간이 아닌 서버 시간을 추적합니다. 구성 가능한 텍스트 색상 및 글꼴 크기 기호 일일 변동의 선택적 시각화 CPU 사용량을 줄이기 위해 최적화 입력 매개변수 일별 편차 표시: 참/거짓 텍스트 글꼴 크기 텍스트 색상 여전히 질문이 있는 경우 다이렉트 메시지로 저에게 연락하십시오.   https://www.mql5.com/ko/users/robsjunqueira/ 이것이 우리가 지속적으로 발전 할 수있는 유일한 방법이기 때문에 개선을위한 제안에 부담없이 문의하십시오. 또한 당사의 다른 지표 및 전문 고문에 대해 알아보십시오. 다양한 유형의 자산을 거래할 수 있는 다양한 상품이 있음을 알 수 있습니다.
FREE
Tabajara VWAP Ogro RSJ
JETINVEST
4.78 (40)
Setup Tabajara는 "월스트리트의 OGRO"로 알려진 브라질 상인이 만들었습니다. 이 설정의 아이디어는 거래자에게 현재 가격 추세와 그래프에서 찾아야 하는 작업 유형을 나타내는 것입니다. 작업 이것은 오전 10시 40분까지 양초와 VWAP를 닫는 위치를 지정하고 그 이후에 4가지 색상으로 양초를 칠하는 20주기의 산술 평균으로 수행합니다. 녹색 -> 가격 상승 추세 (구매 진입점 검색) 검은색 -> 강세 추세에서 가격 수정(구매 진입점 검색) 빨간색 -> 하락 추세에 있는 가격 (매도 진입점 검색) 흰색 -> 하락세 시 가격 조정 (판매 진입점 검색) 또한 스크립트에 다음 표시기를 넣었습니다. 8 기간의 지수 평균: 단기 가격 움직임 식별 50개 기간의 산술 평균: 중기 가격 움직임 식별 80 기간의 지수 평균: 중기 가격 움직임 식별 200개 기간의 산술 평균: 장기 가격 움직임 식별 여전히 질문이 있는 경우 다이렉트 메시지로 저에게 연락하십시오: https://w
FREE
Pivot Point Fibo RSJ
JETINVEST
4.38 (21)
피봇 포인트 Fibo RSJ는 피보나치 비율을 사용하여 당일의 지지선과 저항선을 추적하는 지표입니다. 이 멋진 지표는 피보나치 비율을 사용하여 피벗 포인트를 통해 최대 7단계의 지지와 저항을 생성합니다. 가격이 작업의 가능한 진입/종료 지점을 인식할 수 있는 이 지원 및 저항의 각 수준을 어떻게 존중하는지 환상적입니다. 특징 최대 7단계 지원 및 7단계 저항 레벨의 색상을 개별적으로 설정 입력 피벗 유형 피벗 피보 RSJ1 = 피보 비율 1 계산 피벗 피보 RSJ2 = 피보 비율 2 계산 피벗 Fibo RSJ3 = Fibo 비율 3 계산 피벗 피보 클래식 = 클래식 피벗 계산 최소 피벗 수준 피벗 3 레벨 피벗 4 레벨 피벗 5 레벨 6단계 피벗 피벗 7 레벨 여전히 질문이 있는 경우 다이렉트 메시지로 저에게 연락하십시오: https://www.mql5.com/ko/users/robsjunqueira/
FREE
캔들 카운터는 그 날의 첫 캔들부터 캔들 개수를 출력하는 인디케이터입니다. 오늘의 첫 번째 양초는 숫자 1이 되며 새 양초는 이 개수에서 1씩 증가합니다. 입력 매개변수 짝수, 홀수 또는 모두에서 선택 촛불에서 숫자 인쇄까지의 거리 텍스트 글꼴 크기 텍스트 글꼴 색상 여전히 질문이 있는 경우 다이렉트 메시지로 저에게 연락하십시오.   https://www.mql5.com/ko/users/robsjunqueira/ ----------------- 이것이 우리가 지속적으로 발전 할 수있는 유일한 방법이기 때문에 개선을위한 제안에 부담없이 문의하십시오. 또한 당사의 다른 지표 및 전문 고문에 대해 알아보십시오. 다양한 유형의 자산을 거래할 수 있는 다양한 상품이 있음을 알 수 있습니다.
FREE
피봇 포인트 Fibo RSJ는 피보나치 비율을 사용하여 당일의 지지선과 저항선을 추적하는 지표입니다. 이 멋진 지표는 피보나치 비율을 사용하여 피벗 포인트를 통해 최대 7단계의 지지와 저항을 생성합니다. 가격이 작업의 가능한 진입/종료 지점을 인식할 수 있는 이 지원 및 저항의 각 수준을 어떻게 존중하는지 환상적입니다. 특징 최대 7단계 지원 및 7단계 저항 레벨의 색상을 개별적으로 설정 입력 피벗 유형 피벗 피보 RSJ1 = 피보 비율 1 계산 피벗 피보 RSJ2 = 피보 비율 2 계산 피벗 Fibo RSJ3 = Fibo 비율 3 계산 피벗 피보 클래식 = 클래식 피벗 계산 최소 피벗 수준 피벗 3 레벨 피벗 4 레벨 피벗 5 레벨 6단계 피벗 피벗 7 레벨 여전히 질문이 있는 경우 다이렉트 메시지로 저에게 연락하십시오: https://www.mql5.com/ko/users/robsjunqueira/
FREE
VWAP Fibo Bands RSJ
JETINVEST
4.83 (12)
VWAP Fibo Bands RSJ is an indicator that traces the lines of the daily VWAP and from it creates bands using Fibonacci proportions. This spectacular indicator creates 10 band levels through the selected VWAP period using Fibonacci ratios. It is fantastic how the prices respect each level of the bands, where it is possible to realize that almost every time the price closes above / below a level of the bands he will seek the next one. If close above will seek to reach the level above and if close
FREE
MACD 장중 추세는 1960년대 Gerald Appel이 만든 원본 MACD를 개조하여 개발한 지표입니다. 수년간의 거래를 통해 MACD의 매개변수를 피보나치 비율로 변경함으로써 추세 움직임의 연속성을 더 잘 표현함으로써 가격 추세의 시작과 끝을 보다 효율적으로 감지할 수 있다는 것이 관찰되었습니다. 가격 추세를 감지하는 효율성으로 인해 상단과 하단의 차이를 매우 명확하게 식별하여 거래 기회를 더 잘 활용할 수도 있습니다. 구성 가능한 기능과 경고가 있는 전문가용 버전을 사용해 보십시오:   MACD Intraday Trend PRO 특징 모든 통화 쌍에서 작동 모든 시간대에 작동 Renko 차트와 함께 작동 여전히 질문이 있는 경우 다이렉트 메시지로 저에게 연락하십시오.   https://www.mql5.com/ko/users/robsjunqueira/
FREE
Tabajara Ogro
JETINVEST
4.77 (13)
Setup Tabajara was created by a Brazilian trader known as  "The OGRO of Wall Street" . The idea of this setup is to indicate to the trader the current trend of prices and  the type of operation should be looked for in the graph. Operation It does this through the relation of the closing price position and the     of 20 periods, by painting the candles in 4 possible colors : Green -> Price rising in upward trend (Search entry points for PURCHASE) Black -> Price correcting in Bullish Trend (Sear
FREE
This indicator calculates the difference between the SELL aggression and the BUY aggression that occurred in each Candle, plotting the balance of each one graphically. Note: This indicator DOES NOT WORK for Brokers and/or Markets WITHOUT the type of aggression (BUY or SELL). Be sure to try our   Professional   version with configurable features and alerts:   Delta Agression Volume PRO Settings Aggression by volume (Real Volume) or by number of trades (Tick Volume) Start of the Aggression Delta
FREE
This simple indicator paints with a darker color on the volume bar when the quantity traded is above the average of select number of periods of the volume itself, highlighting the moments when there was a large volume of deals above the average. It is also possible to use a configuration of four colors where the color tone shows a candle volume strength. The indicator defaults to the simple average of 20 periods, but it is possible to change to other types of averages and periods. If you like t
FREE
Aggression Wave RSJ
JETINVEST
4.83 (6)
This indicator sums up the difference between the sells aggression and the buys aggression that occurred in each Candle, graphically plotting the waves of accumulation of the aggression volumes.   Through these waves an exponential average is calculated that indicates the direction of the business flow. Note: This indicator DOES NOT WORK for Brokers and/or Markets WITHOUT the type of aggression (BUY or SELL).   Be sure to try our Professional version with configurable features and alerts:  Agre
FREE
Funcionamento: O Painel  Netting Panel RSJ  funciona com   qualquer ativo   e em   qualquer tempo gráfico . Ele funciona em contas do tipo " Netting " e " Hedge ", mas gerencia apenas uma posição por ativo, por isso o nome   Netting.   Se ele for executado em contas do tipo " Hedge ", ele fará o gerenciamento e proteção   apenas da posição mais antiga , ou seja, da primeira posição que foi aberta por ele. Em contas " Netting " quando os botões " SELL " ou " BUY " forem pressionados,   ocorrerá
FREE
Vwap RSJ
JETINVEST
4.82 (11)
VWAP RSJ is an indicator that plots the Hourly, Daily, Weekly and Monthly  VWAP Lines. Large institutional buyers and   mutual funds   use the VWAP ratio to help move into or out of stocks with as small of a market impact as possible. Therefore, when possible, institutions will try to buy below the VWAP, or sell above it. This way their actions push the price back toward the average, instead of away from it. Based on this information I developed this indicator that combines 4 types of VWAP Tim
FREE
This simple indicator paints with a darker color on the volume bar when the quantity traded is above the average of select number of periods of the volume itself, highlighting the moments when there was a large volume of deals above the average. It is also possible to use a configuration of four colors where the color tone shows a candle volume strength. The indicator defaults to the simple average of 20 periods, but it is possible to change to other types of averages and periods. If you like t
FREE
MACD Intraday Trend PRO는 1960년대 Gerald Appel이 만든 원본 MACD를 개조하여 개발한 지표입니다. 수년간의 거래를 통해 MACD의 매개변수를 피보나치 비율로 변경함으로써 추세 움직임의 연속성을 더 잘 표현함으로써 가격 추세의 시작과 끝을 보다 효율적으로 감지할 수 있다는 것이 관찰되었습니다. 가격 추세를 감지하는 효율성으로 인해 상단과 하단의 차이를 매우 명확하게 식별하여 거래 기회를 더 잘 활용할 수도 있습니다. 특징 표시기 MACD Intraday Trend PRO는 모든 통화 쌍, 모든 시간대 및 Renko 차트에서 작동합니다. 5가지 모드를 선택하여 추세 감지 속도를 설정할 수 있습니다. 가장 빠른 빠른 정상 느린 가장 느림 자원 6개의 구성 가능한 경고가 있습니다. MACD는 신호 라인에서 후퇴 MACD가 신호선을 넘다 MACD는 레벨 0을 교차 신호선이 레벨 0을 넘습니다. MACD 변경 트렌드 색상 신호선 변경 TREND 색상
RENKO PRICE ACTION ATR은 각 BRICK이 사용자가 선택한 기간의 ATR을 통해 계산된 크기를 갖는 Renko Chart의 구성을 통해 개발된 "Expert Advisor"입니다. Renko 차트는 사소한 가격 변동을 걸러내도록 설계되어 거래자가 중요한 추세에 더 쉽게 집중할 수 있습니다. 가격 추세를 감지하는 효율성으로 인해 지지와 저항, 상단 및 하단 다이버전스를 명확하게 식별하여 거래 기회를 더 잘 활용할 수도 있습니다. 작업 RENKO PRICE ACTION ATR은 모든 통화 쌍에서 작동합니다. RENKO PRICE ACTION ATR은 실시간 업데이트 성능이 뛰어납니다. 설정 ATR 계산 기간: RENKO PRICE ACTION ATR이 ATR의 평균을 적용하고 각 BRICK의 크기를 계산/재계산하기 위해 사용자가 선택한 기간입니다. ATR 계산 평균 기간: 각 BRICK에 대한 크기 계산을 수행하기 위해 RENKO PRICE ACTION ATR에 대
지표 공급 수요 RSJ PRO는 그래프에 "공급" 및 "수요" 영역을 계산하고 표시하여 영역 유형(약함, 강함, 확인됨, 입증됨)을 식별하고 영역을 다시 테스트하는 경우 몇 번인지 보여줍니다. 재시험했다. "공급" 구역은 수요보다 공급이 더 많이 발생하여 가격을 낮추는 가격 구역입니다. "수요" 구역은 공급보다 많은 수요가 발생하여 가격을 상승시키는 가격 구역입니다. 구성 가능한 기능 및 경고가 포함된 전문가용 버전을 사용해 보십시오: Suppy Demand RSJ PRO 구역 분류 약함: 다시 테스트할 경우 위반될 가능성이 있는 가격 영역입니다. 강함: 추세의 방향을 변경했고 그렇게 빨리 재시험될 가능성이 없는 가격 영역. 검증됨: 최대 1~3번의 재테스트가 있었지만 가격이 해당 영역을 깰 수 없는 강한 가격 영역. 입증됨: 3회 이상의 재시험이 있었지만 가격이 해당 지역을 돌파하지 못한 강한 가격 영역. Broken/Turncoat: 지지의 경우 저항이 되고 지지의 경우
Aggression Wave PRO is an indicator developed to monitor the divergence, strength, and continuity of the aggression volume of sell and buy negotiations.  The  Agrression Wave PRO   has features that allow you to view beyond the accumulated delta volume of the day. Note: This indicator DOES NOT WORK for Brokers and/or Markets WITHOUT the type of aggression (BUY or SELL). Cryptocurrencies and Forex do not provide this type of information, that is, it does not work with it. Operation It is possib
Delta Aggression Volume PRO is an indicator developed to monitor the strength and continuity of the aggression volume of sell and buy negotiations. Note: This indicator DOES NOT WORK for Brokers and/or Markets WITHOUT the type of aggression (BUY or SELL). Cryptocurrencies and Forex do not provide this type of data, that is, it does not work with them. O Delta Agrression Volume PRO has features that allow you to view beyond the delta volume of the day. Operation Multi symbols  (those who provid
지표 공급 수요 RSJ PRO는 그래프에 "공급" 및 "수요" 영역을 계산하고 표시하여 영역 유형(약함, 강함, 확인됨, 입증됨)을 식별하고 영역을 다시 테스트하는 경우 몇 번인지 보여줍니다. 재시험했다. "공급" 구역은 수요보다 공급이 더 많이 발생하여 가격을 낮추는 가격 구역입니다. "수요" 구역은 공급보다 많은 수요가 발생하여 가격을 상승시키는 가격 구역입니다. 구역 분류 약함: 다시 테스트할 경우 위반될 가능성이 있는 가격 영역입니다. 강함: 추세의 방향을 변경했고 그렇게 빨리 재시험될 가능성이 없는 가격 영역. 검증됨: 최대 1~3번의 재테스트가 있었지만 가격이 해당 영역을 깰 수 없는 강한 가격 영역. 입증됨: 3회 이상의 재시험이 있었지만 가격이 해당 지역을 돌파하지 못한 강한 가격 영역. Broken/Turncoat: 지지의 경우 저항이 되고 지지의 경우 저항이 되는 깨지는 가격 영역입니다. 설정 시각적 설정: 약한 영역 표시: 약한 영역으로 분류된 영역이 표시됩니
Trend WDO B3
JETINVEST
5 (1)
Trend WDO B3는 MT5 플랫폼용으로 제작된 전문 거래 시스템으로 BRAZIL B3의 MINI DOLAR INDEX(WDO)와 함께 작동하도록 최적화되어 있습니다. 시스템은 여러 시간대(1M, 5M, 15M, 30M, H1, H4, D1)에서 Fuzzy Logic을 사용하여 계산에 따라 각 시간대에 가중치를 적용하여 가격 추세를 식별합니다. 추세를 파악한 후 시스템은 평균 변동성에 따라 STOP 주문(BUY 또는 SELL)을 포지셔닝하고, 포지션이 열리면 EA는 항상 이익 극대화를 추구하는 트레일링 스톱(trailing stop)을 통해 거래를 수행합니다. 주요 특징 마틴게일을 사용하지 않음 그리드를 사용하지 않음 Fuzzy 알고리즘으로 계산된 추세를 그래프에 표시 모든 시간대에 작동 구성 가능한 운영 시간 구성 가능한 개방 GAP 제어 구성 가능한 로트 증대 동적 모드 4개의 구성 가능한 트레일링 스톱 레벨 제품 설명서와 동영상이 있는 블로그에 접속하여 더 자세한 정보와
Trend WIN B3
JETINVEST
5 (4)
Trend WIN B3는 MT5 플랫폼용으로 제작된 전문 거래 시스템으로 BRAZIL B3의 MINI FUTURE INDEX(WIN)와 함께 작동하도록 최적화되어 있습니다. 시스템은 여러 시간대(1M, 5M, 15M, 30M, H1, H4, D1)에서 Fuzzy Logic을 사용하여 계산에 따라 각 시간대에 가중치를 적용하여 가격 추세를 식별합니다. 추세를 파악한 후 시스템은 평균 변동성에 따라 STOP 주문(BUY 또는 SELL)을 포지셔닝하고, 포지션이 열리면 EA는 항상 이익 극대화를 추구하는 트레일링 스톱(trailing stop)을 통해 거래를 수행합니다. 주요 특징 마틴게일을 사용하지 않음 그리드를 사용하지 않음 Fuzzy 알고리즘으로 계산된 추세를 그래프에 표시 모든 시간대에 작동 구성 가능한 운영 시간 구성 가능한 개방 GAP 제어 구성 가능한 로트 증대 동적 모드 4개의 구성 가능한 트레일링 스톱 레벨 제품 설명서와 동영상이 있는 블로그에 접속하여 더 자세한 정
SniperBot EURUSD
JETINVEST
5 (1)
EA는 변동성, 스프레드, 빈도 및 타이밍을 사용하여 거래 시기를 결정합니다. EA는 지정가 주문 방법을 사용하여 포지션을 엽니다. 이 경우 Slippage는 항목을 실행할 때 기껏해야 긍정적일 것입니다. EA는 시스템의 초점이 자본을 보호하면서 돈을 버는 것이므로 Trailing Take Profit 논리를 사용합니다. 대부분의 거래는 저격 헤드샷처럼 빠르게 마감됩니다. 주요 특징 마틴게일을 사용하지 않습니다 그리드를 사용하지 않음 최적화된 통화 쌍: EURUSD 기간: M5 주의 사항: 이 EA는 롤오버 전 몇 분부터 롤오버 후 몇 분까지 하루에 일정 범위의 시간 동안만 거래합니다. .set 파일이 필요하지 않으며 모든 설정이 EA에 저장됩니다. 브로커가 접미사(예: XXXXXX.a)를 사용하는 경우 EA가 자동으로 식별하므로 걱정하지 않아도 됩니다. 설치하는 방법 이 시스템은 독립형이며 VPS에서 지속적으로 실행되어야 합니다. 낮은 스프레드 ECN 브로커에서 EA를 실행
Sniper Major
JETINVEST
5 (1)
EA는 변동성, 스프레드, 빈도 및 타이밍을 사용하여 거래 시기를 결정합니다. EA는 지정가 주문 방법을 사용하여 포지션을 엽니다. 이 경우 Slippage는 항목을 실행할 때 기껏해야 긍정적일 것입니다. EA는 시스템의 초점이 자본을 보호하면서 돈을 버는 것이므로 Trailing Take Profit 논리를 사용합니다. 대부분의 거래는 저격 헤드샷처럼 빠르게 마감됩니다. 주요 특징 마틴게일을 사용하지 않습니다 그리드를 사용하지 않음 최적화된 통화 쌍: EURUSD | GBPUSD | 엔엔 | USDCHF 기간: M5 주의 사항: 이 EA는 롤오버 전 몇 분부터 롤오버 후 몇 분까지 하루에 일정 범위의 시간 동안만 거래합니다. 하나의 차트 설정: 모든 최적화된 기호를 거래하려면 하나의 차트만 있으면 됩니다. 여러 통화 쌍 지원 .set 파일이 필요하지 않으며 모든 설정이 EA에 저장됩니다. 브로커가 접미사(예: XXXXXX.a)를 사용하는 경우 EA가 자동으로 식별하므로 걱정하지
필터:
Damian Blaha
594
Damian Blaha 2025.03.27 04:11 
 

отличный индикатор

JETINVEST
368842
개발자의 답변 Roberto Sant Ana Junqueira 2025.03.27 10:41
tks for the review
Flaviona
134
Flaviona 2025.03.23 21:52 
 

사용자가 평가에 대한 코멘트를 남기지 않았습니다

JETINVEST
368842
개발자의 답변 Roberto Sant Ana Junqueira 2025.03.25 10:47
tks for the review
Rafal Krzysztof Manuszewski
2387
Rafal Krzysztof Manuszewski 2024.10.06 17:09 
 

👍

JETINVEST
368842
개발자의 답변 Roberto Sant Ana Junqueira 2024.10.08 17:59
Obrigado por seu Review
Alessandro Lopes Da Silva
283
Alessandro Lopes Da Silva 2024.02.26 19:16 
 

Pessoal deixo aqui meu comentário e espero contribuir com voces! Esse indicador juntamente com medias moveis 9,21,50 no ativo US30 é uma maquina de fazer dinheiro, principalmente para quem trabalha com mesa proprietária. O melhor horário para operar é o de New York, excelentes gatilhos de entradas e saídas. Observação importante, procure sempre ir a favor da tendencia. No demais, muito obrigado Roberto Junqueira!!!

JETINVEST
368842
개발자의 답변 Roberto Sant Ana Junqueira 2024.02.26 19:18
Obrigado por seu Review Alessandro
fj6hCuoc
119
fj6hCuoc 2023.09.12 09:46 
 

An excellent Volume Indicator

JETINVEST
368842
개발자의 답변 Roberto Sant Ana Junqueira 2024.02.26 19:18
tks for the review
CARLOS CESTARI
33
CARLOS CESTARI 2022.03.31 05:12 
 

Muito bom, fica melhor se for usado junto com o Heiken_Ashi. Obrigado.

JETINVEST
368842
개발자의 답변 Roberto Sant Ana Junqueira 2024.02.26 19:19
obrigado pelo review
robkey
24
robkey 2022.02.13 11:19 
 

muito bom obrigado

JETINVEST
368842
개발자의 답변 Roberto Sant Ana Junqueira 2024.02.26 19:19
obrigado pelo review
mchelpmf
186
mchelpmf 2022.02.05 14:31 
 

The indicator has potential, it is promising

JETINVEST
368842
개발자의 답변 Roberto Sant Ana Junqueira 2024.02.26 19:19
tks for the review
T0uro22
34
T0uro22 2021.10.31 20:30 
 

Gostei... obrigado

JETINVEST
368842
개발자의 답변 Roberto Sant Ana Junqueira 2023.09.15 16:34
obrigado pelo review
Guilherme Guimaraes Dias
756
Guilherme Guimaraes Dias 2021.08.31 03:37 
 

사용자가 평가에 대한 코멘트를 남기지 않았습니다

JETINVEST
368842
개발자의 답변 Roberto Sant Ana Junqueira 2021.09.03 21:49
Obrigado Guilherme
Fabio_Novaes
175
Fabio_Novaes 2021.06.30 21:44 
 

사용자가 평가에 대한 코멘트를 남기지 않았습니다

JETINVEST
368842
개발자의 답변 Roberto Sant Ana Junqueira 2021.06.30 23:10
tks
33359
82
33359 2021.06.23 06:10 
 

Хороший индикатор.

JETINVEST
368842
개발자의 답변 Roberto Sant Ana Junqueira 2021.06.30 16:05
Tks for your review.
Marilise Ravaglio Da Cunha Junqueira
386
 

사용자가 평가에 대한 코멘트를 남기지 않았습니다

JETINVEST
368842
개발자의 답변 Roberto Sant Ana Junqueira 2021.06.30 16:05
Tks for your review.
30886094
14
30886094 2021.05.03 21:00 
 

Olá roberto, tudo bem? Indicador perfeito e muito bom. Ele esta me ajudando bastante. Parabéns!

Abraços,

Abel

JETINVEST
368842
개발자의 답변 Roberto Sant Ana Junqueira 2021.06.30 16:05
Tks for your review.
리뷰 답변