Neuron Quant Standard Deviation System
- 지표
- 버전: 1.10

NeuronQuant is a premium quant analytics indicator for MetaTrader 5 from Neuron Systems. It reads the chart with the kind of statistical tools common in quantitative analysis: a forward expected-move range, realized volatility, a market-regime read and a standardized z-score. It is an indicator for chart analysis only: it does not place, modify or close trades, it does not send orders, and it does not manage positions or accounts.
Native MQL5, no DLLs, non-repainting closed-bar logic. Works on any symbol (forex, gold and metals, indices, crypto) and any timeframe.
=== HOW IT WORKS ===
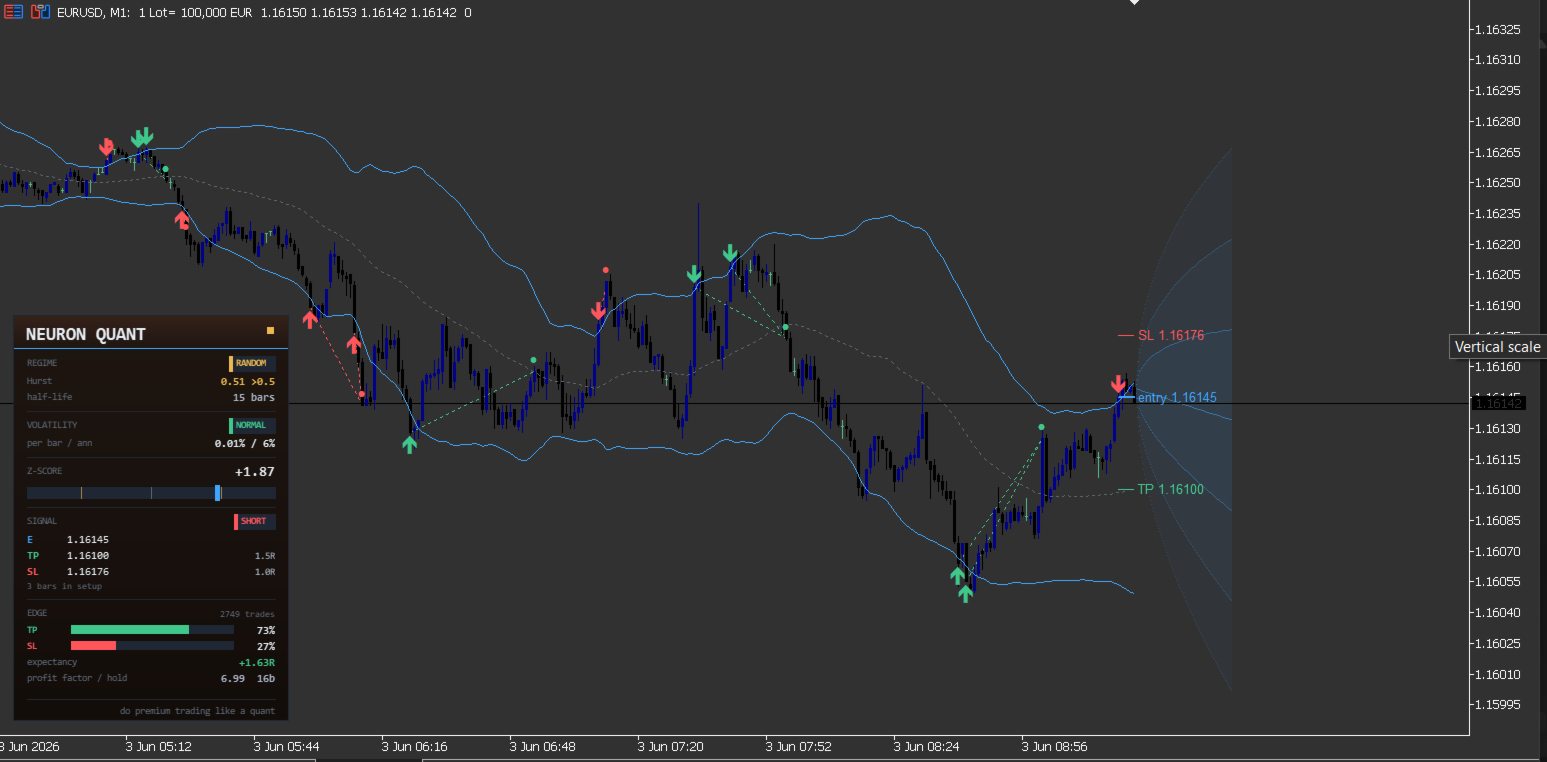
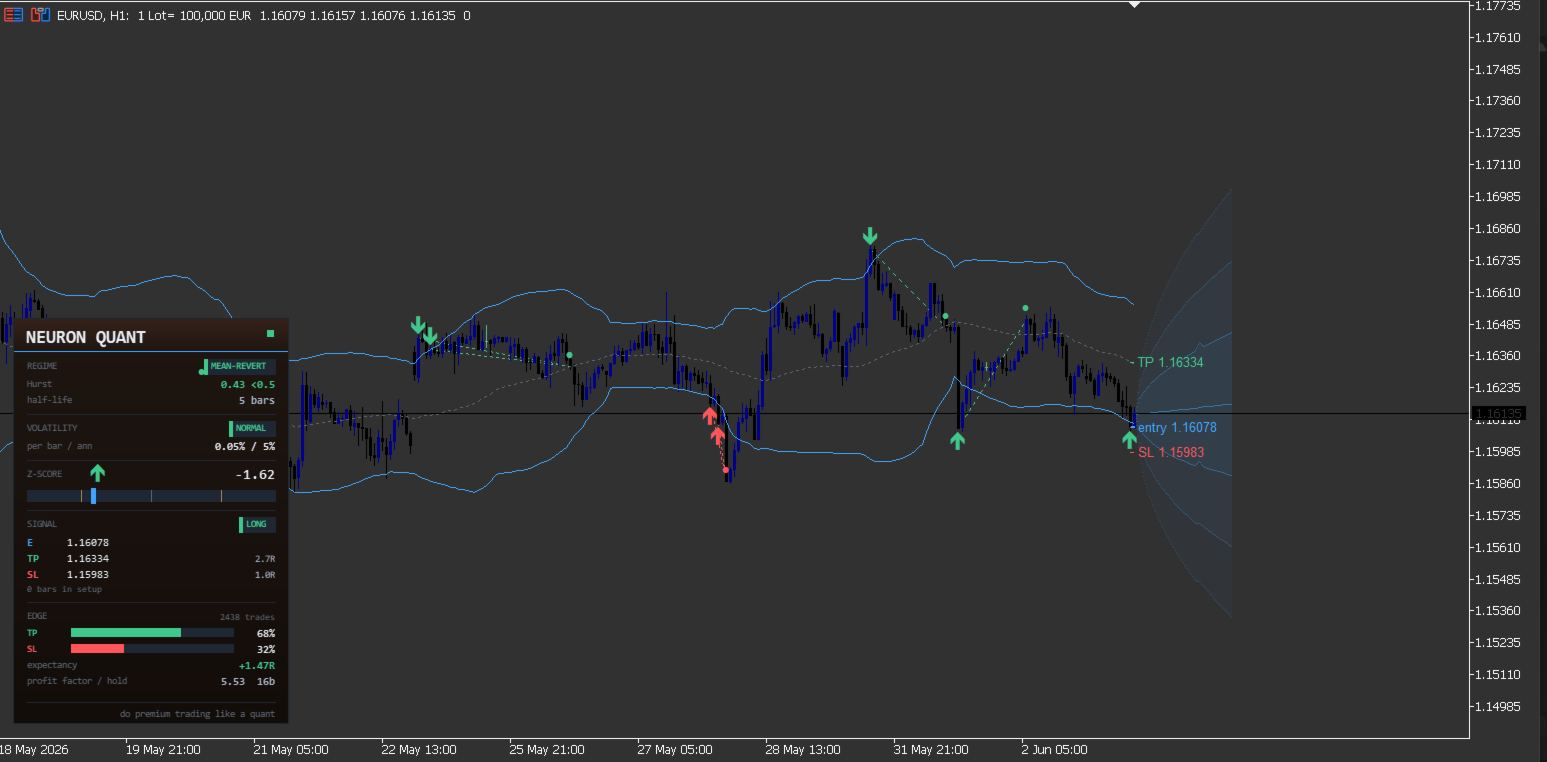
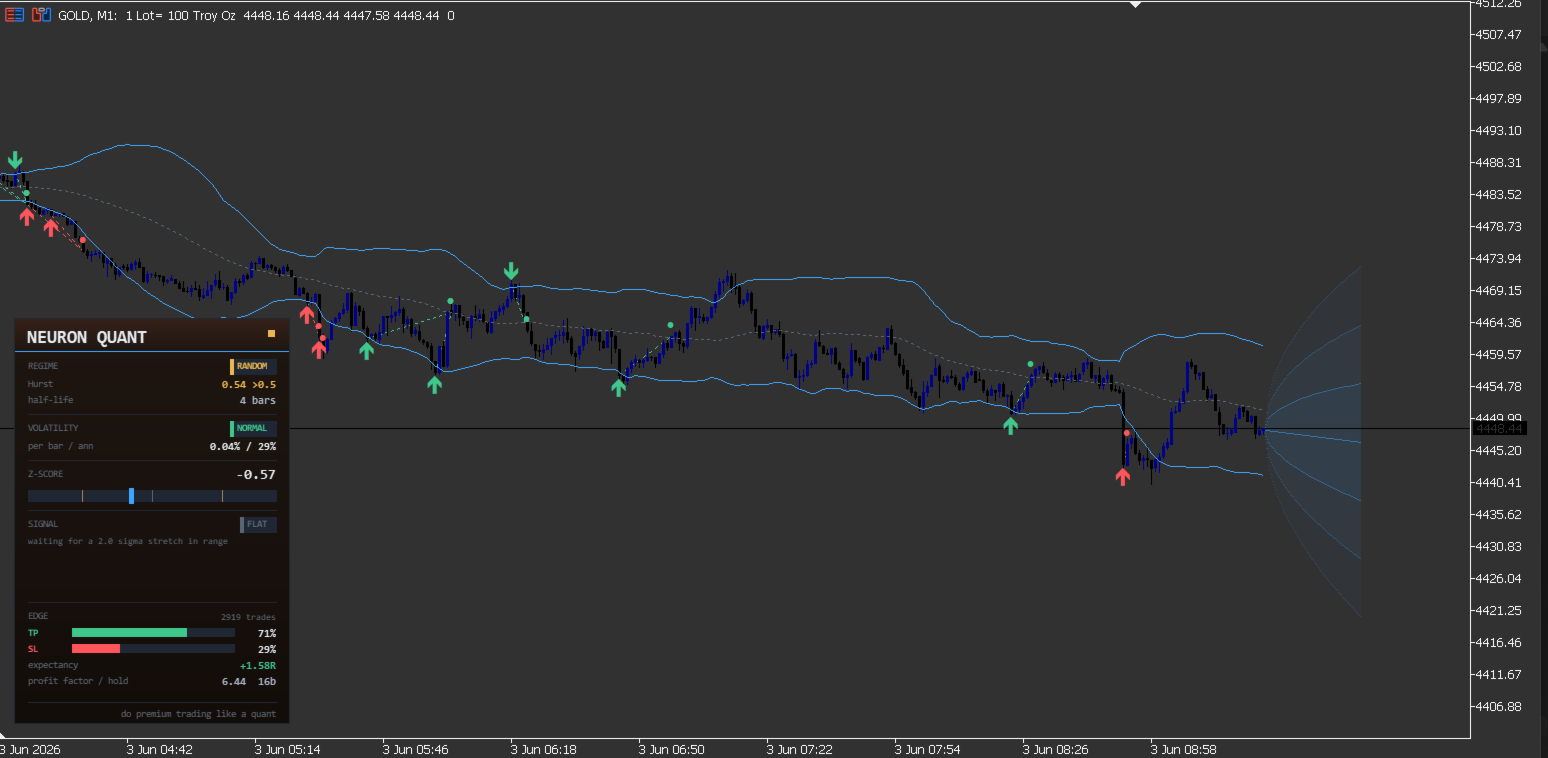
The signature feature is the forward probability cone. From the current price, NeuronQuant projects expected-move bands at 1, 2 and 3 sigma forward of the bar (24 bars ahead by default) on a translucent neon back-layer canvas behind the candles, so the candles stay crisp and readable. The cone is built from realized volatility and widens with the square root of time, the standard diffusion shape, and its centre line is drift-adjusted. This is the statistical expected RANGE ahead, roughly how far price tends to travel over that horizon given its recent volatility. It is a statistical expected-move range, not a price prediction and not a guarantee that price stays inside it.
Three quant engines feed that view and the dashboard:
- Volatility engine. Realized volatility on every closed bar, as an EWMA (RiskMetrics) figure with adjustable decay or a simple standard deviation of log returns, plus an annualized figure and a LOW / NORMAL / HIGH regime versus the long-run volatility.
- Regime engine. The Hurst exponent (variance-time scaling) labels the market MEAN-REVERTING, RANDOM or TRENDING, with a mean-reversion half-life (Ornstein-Uhlenbeck regression) in bars.
- Z-score engine. A rolling mean with sigma bands and a standardized gauge show how stretched price is from its own mean, with an adjustable threshold and a clear stretched state.
Statistical mean-reversion read (a study, not a system). When price stretches to your z threshold while the regime read is ranging, NeuronQuant marks a classic, textbook mean-reversion study on the panel and the chart: an entry, a stop at the further sigma extreme, and a target at the mean, drawn as neon lines with an arrow and expressed as distance in pips, with the distance to the mean also shown as a multiple of the stop distance (R) purely as a study measurement. It is descriptive and educational; it is not a signal, it does not promise profit, and it makes no claim of an edge or of future results.
=== WHAT IS INCLUDED ===
| Module | What it does |
|---|---|
| Forward probability cone | 1 / 2 / 3 sigma expected-move bands projected forward from realized volatility, widening with the square root of time, with a drift-adjusted centre line, on a translucent neon back-layer behind crisp candles. Adjustable horizon and opacity; can be turned off. |
| Volatility engine | Realized volatility per bar (EWMA / RiskMetrics with adjustable decay, or standard deviation of log returns), an annualized figure, and a LOW / NORMAL / HIGH regime versus the long-run. |
| Regime engine (Hurst) | A Hurst exponent (variance-time scaling) labelling the market MEAN-REVERTING, RANDOM or TRENDING, plus a mean-reversion half-life (Ornstein-Uhlenbeck) in bars. |
| Z-score engine | A rolling mean with sigma bands and a standardized z-score gauge, with an adjustable threshold and a stretched state. |
| Mean-reversion read (study) | When price is stretched in a ranging regime, the panel and chart mark a textbook study: entry, stop at the further sigma extreme, target at the mean. Descriptive and educational only. |
| On-chart history | Past study setups marked entry, path line and exit dot, coloured by whether price reached the mean or the stop. A descriptive record, not a prediction. |
| Statistics panel | A descriptive breakdown of how past study setups resolved on this chart and timeframe: how many reached the mean, how many reached the stop, and the average holding time. Descriptive history only. |
| Dashboard and alerts | A clean quant panel with the volatility figure and regime, the Hurst label and half-life, the z-score and stretch state, and the current study read-out. Pop-up, push and platform email alerts on a new stretch. |
=== SPECIFICATIONS ===
| Type | Indicator (chart analysis only) |
| Platform | MetaTrader 5, any build |
| Markets | Forex, gold and metals, indices, crypto |
| Timeframes | All |
| Engine | Native MQL5, no DLLs, non-repainting closed-bar logic |
| Probability cone | 1 / 2 / 3 sigma expected-move range, 24 bars forward (adjustable) |
| Volatility | EWMA (RiskMetrics) or standard deviation, plus annualized and a regime read |
| Regime | Hurst exponent and mean-reversion half-life |
| Z-score | Rolling mean, sigma bands and a stretch gauge |
| Dashboard | Regime, volatility, z-score and study read-out |
| Alerts | Pop-up, push and platform email |
=== INPUTS ===
| Group | Input | Default | Purpose |
|---|---|---|---|
| Volatility | InpVolPeriod | 100 | Volatility / drift lookback (bars) |
| Volatility | InpEWMA | true | EWMA (RiskMetrics) volatility vs simple standard deviation |
| Volatility | InpLambda | 0.94 | EWMA decay (RiskMetrics) |
| Volatility | InpUseDrift | true | Include drift in the cone centre line |
| Volatility | InpHorizon | 24 | Cone projection horizon (bars forward) |
| Study | InpMeanPeriod | 50 | Rolling mean / sigma period (z-score) |
| Study | InpZEntry | 2.0 | Stretch threshold (sigma) that marks a study |
| Study | InpZStop | 3.0 | Stop sigma, the further extreme |
| Study | InpRegimePeriod | 24 | Efficiency-ratio regime lookback |
| Study | InpRangeMax | 0.40 | Mark a study only when the efficiency ratio is at or below this (ranging) |
| Study | InpMaxHold | 48 | Maximum bars to resolve a study setup (history) |
| Visuals | InpCone | true | Forward probability cone on / off |
| Visuals | InpConeAlpha | 30 | Cone opacity (0 to 255) |
| Visuals | InpShowSignal | true | On-chart entry / stop / target of the live study |
| Visuals | InpShowHistory | true | Mark past study setups on the chart |
| Visuals | InpHistoryMax | 60 | Maximum historical setups drawn |
| Visuals | InpShowMean | true | Rolling mean line |
| Visuals | InpBands | true | Plus / minus z sigma envelope on price |
| Visuals | InpUp / InpBull / InpBear | blue / green / red | Cone-entry / target / stop colours |
| Dashboard | InpDashboard | true | Quant panel on / off |
| Alerts | InpAlertSignal | true | Alert on a new stretch / study setup |
| Alerts | InpAlertPopup / InpAlertPush / InpAlertEmail | true / false / false | Alert channels |
=== COMPATIBILITY ===
- MetaTrader 5, any build.
- Any symbol: forex, gold and metals, indices, crypto.
- Any timeframe.
- Native MQL5, no DLLs and no external dependencies.
- Non-repainting closed-bar logic: values are computed on closed bars and do not change after the fact.
=== PAIRS WITH THE NEURON SUITE ===
NeuronQuant fits alongside the rest of the Neuron suite (each sold separately): NeuronTrend, NeuronCloud, NeuronIchimoku, NeuronStructure, NeuronLiquidity, NeuronSessions, NeuronSniper and NeuronFlow. Run them together for a layered read of trend, structure, liquidity, sessions, setups and now volatility and regime.
=== SUPPORT ===
Customisation requests and questions are welcome through the Comments tab on this product page.
NOTE: NeuronQuant is an indicator for chart analysis and decision support only. It does not place, modify or close trades, it does not send orders, and it does not manage positions or accounts. The forward cone is a statistical expected-move range, not a prediction, and the mean-reversion read and statistics panel are descriptive study tools, not a profitable system or a forecast. All trading decisions and execution remain entirely with you.