Central Pivot Range
- 지표
- 버전: 1.0
- 활성화: 5

CPR Pivot Framework - Professional Multi-Timeframe Pivot Points and CPR Indicator
DESCRIPTION
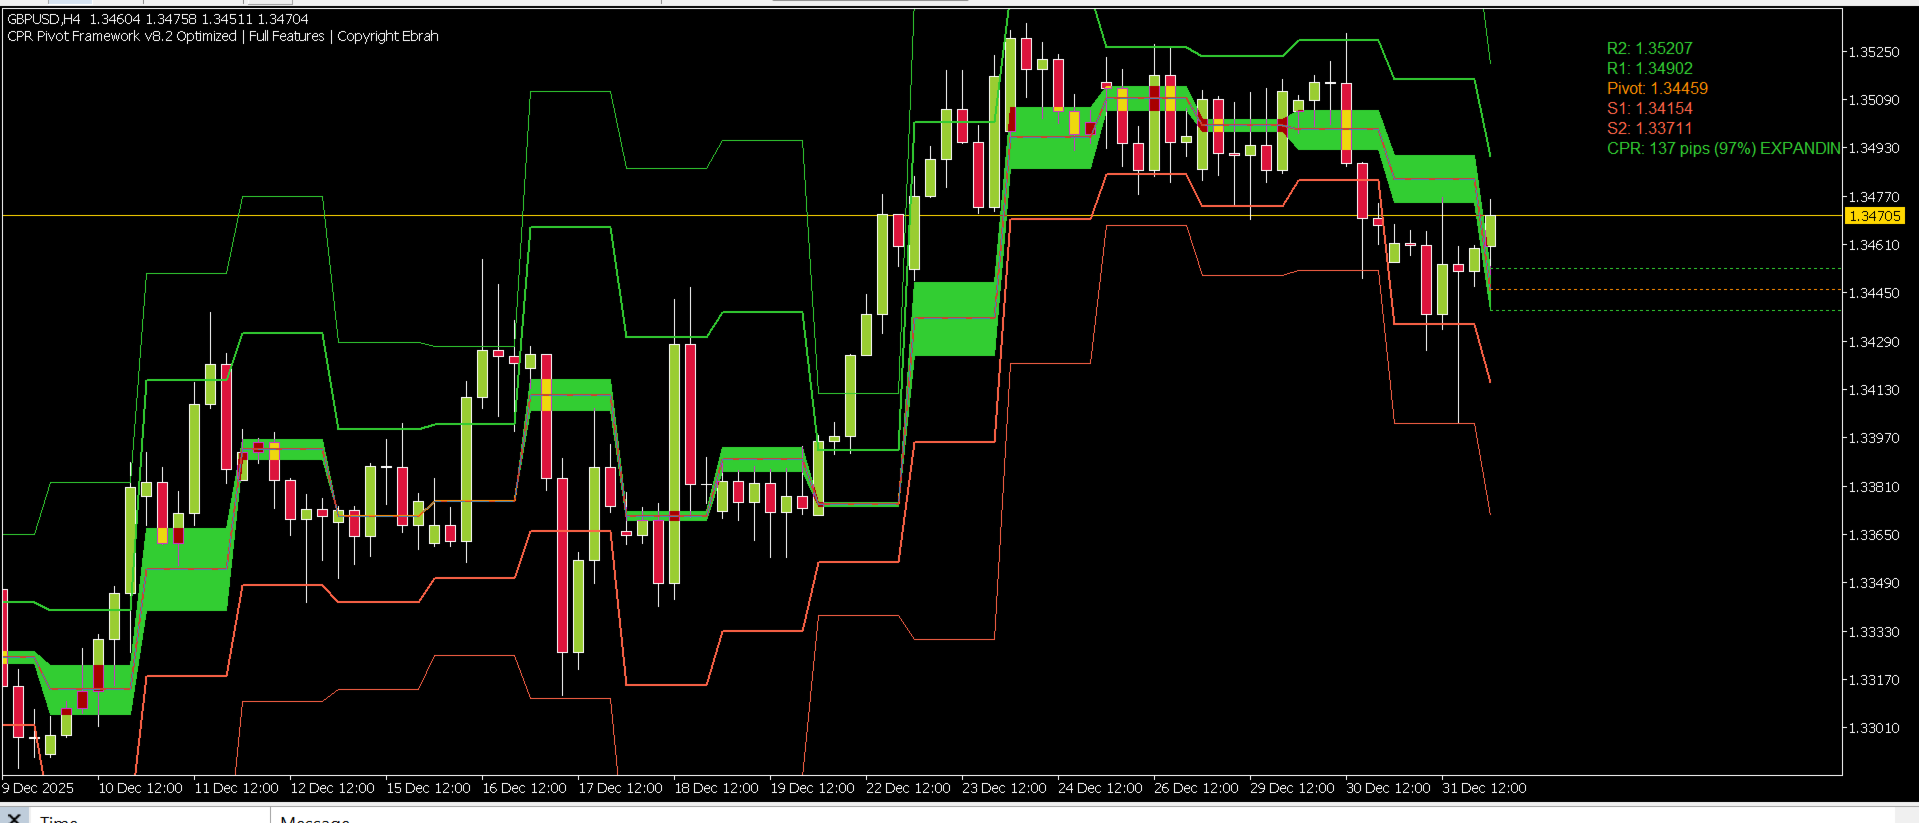
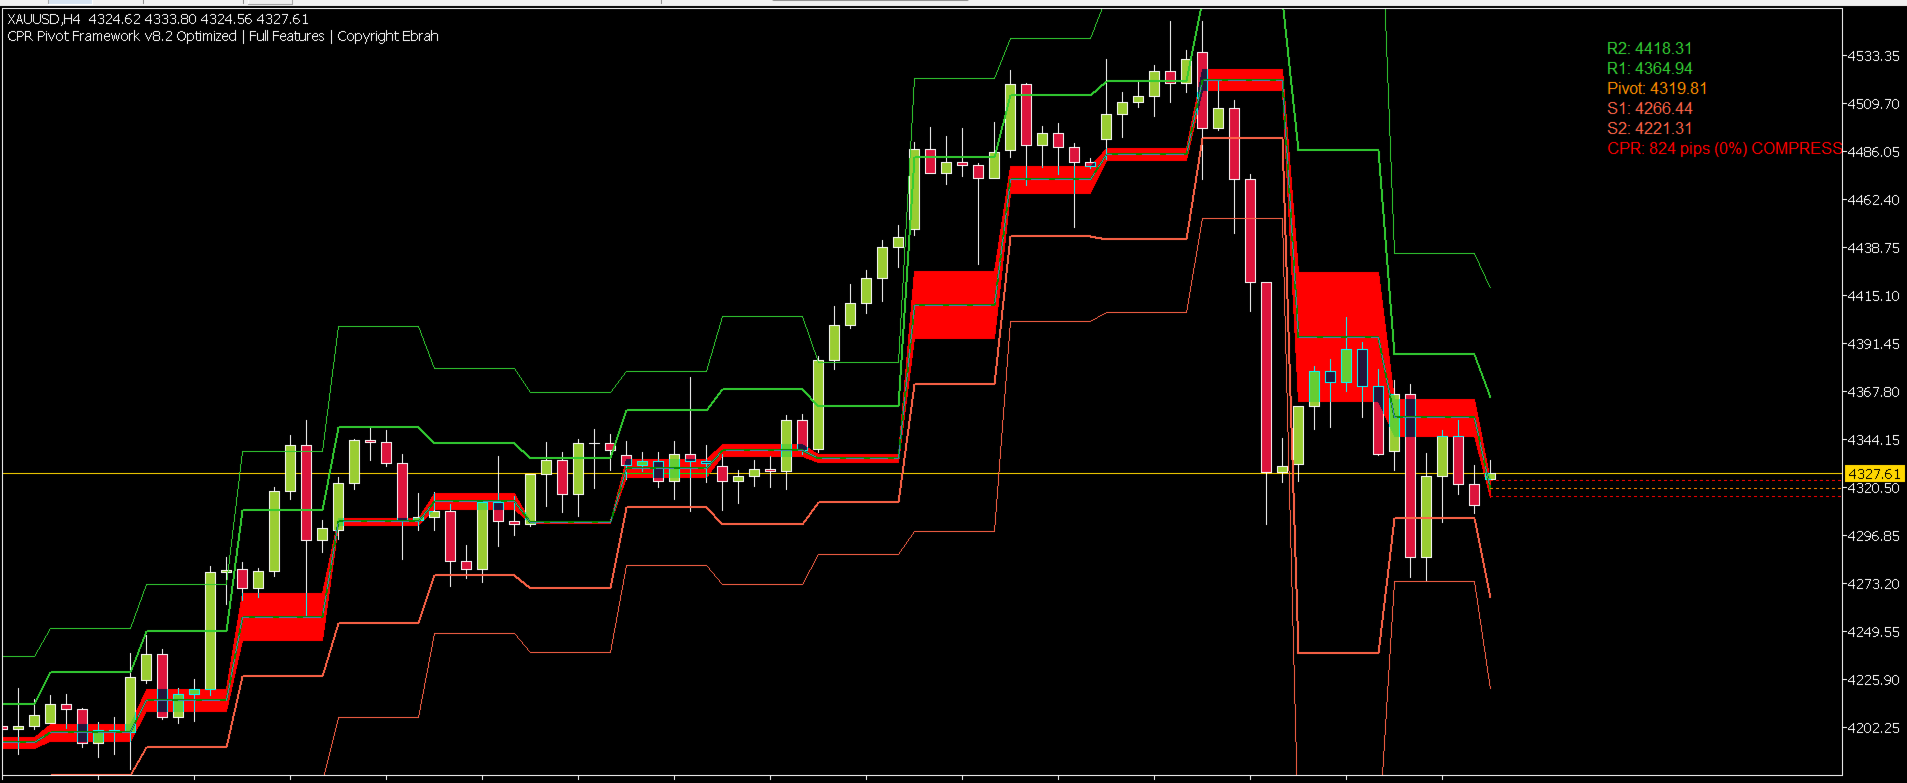
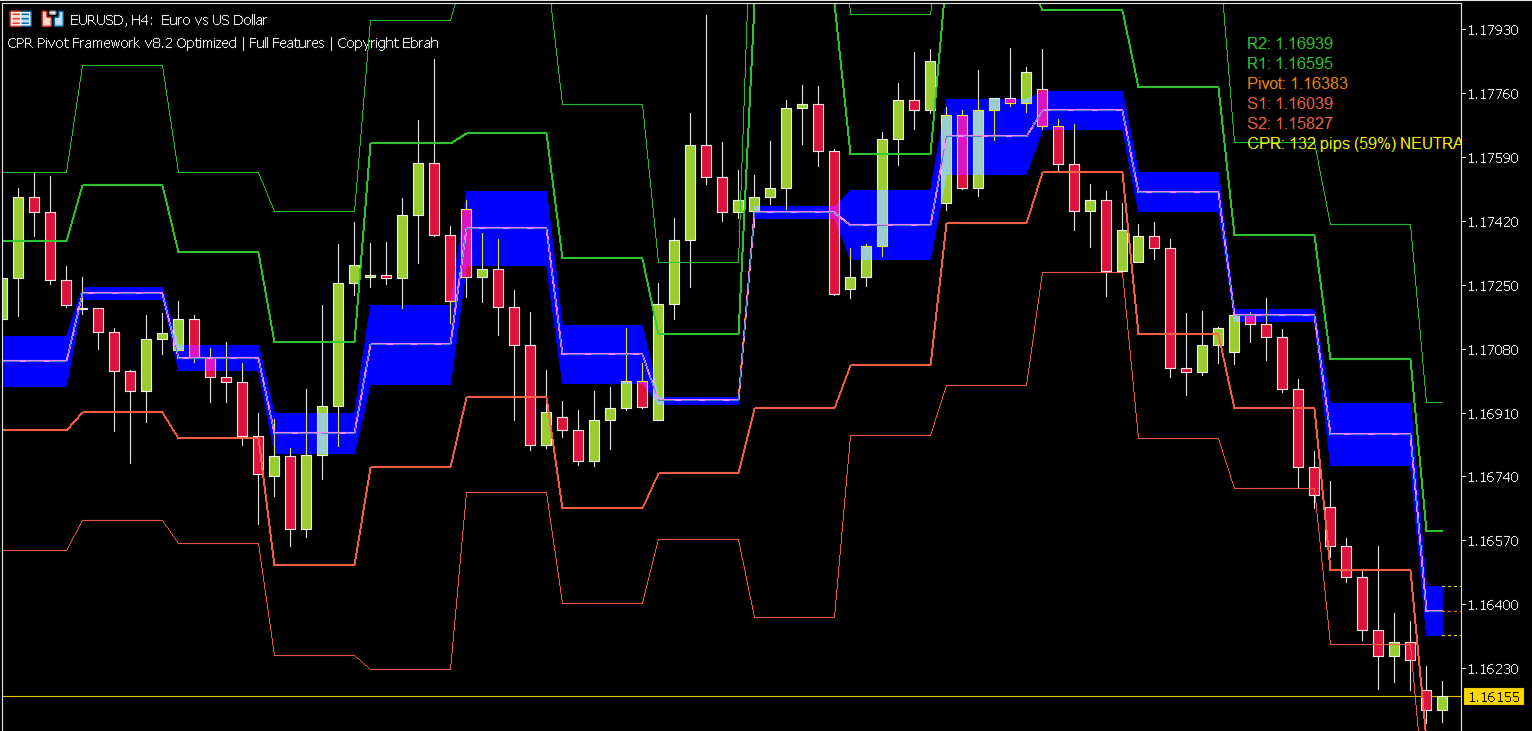
The CPR Pivot Framework is a professional-grade institutional trading tool that combines six pivot calculation methods with Central Pivot Range (CPR) analytics, multi-timeframe confluence detection, and real-time alerts.
Unlike basic pivot indicators that draw flat static lines, this framework generates session-aware historical pivots that accurately reflect past market structure, making it suitable for both live trading and strategy backtesting.
The framework is designed to answer five critical trading questions in real time:
-
What is the current market structure?
-
Where are the best entry zones?
-
How strong is the signal?
-
Where should risk be managed?
-
What immediate action should be taken?
Each signal includes a confluence score derived from multiple timeframe alignments, providing traders with a quantified confidence level for every trade setup.
KEY FEATURES| Feature | Description |
|---|---|
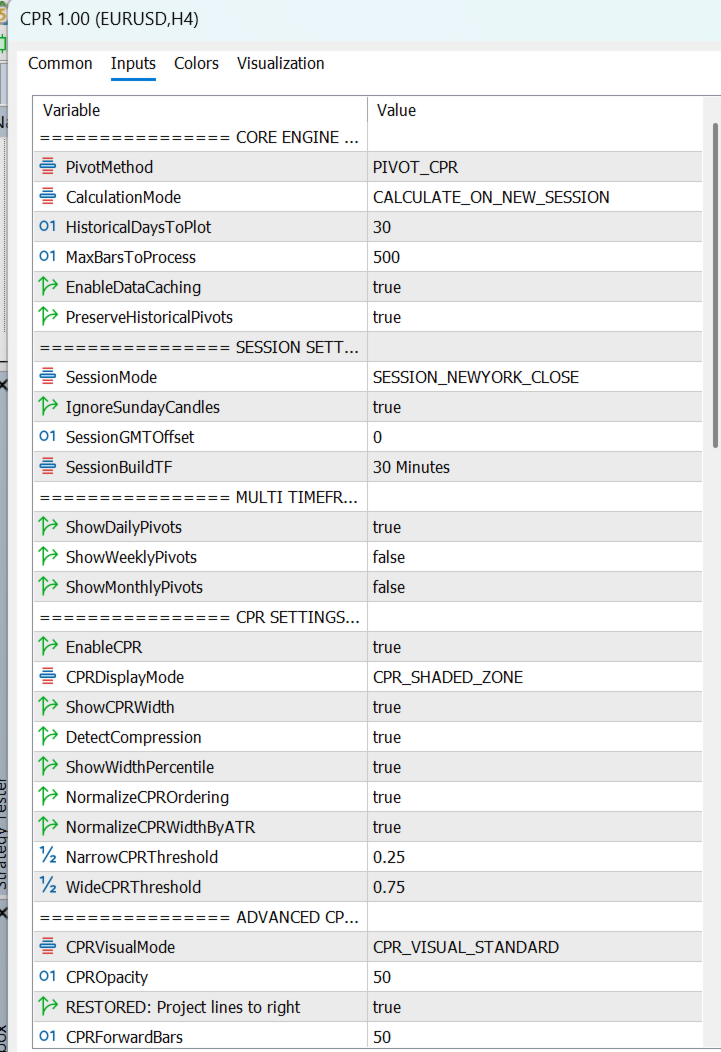
| Six Pivot Methods | Classic, Woodie, Fibonacci, Camarilla, DeMark, and CPR |
| Session-Aware Calculations | NY Close, London, Tokyo, Broker, or Custom sessions |
| Historical Pivot Cache | Every historical bar retains its own pivot values |
| CPR Compression Analytics | Width ratio, percentile ranking, adaptive coloring |
| Multi-Timeframe Confluence | Automatic Daily + Weekly + Monthly alignment detection |
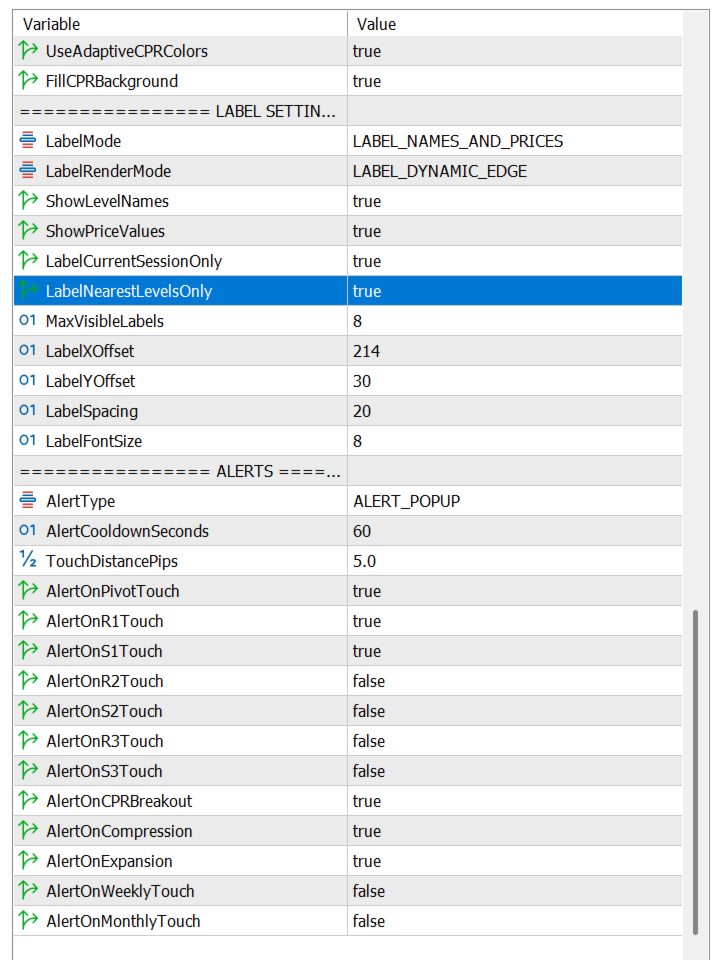
| Real-Time Alerts | Touch, breakout, compression, and expansion alerts |
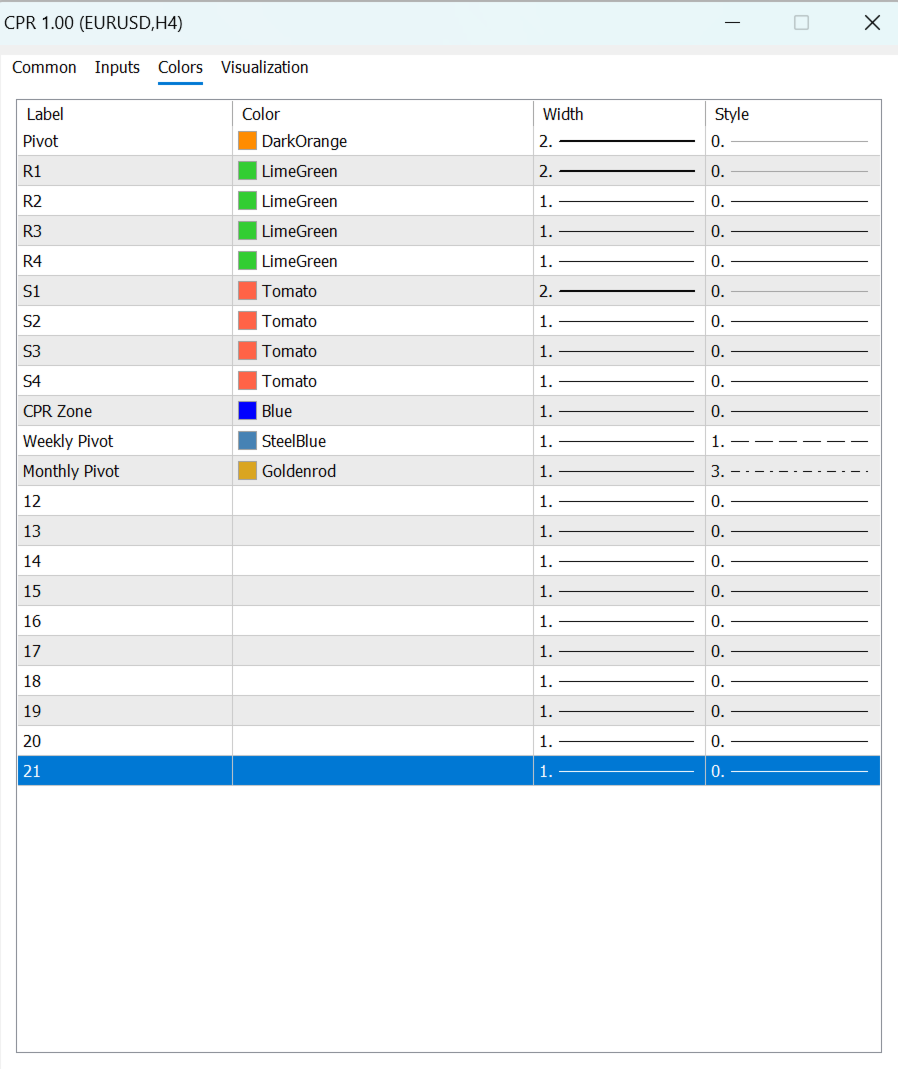
| Dynamic Labels | Auto-stacking right-edge labels with configurable placement |
| CPR Visualization Modes | Standard, Heatmap, Gradient, and Outline |
| Forward Projection | Projects CPR zones into future candles |
| EA-Ready Architecture | Dedicated buffers for automation and Expert Advisors |
WHAT QUESTIONS THIS INDICATOR ANSWERS
| Trading Question | How the Indicator Answers It |
|---|---|
| Market Structure | Daily, Weekly, and Monthly pivots define trend context |
| Best Entry | R1 and S1 identify optimal reaction zones |
| Signal Strength | Confluence scoring determines setup quality |
| Risk Parameters | CPR compression warns of volatility expansion |
| Immediate Action | Real-time alerts assist timing decisions |
| Stop Loss Placement | Next support/resistance level acts as natural protection |
| Profit Target | Opposite pivot levels define realistic targets |
SIGNAL HIERARCHY & CONFIDENCE SCORING
The framework uses a weighted confluence system to classify trade quality.
| Confluence Level | Levels Aligned | Confidence | Recommended Action |
|---|---|---|---|
| STRONG | 4 or more | High | High-probability trade setup |
| MEDIUM | 3 | Moderate | Standard position sizing |
| WEAK | 2 | Low | Reduced exposure or wait for confirmation |
Examples of HIGH Confidence Confluence
-
Daily Pivot + Weekly Pivot + Daily S1 within 10 pips
-
Daily CPR Top + Weekly R1 + Monthly Pivot alignment
-
Price at S1 + CPR compression + Weekly support overlap
Lower Priority Signals
-
Single level touches without confluence
-
Pivot reactions during low volatility
-
Neutral CPR width conditions
RISK MANAGEMENT FEATURES
| Feature | Risk Management Application |
|---|---|
| Stop Loss Levels | Use S1/S2 for longs and R1/R2 for shorts |
| Take Profit Zones | Opposite levels define realistic targets |
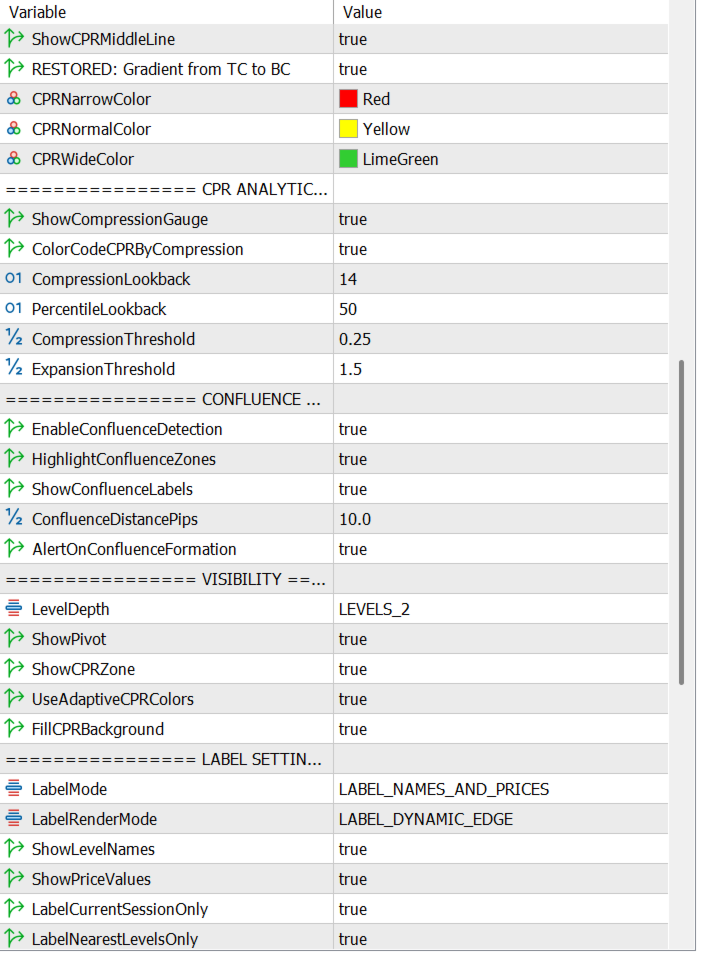
| Compression Alert | Red CPR warns of pending volatility expansion |
| Expansion Alert | Green CPR confirms momentum continuation |
| Confluence Zones | Magenta lines highlight high-probability zones |
| Cooldown Timer | Prevents repeated alert spam during volatility |
RISK-REWARD GUIDELINES
| Trade Type | Entry Condition | Stop Loss | Take Profit |
|---|---|---|---|
| Mean Reversion Long | S1 touch | Below S2 | Pivot or R1 |
| Mean Reversion Short | R1 touch | Above R2 | Pivot or S1 |
| Breakout Long | Close above R1 | Below R1 | R2 |
| Breakout Short | Close below S1 | Above S1 | S2 |
| CPR Compression | Wait for breakout | Opposite CPR edge | TC or BC |
EA-READY ARCHITECTURE
All trading signals are stored in dedicated indicator buffers for easy automation.
| Buffer Index | Signal Type |
|---|---|
| 0 | Pivot line |
| 1–4 | Resistance levels (R1–R4) |
| 5–8 | Support levels (S1–S4) |
| 9–10 | CPR Top and CPR Bottom |
| 13 | Weekly Pivot |
| 16 | Monthly Pivot |
| 23 | Compression Ratio |
| 24 | Percentile Rank |
Automation Notes
EA developers can access all values directly using CopyBuffer() with minimal latency.
Particularly useful buffers:
-
Buffer 23: CPR compression ratio for volatility-adjusted position sizing
-
Buffer 24: Percentile ranking for identifying extreme market conditions
EASE OF USE & CONFIGURATION
The framework works immediately using default settings.
Most traders only need to adjust the following parameters:
| Input | Recommended Setting |
|---|---|
| PivotMethod | PIVOT_CPR |
| SessionMode | SESSION_NEWYORK_CLOSE |
| LevelDepth | LEVELS_2 |
| LabelMode | LABEL_NAMES_AND_PRICES |
| AlertType | ALERT_POPUP or ALERT_ALL |
Advanced Configuration Options
Advanced users may customize:
-
Individual level visibility
-
Breakout sensitivity
-
Adaptive coloring
-
CPR rendering styles
-
Alert filtering
-
Projection distance
-
Confluence sensitivity
PERFORMANCE OPTIMIZATIONS
The framework includes several institutional-grade optimizations:
| Optimization | Benefit |
|---|---|
| Buffer Pruning | Limits memory usage |
| Lazy Calculations | Recalculates only on session change |
| Batch Processing | Prevents freezing during load |
| Object Pooling | Reuses chart objects efficiently |
| Historical Cache Pruning | Removes unnecessary historical data |
TECHNICAL SPECIFICATIONS
| Specification | Details |
|---|---|
| Supported Markets | Forex, Indices, Commodities, Crypto |
| Calculation Mode | Session-aware historical caching |
| Alert Types | Popup, Sound, Push, Email |
| Visualization Modes | Lines, Shaded Zones, Heatmap, Gradient, Outline |
| Architecture | Multi-buffer institutional framework |
PROFESSIONAL TRADING APPLICATION
This framework is designed for traders who require:
-
Institutional-style market structure analysis
-
Multi-timeframe pivot confluence
-
Volatility compression detection
-
Precision support/resistance mapping
-
EA-ready signal automation
-
Reliable historical backtesting
The indicator helps traders determine:
-
Where to enter
-
Where to exit
-
Where to place stops
-
How much risk to take
-
Which setups have the highest probability
before entering the trade.
SUPPORTContact: ebrah.ssali@Nnanda.com
KEYWORDSpivot points, CPR, central pivot range, support resistance, market structure, multi-timeframe, confluence detection, compression analysis, volatility indicator, MT5 indicator, trading system, entry signals, stop loss placement, take profit levels, automated trading, EA friendly, forex indicator, institutional trading, professional trader tool, daily pivots, weekly pivots, monthly pivots, classical pivots, woodie pivots, fibonacci pivots, camarilla pivots, demark pivots