ADX ClrDynamic MTF

ADX ClrDynamic MTF Dashboard: The Ultimate Multi-Timeframe Trend and Momentum Command Center

Tired of switching between timeframes to get the full market picture? Most ADX indicators show you only one timeframe at a time, forcing you to piece together the puzzle manually. ADX ClrDynamic MTF indicator changes everything by displaying up to 8 timeframes simultaneously in a single, elegant dashboard. This isn't just an indicator; it's your complete multi-timeframe decision-engine that identifies trend structure, measures strength, and pinpoints high-probability entries across all key timeframes at a glance.

Features Customizable ADX Level Line with cross alerts — set your own threshold (default 25) and receive instant notifications when momentum crosses critical zones across multiple timeframes simultaneously.

 Why ADX ClrDynamic MTF ?

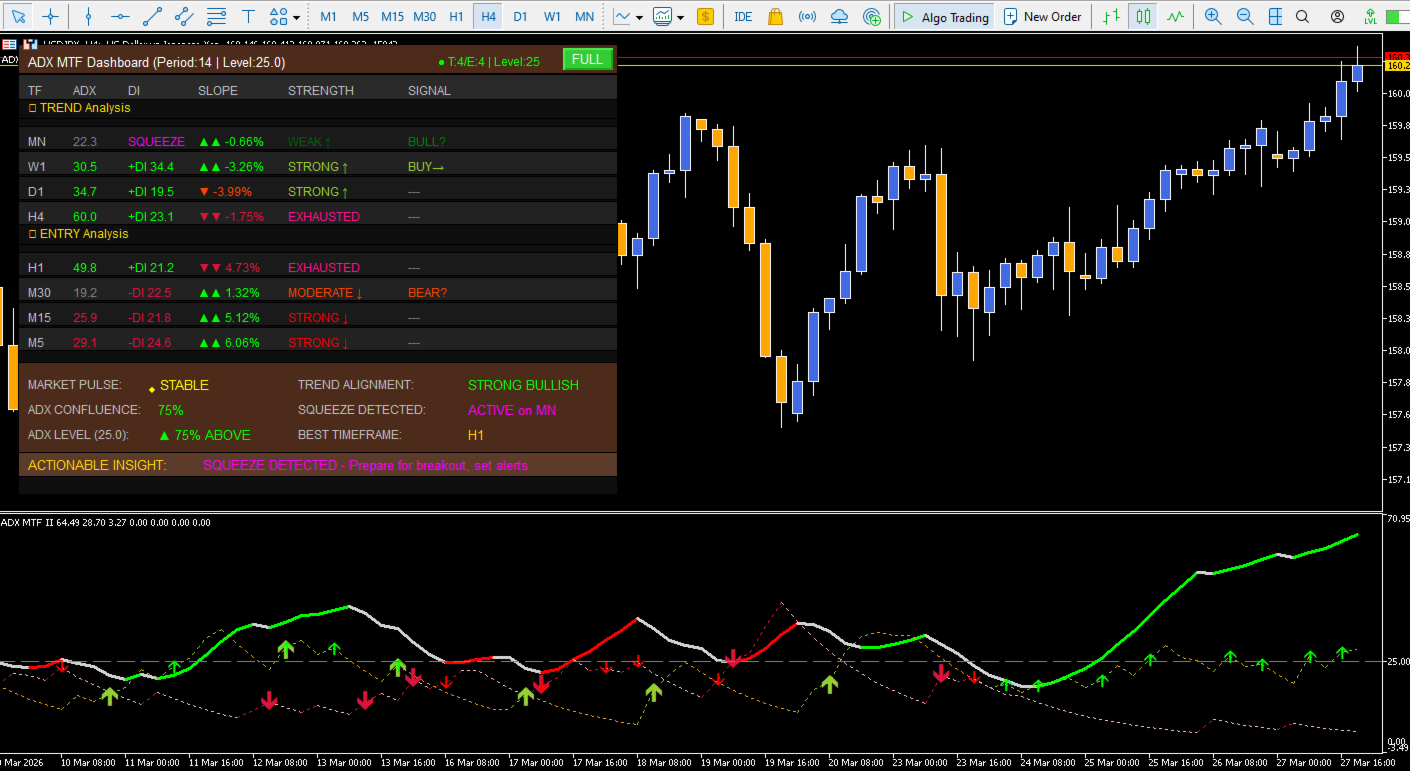
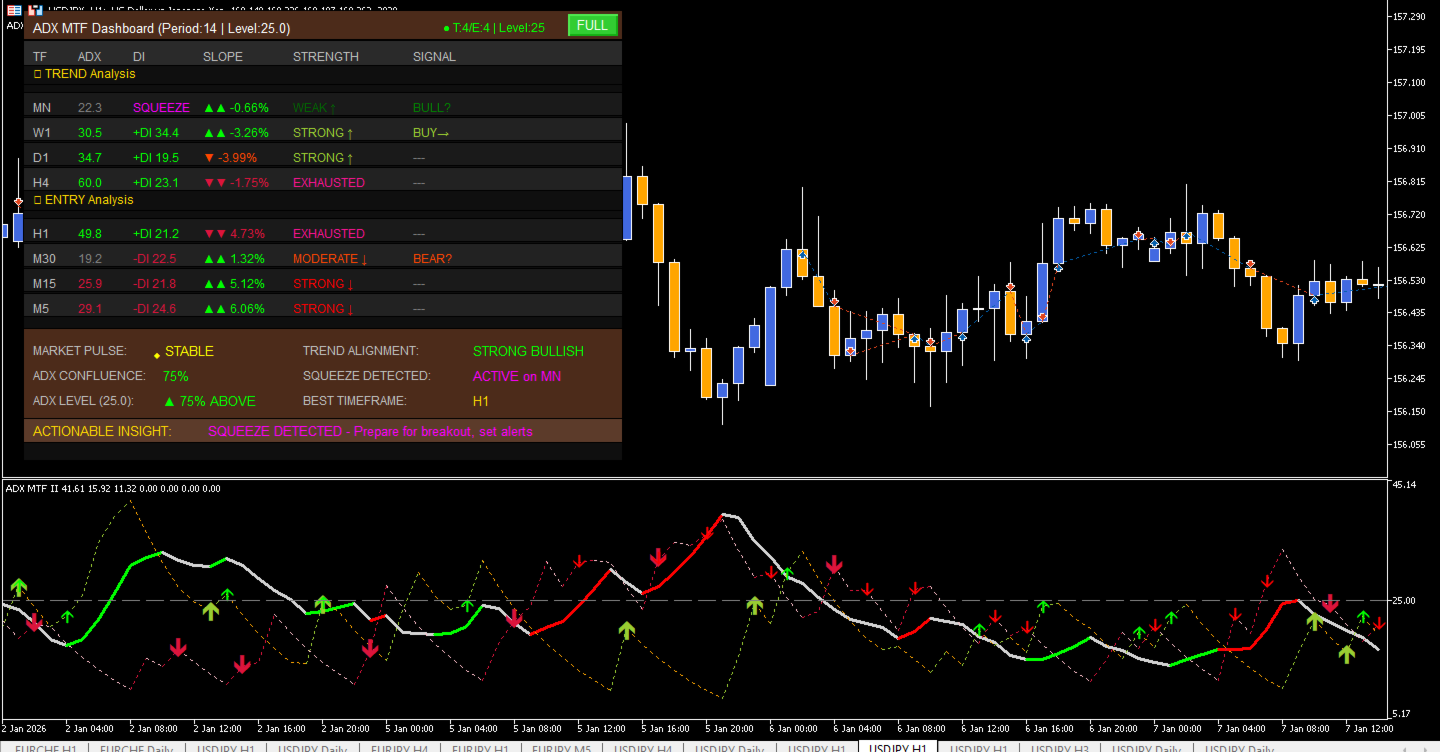
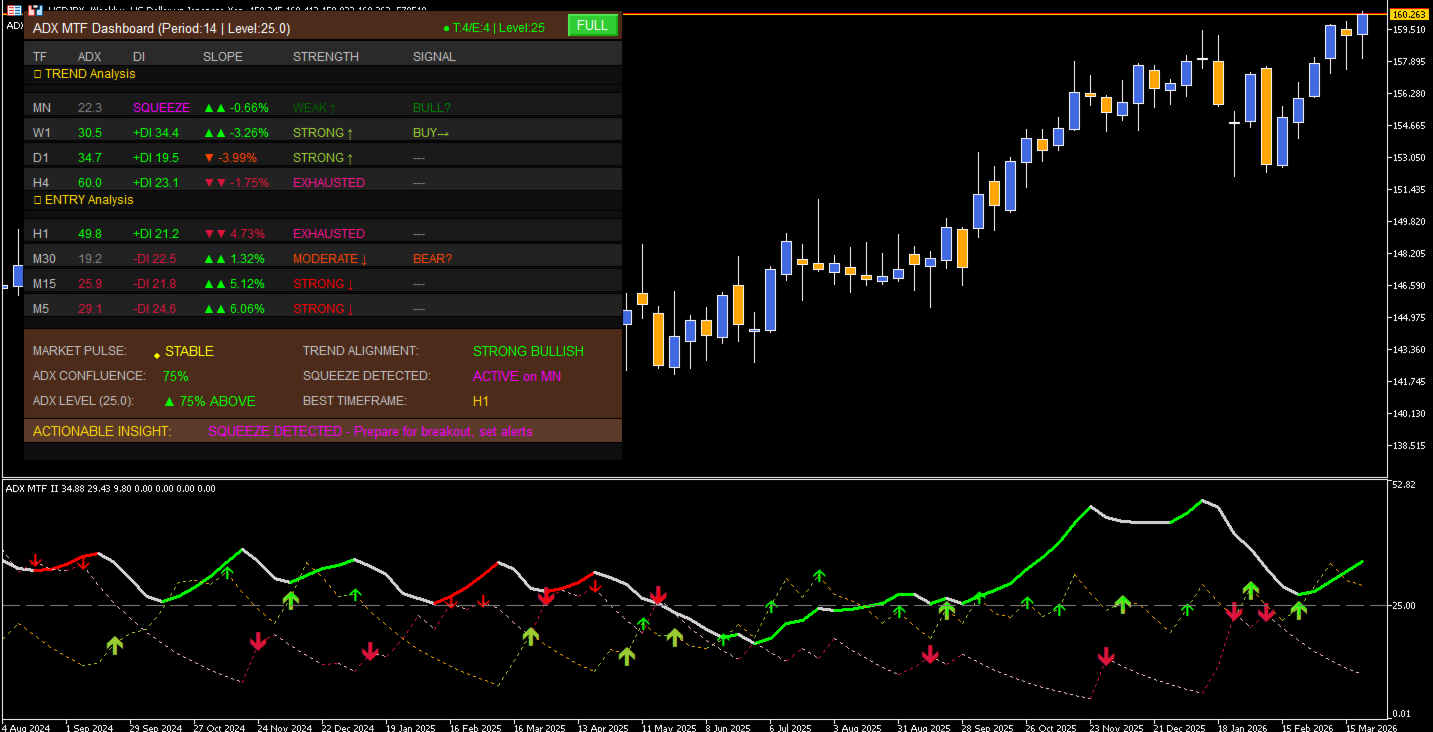
In a market where different timeframes tell different stories, this tool gives you the complete narrative at a single glance. By displaying up to 4 higher timeframes (Trend Panel) and 4 lower timeframes (Entry Panel), it answers the most critical trading question: "What do all timeframes agree on?"

How Key Trading Questions are Answered:

Question How ADX MTF Dashboard Answers It
What is the Trend Structure? Instantly see Bullish, Bearish, or Neutral across all timeframes via color-coded ADX values and directional arrows (↑/↓)
Where is the Best Entry? Watch for DI Cross and Slope Turn arrows on lower timeframes, confirmed by higher timeframe alignment
How Strong is the Signal? The Trend Strength column (0-100%) tells you exactly how much fuel the trend has
When is Momentum Shifting? The customizable ADX Level Line alerts you the moment ADX crosses above or below your threshold on ANY timeframe
What should I do NOW? The Actionable Insight panel tells you exactly what to do: "BTD: H4 Bullish, M15 Pullback" or "SQUEEZE DETECTED"
Is the market squeezing? Magenta "SQUEEZE" indicators warn you when DI lines converge — prepare for explosive breakouts

Professional Features and Edge

Multi-Timeframe Architecture

  • Dual Panel Design: Trend Panel (higher timeframes) for directional bias + Entry Panel (lower timeframes) for precision entries

  • Up to 8 Customizable Timeframes: Configure MN1, W1, D1, H4 for trend; H1, M30, M15, M5 for entries — or any combination

  • Smart Column Layout: Single header row applies to ALL timeframes — clean, compact, professional

Intelligent Slope Analysis (4-State Gradient-Awareness)

  • ▲▲ Strong Rising (Lime): Aggressive momentum, highest confidence

  • ▲ Weak Rising (YellowGreen): Trend gaining strength

  • ▼ Weak Falling (OrangeRed): Trend losing momentum

  • ▼▼ Strong Falling (Crimson): Aggressive reversal, highest confidence for shorts

  • ■ Neutral (Gray): No clear slope — wait for confirmation

DI Squeeze Detection

  • Magenta "SQUEEZE" indicator when |+DI - -DI| < 5 — warns you of impending breakouts

  • Works across all timeframes in the dashboard

  • Perfect for volatility contraction patterns

Customizable ADX Level Line

  • Set your own momentum threshold (default 25) with fully adjustable color, style, and width

  • Visualize exactly when ADX enters or exits the trending zone on EVERY timeframe

  • ADX values automatically highlight (Lime/Crimson) when above level for instant recognition

Intelligent Cross-Level Alerts

  • Per-Timeframe Alerts: Receive notifications when ANY timeframe crosses above or below your custom level

  • Multi-Timeframe Confluence Alerts: Get notified when 70%+ of timeframes are above the level — strong momentum confirmation

  • Critical for both trend entry identification and trend exhaustion detection

Market Pulse & Trend Alignment

  • Market Pulse: Shows overall acceleration/deceleration across all timeframes (▲ ACCELERATING / ▼ DECELERATING / ◆ STABLE)

  • ADX Confluence: Percentage of timeframes with ADX above your custom level

  • Best Timeframe: Automatically identifies the strongest trending timeframe for trade execution

Actionable Insights Engine

  • "BTD" (Buy The Dip): H4 Bullish, M15 Pullback detected

  • "STW" (Sell The Weakness): H4 Bearish, M15 Pullback detected

  • "SQUEEZE DETECTED": Prepare for breakout

  • "EXHAUSTION WARNING": Consider taking profits

Three-State Dashboard Toggle

  • FULL (Green): Complete dashboard with all panels and summary

  • ALERTS (Orange): Minimal panel, full alert functionality, reduced resource usage

  • OFF (Gray): Completely hidden — perfect for when you just need the main chart

Intelligent Resource Management

  • Optimized MQL5 code with configurable update rates (500ms default)

  • FetchAllMTFData() only runs when needed, not every tick

  • Minimal overhead even on charts with 20+ pairs

Comprehensive Alert System

Never miss a move with Popup, Push (Mobile), and Email notifications for:

  • DI Cross signals — per timeframe

  • Slope Turn signals — per timeframe

  • ADX Color changes — per timeframe

  • ADX Level Cross events — per timeframe AND multi-timeframe confluence

  • Squeeze Detection — when DI lines converge

  • Trend Alignment — when 80%+ of timeframes agree

Simple Configuration

Pro-level logic wrapped in a user-friendly interface. Set your:

  • ADX Period (default 14)

  • ADX Level (default 25)

  • Slope Sensitivity (1=most responsive, 10=smoothest)

  • Slope Method (Simple/Percent/Linear/SMA Ratio)

  • Trend and Entry timeframes

  • Dashboard position and update rate

  • Alert preferences

 Signal Hierarchy & Confidence

Use this hierarchy to scale your position size with confidence:

TIER 1 (Highest Confidence)

  • ADX > Custom Level on 2+ higher timeframes

  • ADX Color Match across trend and entry panels

  • DI Cross Arrow on entry timeframe

  • Slope Arrow aligns with higher timeframe trend

  • Confluence > 70% of timeframes above level

TIER 2 (Trend Following)

  • ADX is rising across multiple timeframes

  • Slope Arrow appears in direction of higher timeframe trend

  • Strength Score > 50 on the entry timeframe

TIER 3 (Early Warning)

  • Slope Arrow appears while ADX is still below your custom level

  • Squeeze detected — potential breakout alert before momentum fully develops

  • Market Pulse shows ACCELERATING

TIER 4 (Trend Exhaustion)

  • ADX crosses back below your custom level on 2+ timeframes

  • Slope State changes from ▲▲/▲ to ▼/▼▼

  • Market Pulse shows DECELERATING

  • Powerful signal to tighten stops or exit positions

Risk Management and Exit Logic

Filtering Low-Probability Trades

The TrendFilter input hides signals in choppy markets where ADX is too weak to support a move. Combined with the ADX Level Line, you only get signals when momentum is meaningful.

Strategic Entry & Exit

Use the customizable ADX Level Line to define clear trending vs. ranging market regimes:

  • Entry only when 2+ timeframes have ADX above your threshold

  • Exit or tighten stops when ADX falls back below on higher timeframes

Visual Trend State

The ADX Flat/Weak (Gray) color change immediately alerts you to trend exhaustion. Combined with the Strength column (0-100), you can see exactly when momentum is fading.

Multi-Timeframe Stop Placement

  • Use higher timeframe Slope-Turn lows/highs as logical, data-driven anchors for your stop-loss

  • The dashboard shows you where key levels exist across all timeframes

 EA and Automation Ready

Built for developers. Every visual signal is stored in accessible double buffers, making it "Plug-and-Play" for Expert Advisors.

Buffer Signal Description
Buffer 6 DI Cross BUY +DI crosses above -DI with ADX ≥ TrendFilter
Buffer 7 DI Cross SELL -DI crosses above +DI with ADX ≥ TrendFilter
Buffer 8 Slope BUY +DI slope turns up (with optional filtering)
Buffer 9 Slope SELL -DI slope turns up (with optional filtering)
Buffer 1 Trend State 0=Bullish, 1=Bearish, 2=Neutral

Sophisticated logic ensures no repainting — what you see on the chart is what your EA sees.

The Bottom Line

Don't trade in isolation. Know what every timeframe is telling you before you put your capital at risk. With the customizable ADX Level Line, cross alerts, and multi-timeframe confluence detection, you now have a crystal-clear view of when momentum is worth trading — and when it's time to step aside.

Whether you are a trend follower, a breakout scalper, or a multi-timeframe analyst, ADX ClrDynamic MTF Dashboard gives you the clarity to trade with confidence across all time horizons.

Master the Trend Across All Timeframes. Capture the Momentum with Precision. Trade with Complete Awareness.

Keywords:

ADX Indicator, Multi-Timeframe, MTF Dashboard, Hull Moving Average, Trend Strength, Momentum Trading, DI Cross, Low Lag ADX, Trading Signals, MT5 Alerts, Trend Filter, Forex Strategy, Scalping Tool, ADX Level, Momentum Threshold, Trend Exhaustion, Breakout Detection, Squeeze Detection, Market Pulse, Trend Alignment, Actionable Insights, Trading Dashboard.


추천 제품
"Impulses and Corrections 5" is created to help traders navigate the market situation. The indicator shows multi-time frame upward and downward "Impulses" of price movements. These impulses are the basis for determining the "Base" , which is composed of zones of corrections of price movements, as well as "Potential" zones for possible scenarios of price movement. Up and down impulses are determined based on a modified formula of Bill Williams' "Fractals" indicator. The last impulse is always "U
RBreaker
Zhong Long Wu
RBreaker Gold Indicators는 금 선물을 위한 단기 데이 트레이딩 전략으로, 추세 추종과 데이 내 반전의 두 가지 거래 방식을 결합합니다. 추세 장에서 수익을 포착할 수 있을 뿐만 아니라, 시장이 반전될 때 적시에 이익을 확정하고 추세에 맞춰 반대 포지션을 잡을 수 있습니다. 이 전략은 미국 잡지 Futures Truth에서 15년 연속으로 가장 수익성 높은 트레이딩 전략 상위 10위 안에 선정되었습니다. 긴 라이프사이클을 자랑하며, 현재까지 국내외에서 널리 사용되고 연구되고 있습니다. 본 지표는 2026년 금 선물의 움직임을 반영하여 14일 ATR 지표를 기반으로 돌파 계수 A, 관찰 계수 B, 반전 계수 R을 보다 합리적인 값으로 정의했습니다. 매우 훌륭한 지표이며, 안정적인 연간 수익성을 달성했습니다. 강력히 추천합니다~ 위 지표는 변동성이 높은 상품에 적합하며, 매개변수는 금 선물, 주가 지수 선물 등에 적합합니다. 다른 상품이 필요한 경우 돌파 계수 A
PipFinite Trend PRO MT5
Karlo Wilson Vendiola
4.84 (557)
Breakthrough Solution For Trend Trading And Filtering With All Important Features Built Inside One Tool! Trend PRO's smart algorithm detects the trend, filters out market noise and gives entry signals with exit levels. The new features with enhanced rules for statistical calculation improved the overall performance of this indicator. Important Information Revealed Maximize the potential of Trend Pro, please visit www.mql5.com/en/blogs/post/713938 The Powerful Expert Advisor Version Automatin
TRI Visualizer
Yoshimi Mon 三 Ura
TRI Visualizer MT5 – Thermodynamic Market Analysis Overview The TRI (Thermal Range Indicator) Visualizer Enhanced is a rare market analysis indicator that goes beyond conventional technical analysis, applying principles of thermodynamics from physics. It interprets market price fluctuations as “thermodynamic energy,” enabling the highly accurate detection of subtle market changes that are often overlooked. Innovative Mechanisms 1. Dual Calculation Engines Classic TRI Mode Formula: |Close
Noize Absorption Index
Ekaterina Saltykova
Noize Absorption Index - is the manual trading system that measures the difference of pressure between bears forces and bulls forces. Green line - is a noize free index that showing curent situation. Zero value of index shows totally choppy/flat market.Values above zero level shows how powerfull bullish wave is and values below zero measures bearish forces.Up arrow appears on bearish market when it's ready to reverse, dn arrow appears on weak bullish market, as a result of reverse expectation.
Maximum Trend Arrows OT MT5
Mulweli Valdaz Makulana
STRICTLY FOR BOOM INDEX ONLY!!!!! Here I bring the Maximum Trend Arrows OT1.0 MT5 indicator. This indicator is made up of a combination of different trend indicators for entries and exits, for entries an orange arrow will paint on the chart below the current market and a red flag for closing of trades and it produces buy arrows only. When the orange arrow appears, it will appear along with it's sound to notify you. The 1H timeframe is recommended, don't use it anywhere else than on the 1H timefr
# DRAWDOWN INDICATOR V4.0 - The Essential Tool to Master Your Trading ## Transform Your Trading with a Complete Real-Time Performance Overview In the demanding world of Forex and CFD trading, **knowing your real-time performance** isn't a luxury—it's an **absolute necessity**. The **Drawdown Indicator V4.0** is much more than a simple indicator: it's your **professional dashboard** that gives you a clear, precise, and instant view of your trading account status. --- ## Why This Indicator
CosmiCLab FIBO
Kirils Subins
CosmiCLab SMC FIBO CosmiCLab SMC FIBO is a professional trading indicator designed for traders who use Smart Money Concepts (SMC), market structure analysis and Fibonacci retracement levels. The indicator automatically detects market swings and builds Fibonacci levels based on the latest impulse movement. It also identifies market structure changes such as BOS (Break of Structure) and CHOCH (Change of Character), helping traders understand the current market direction. CosmiCLab SMC FIBO also pr
우선적으로, 이 거래 도구는 전문적인 거래에 이상적인 비-다시 그리기 및 지연되지 않는 지표입니다.  온라인 강좌, 사용자 매뉴얼 및 데모. 스마트 가격 액션 컨셉트 인디케이터는 신규 및 경험 많은 트레이더 모두에게 매우 강력한 도구입니다. Inner Circle Trader Analysis 및 Smart Money Concepts Trading Strategies와 같은 고급 거래 아이디어를 결합하여 20가지 이상의 유용한 지표를 하나로 결합합니다. 이 인디케이터는 스마트 머니 컨셉트에 중점을 두어 대형 기관의 거래 방식을 제공하고 이동을 예측하는 데 도움을 줍니다.  특히 유동성 분석에 뛰어나 기관이 어떻게 거래하는지 이해하는 데 도움을 줍니다. 시장 트렌드를 예측하고 가격 변동을 신중하게 분석하는 데 탁월합니다. 귀하의 거래를 기관 전략에 맞추어 시장의 동향에 대해 더 정확한 예측을 할 수 있습니다. 이 인디케이터는 시장 구조를 분석하고 중요한 주문 블록을 식별하고 다양
Trend Master V2
Oratile Pitsoane
What Is Trend Master Pro? Trend Master Pro   is a professional-grade trend trading indicator built for MetaTrader 5. It was designed with one goal in mind — to keep you on the right side of the market at all times by combining three powerful technical tools into a single, clean, easy-to-read display directly on your price chart. Instead of cluttering your screen with multiple separate indicators, Trend Master Pro fuses an   EMA Ribbon trend filter , a   ZigZag swing point engine , and a   breako
An indicator of pattern #31 ("Long Island") from Encyclopedia of Chart Patterns by Thomas N. Bulkowski. The second gap is in the opposite direction. Parameters: Alerts - show alert when an arrow appears   Push - send a push notification when an arrow appears (requires configuration in the terminal) GapSize - minimum gap size in points ArrowType - a symbol from 1 to 17 ArrowVShift - vertical shift of arrows in points   ShowLevels - show levels ColUp - color of an upward line ColDn - color of a d
WaveTrend Oscillator MT5는 모멘텀 변화와 잠재적인 추세 반전을 식별하여 시장 분석을 향상시키기 위해 설계된 강력한 거래 지표입니다. 모든 수준의 트레이더에게 이상적인 이 도구는 forex, 암호화폐 및 상품을 포함한 다양한 시장에서 과매수 및 과매도 조건에 대한 귀중한 통찰력을 제공합니다. 정확한 매수 및 매도 신호를 생성할 수 있는 능력을 갖춘 WaveTrend Oscillator MT5는 트레이더가 정보에 기반한 결정을 내릴 수 있도록 하여 단기 및 장기 거래 전략 모두에서 성공 확률을 효과적으로 높입니다. MQL 제품 설치 가이드 | MT4/MT5에서 구매한 MQL 제품 업데이트 | 일반 문제 해결 가이드 | 지표 설정 / 가이드 주요 기능 버퍼 통합: 신호 기반 거래 전략을 활용할 수 있도록 지표 값을 접근 가능한 버퍼로 노출합니다. 빠르고 백테스트 가능: MetaTrader의 기본 OnCalculate() 엔진을 기반으로 구축되어 빠른 계산과 전략 테스터
Has rsi signal
Evgenii Savinov
HAS RSI Signal — SL/TP 자동 계산 기능이 포함된 전문 트렌드 지표 HAS RSI Signal 은 검증된 클래식 지표와 현대적인 노이즈 필터링 알고리즘을 결합한 강력한 트레이딩 도구입니다. 이 지표는 Heiken Ashi Smoothed (HAS) 캔들과 RSI 오실레이터를 통해 시장을 분석하며, 추세 반전이나 과매수/과매도 구간 이탈 시 트레이더에게 명확한 진입 신호를 제공합니다. 주요 장점: 이중 필터링: Heiken Ashi Smoothed를 사용하여 시장의 '노이즈'를 제거하고, RSI를 통해 모멘텀의 강도를 확인합니다. 자동 레벨 계산: 단순히 신호만 주는 것이 아니라, 변동성( ATR )을 기반으로 최적의 손절매(Stop Loss) 및 이익 실현(Take Profit) 레벨을 자동으로 계산합니다. 시각적 편의성: 신호가 차트 위에 컬러 캔들 형태로 직접 표시되어 복잡하지 않고 직관적으로 추세를 파악할 수 있습니다. 알림 시스템: 터미널 알람, 사운드, 스마
Cumulative Delta NG
Anton Polkovnikov
Cumulative delta indicator As most traders believe, the price moves under the pressure of market buying or selling. When someone redeems an offer standing in the cup, the deal is a "buy". If someone pours into the bid standing in the cup - the deal goes with the direction of "sale". The delta is the difference between purchases and sales. A cumulative delta - the difference between the cumulative sum of purchases and sales for a certain period of time. It allows you to see who is currently contr
Trend Monitor MT5
Pavel Zamoshnikov
4.5 (2)
The indicator generates early signals basing on ADX reading data combined with elements of price patterns. Works on all symbols and timeframes. The indicator does not redraw its signals. You see the same things on history and in real time. For better visual perception signals are displayed as arrows (in order not to overload the chart). Features The best results are obtained when the indicator works on two timeframes. For example: M30 – the indicator shows the main trend; M5 – the indicator gen
Trade smarter, not harder: Empower your trading with Harmonacci Patterns This is arguably the most complete harmonic price formation auto-recognition indicator you can find for the MetaTrader Platform. It detects 19 different patterns, takes fibonacci projections as seriously as you do, displays the Potential Reversal Zone (PRZ) and finds suitable stop-loss and take-profit levels. [ Installation Guide | Update Guide | Troubleshooting | FAQ | All Products  ] It detects 19 different harmonic pric
Heiken Ashi Smoothed Strategy is a very simple but powerful system to get forex market trend direction. This indicator is actually 2 indicators in 1 pack, Heiken Ashi and Heiken Ashi Smoothed Moving Average both included. Because HA (Heiken Ashi) and HAS (Heiken Ashi Smoothed) are calculated in the same one system event with necessary buffers and loop only, so it is the FAST, OPTIMIZED and EFFICIENT HA having the combined indicator of MetaTrader 5. You can choose to display HA and HAS in the sam
HMA Trend Professional MT5
Pavel Zamoshnikov
4.25 (4)
Improved version of the free HMA Trend indicator (for MetaTrader 4) with statistical analysis. HMA Trend is a trend indicator based on the Hull Moving Average (HMA) with two periods. HMA with a slow period identifies the trend, while HMA with a fast period determines the short-term movements and signals in the trend direction. The main differences from the free version: Ability to predict the probability of a trend reversal using analysis of history data. Plotting statistical charts for analyzi
The RSI Divergence + FVG Signal indicator combines Relative Strength Index (RSI) Divergence with Fair Value Gap (FVG) detection to generate high-probability buy and sell signals based on both momentum shifts and institutional imbalance zones. Core Features: RSI Divergence Detection : Identifies both regular and hidden bullish/bearish divergences between price and RSI. Divergences indicate potential trend reversals or continuation. FVG Zone Recognition : Detects Fair Value Gaps (imbalances caused
Ichimoku Aiko MTF
Michael Jonah Randriamampionontsoa
Ichimoku Aiko MTF is a collection of technical indicators that show support and resistance levels, as well as momentum and trend direction. It is a multi-timeframe indicator so you don't need to change the chart timeframe when you want to see the ichimoku clouds on a higher timeframe.  eg. The chart timeframe is M15 and you want to see on the M15 timeframe chart the H1 ichimoku indicators (the ichimoku in Metatrader can't do that) that's why you need to use Ichimoku Aiko MTF.
Introduction The "Two Moving Average Crossover" indicator for MetaTrader 5 (MT5) is a technical analysis tool that displays two moving averages and notifies when the moving averages cross each other. The indicator calculates and plots two moving averages, one of which is faster and the other is slower. When the faster moving average crosses above the slower moving average, it is considered a bullish signal, indicating a potential trend reversal or the start of a new uptrend. Conversely, when th
Stratos Pali mt5
Michela Russo
4.5 (8)
Stratos Pali Indicator is a revolutionary tool designed to enhance your trading strategy by accurately identifying market trends. This sophisticated indicator uses a unique algorithm to generate a complete histogram, which records when the trend is Long or Short. When a trend reversal occurs, an arrow appears, indicating the new direction of the trend. Important Information Revealed Leave a review and contact me via mql5 message to receive My Top 5 set files for Stratos Pali at no cost ! Down
Trend Wave MT5
Mehrnaz Eshaghzadehal
The Trend Wave indicator for MetaTrader 5 ( MT5 ) is a reliable tool designed to help traders effectively identify market trends and potential reversals . By utilizing oscillating wave patterns, this indicator provides clear visual signals, enabling traders to capitalize on price movements . Whether you are a day trader or a swing trader , this indicator is a versatile addition to your trading toolkit, simplifying complex market analysis.
Trend Reversal Scanner MT5
Reza Aghajanpour
5 (8)
**   All Symbols   x   All Timeframes   scan just by pressing scanner button ** Discount: The price is $50$, But now it is just $39, Limited time offer is active. *** Contact me  to send you instruction and add you in "Trend Reversal group" for sharing or seeing experiences with other users. Introduction: Trendlines are the most famous technical analysis in trading . Trendlines continually form on the charts of markets across all the different timeframes providing huge opportunities for traders
Premium level Pro
Dmitriy Kashevich
Premium level is a unique indicator with more than 80% accuracy of correct predictions! This indicator has been tested for more than two months by the best Trading Specialists! The author's indicator you will not find anywhere else! From the screenshots you can see for yourself the accuracy of this tool! 1 is great for trading binary options with an expiration time of 1 candle. 2 works on all currency pairs, stocks, commodities, cryptocurrencies Instructions: As soon as the red arrow app
This MT5 version indicator is a unique, high quality and affordable trading tool. The calculation is made according to the author's formula for the beginning of a possible trend. MT4 version is here  https://www.mql5.com/ru/market/product/98041 An accurate   MT5   indicator that gives signals to enter trades without redrawing! Ideal trade entry points for currencies, cryptocurrencies, metals, stocks, indices! The indicator builds   buy/sell   arrows and generates an alert. Use the standart   B
Terra Infinity
Ivan Simonika
Terra Infinity is a flat indicator. This improved version of the CalcFlat indicator has three additional lines that significantly increase its effectiveness. Unlike its predecessor with two static levels, Terra Infinity adds three dynamic lines above the main histogram, which are interpreted as follows: base signal line, minimum signal line, maximum signal line. These lines are formed using the additional parameter Avg, which is the average value of the histogram. Averaging produces a line cl
Fibo Channels
Jeffrey Quiatchon
Fibo Daily Channel Indicator The  Indicator is a powerful tool for traders, providing precise daily support and resistance levels based on Fibonacci retracement and extension calculations. This indicator automatically draws key pivot points (PP, R1, R2, S1, S2) as well as additional extension levels (R3, R4, S3, S4), helping traders identify potential reversal and breakout zones with ease. It includes customizable alerts and push notifications, allowing traders to receive updates whenever the pr
##   ONLY GOLD ##   Тiльки Золото ## **Mercaria Professional Trading Zones - Complete Guide** ## **Mercaria Professional Trading Zones - Повний посібник** ### **How Mercaria Zones Work / Як працюють зони Mercaria** **English:** Mercaria Zones is an advanced trading indicator that identifies high-probability support and resistance areas using ZigZag extremes combined with mathematical zone calculations. The indicator works on multiple timeframes simultaneously, providing a comprehensive view
DAILY OH/OL SDEV QUANT MODEL - STATISTICAL TRADING WITH PRECISION RISK MANAGEMENT TRADE WITH MATHEMATICAL CERTAINTY - KNOW YOUR EXACT STOP-LOSS AND TAKE-PROFIT BEFORE YOU ENTER This indicator analyzes 5,000+ days of price history to give you: Exact entry levels (sigma bands locked at daily open) Exact stop-loss distance (from M
이 제품의 구매자들이 또한 구매함
Divergence Bomber
Ihor Otkydach
4.9 (89)
이 지표를 구매하신 분께는 다음과 같은 혜택이 무료로 제공됩니다: 각 거래를 자동으로 관리하고, 손절/익절 수준을 설정하며, 전략 규칙에 따라 거래를 종료하는 전용 도우미 툴 "Bomber Utility" 다양한 자산에 맞게 지표를 설정할 수 있는 셋업 파일(Set Files) "최소 위험", "균형 잡힌 위험", "관망 전략" 모드로 설정 가능한 Bomber Utility의 셋업 파일 이 전략을 빠르게 설치, 설정, 시작할 수 있도록 돕는 단계별 영상 매뉴얼 주의: 위의 모든 보너스를 받기 위해서는 MQL5 개인 메시지 시스템을 통해 판매자에게 연락해 주세요. 독창적인 커스텀 지표인 “Divergence Bomber(다이버전스 봄버)”를 소개합니다. 이 지표는 MACD 다이버전스(괴리) 전략을 기반으로 한 올인원(All-in-One) 거래 시스템입니다. 이 기술 지표의 주요 목적은 가격과 MACD 지표 간의 다이버전스를 감지하고, **향후 가격이 어느 방향으로 움직일지를 알려주는
SignalTech MT5
Yue Wang
5 (21)
SignalTech MT5 is a fully rule based trading system for EURUSD, USDCHF, USDJPY, AUDUSD, NZDUSD, EURJPY, AUDJPY, NZDJPY, CADJPY.  All the winning trades with chart setups are published on the comments page. 2025-12 1174 Pips 2026-01 2624 Pips 2026-02 2937 Pips 2026-03 2165 Pips 2026-04 2243 Pips It can generate signals with Buy/Sell Arrows and Pop-Up/Sound Alerts. Each signal has clear Entry and Stop Loss levels, which should be automatically flagged on the chart, as well as potential Targets 1,
소개       Quantum Breakout PRO   , 브레이크아웃 존 거래 방식을 변화시키는 획기적인 MQL5 지표! 13년 이상의 거래 경험을 가진 숙련된 트레이더 팀이 개발한       퀀텀 브레이크아웃 PRO       혁신적이고 역동적인 브레이크아웃 존 전략으로 거래 여정을 새로운 차원으로 끌어올리도록 설계되었습니다. Quantum Breakout Indicator는 5개의 이익 목표 영역이 있는 브레이크아웃 영역의 신호 화살표와 브레이크아웃 상자를 기반으로 한 손절 제안을 제공합니다. 초보자 거래자와 전문 거래자 모두에게 적합합니다. Quantum EA 채널:       여기를 클릭하세요 중요한! 구매 후 설치 매뉴얼을 받으려면 개인 메시지를 보내주십시오. 추천: 기간: M15 통화쌍: GBPJPY, EURJPY, USDJPY,NZDUSD, XAUUSD 계정 유형: 스프레드가 매우 낮은 ECN, Raw 또는 Razor 브로커 시간: GMT +3 중개인 :
RelicusRoad Pro MT5
Relicus LLC
4.96 (24)
RelicusRoad Pro: 퀀트 시장 운영 체제 70% 할인 평생 이용권 (한정 시간) - 2,000명 이상의 트레이더와 함께하세요 왜 대부분의 트레이더는 "완벽한" 지표를 가지고도 실패할까요? 진공 상태에서 단일 개념 만으로 거래하기 때문입니다. 문맥 없는 신호는 도박입니다. 지속적인 승리를 위해서는 컨플루언스(중첩) 가 필요합니다. RelicusRoad Pro는 단순한 화살표 지표가 아닙니다. 완전한 퀀트 시장 생태계 입니다. 독점적인 변동성 모델링을 사용하여 가격이 이동하는 "공정 가치 로드"를 매핑하고, 단순 노이즈와 실제 구조적 돌파를 구분합니다. 추측은 그만두세요. 기관급 로드 로직으로 거래를 시작하세요. 핵심 엔진: "Road" 알고리즘 시스템의 중심에는 시장 상황에 실시간으로 적응하는 동적 변동성 채널인 Road Algo 가 있습니다. 세이프 라인(평형) 과 가격이 수학적으로 반전될 가능성이 높은 확장 레벨 을 투영합니다. Simple Road: 일반적인 시장을 위
MetaTrader 5용 스마트 다층 브레이크아웃 및 풀백 탐지기 "스마트하고, 간단하고, 빠르게!" 고확률 브레이크아웃 진입을 놓치는 것에 지치셨나요? 여러 차트를 몇 시간씩 스캔하면서 브레이크아웃을 추세 방향과 통화 모멘텀에 맞추려고 하지만 — 결국 움직임을 놓치고 마나요? Break Pullback은 하나의 지표로 이 모든 문제를 해결합니다. Break Pullback이란 무엇인가요? Break Pullback은 시장 구조, 브레이크아웃, 추세 지속 설정을 거래하는 트레이더를 위해 특별히 설계된 전문가급 MetaTrader 5 지표입니다. 실시간으로 여러 통화 쌍에 걸쳐 Break와 Pullback 형성을 자동으로 감지하고 — 세 가지 확인 레이어를 통해 모든 신호를 필터링합니다: 구조적 브레이크아웃 탐지 — 차트의 주요 브레이크 레벨 식별 HTF 일봉 바이어스 — 진입을 지배적인 일봉 추세 방향에 맞춤 통화 강도 지수 — 쌍을 이룬 통화 간의 모멘텀 불균형 확인 결과: 오
Azimuth Pro
Ottaviano De Cicco
5 (7)
Azimuth Pro V2: Synthetic Fractal Structure and Confirmed Entries for MT5 Overview Azimuth Pro is a multi-level swing structure indicator by Merkava Labs . Four nested swing layers, swing-anchored VWAP, ABC pattern detection, three-timeframe structural filtering, and closed-bar confirmed entries — one chart, one workflow from micro-swings to macro-cycles. This is not a blind signal product. It is a structure-first workflow for traders who care about location, context, and timing. V2 Launch Offe
Quantum TrendPulse
Bogdan Ion Puscasu
5 (25)
SuperTrend   ,   RSI   ,   Stochastic   의 힘을 하나의 포괄적인 지표로 결합하여 트레이딩 잠재력을 극대화하는 궁극의 트레이딩 도구   인 Quantum TrendPulse를   소개합니다. 정밀성과 효율성을 추구하는 트레이더를 위해 설계된 이 지표는 시장 추세, 모멘텀 변화, 최적의 진입 및 종료 지점을 자신 있게 식별하는 데 도움이 됩니다. 주요 특징: SuperTrend 통합:   주요 시장 추세를 쉽게 따라가고 수익성의 물결을 타세요. RSI 정밀도:   매수 과다 및 매도 과다 수준을 감지하여 시장 반전 시점을 파악하는 데 적합하며 SuperTrend 필터로 사용 가능 확률적 정확도:   변동성이 큰 시장에서 숨겨진 기회를 찾기 위해 확률적 진동   을 활용하고 SuperTrend의 필터로 사용 다중 시간대 분석:   M5부터 H1 또는 H4까지 다양한 시간대에 걸쳐 시장을 최신 상태로 유지하세요. 맞춤형 알림:   맞춤형 거래 조건이 충족되면
Btmm state engine pro
Garry James Goodchild
5 (4)
BTMM State Engine Pro is a MetaTrader 5 indicator for traders who use the Beat The Market Maker approach: Asian session context, kill zone timing, level progression, peak formation detection, and a multi-pair scanner from a single chart. It combines cycle state logic with a built-in scanner dashboard so you do not need the same tool on many charts at once. What it does Draws the Asian session range; session times can follow broker server offset or be set in inputs. Tracks level progression (L
KT Alpha Hunter Arrows MT5
KEENBASE SOFTWARE SOLUTIONS
대부분의 화살표 인디케이터는 신호만 보여주고, 나머지 판단은 모두 트레이더에게 맡깁니다. KT Alpha Hunter Arrows는 완성된 트레이딩 플랜을 제공합니다. 각 신호 화살표가 표시될 때마다 진입선, 손절선, 네 개의 익절 목표, 그리고 현재 심볼과 시간대가 지금 거래할 가치가 있는지 알려주는 실시간 엣지 판정이 함께 그려집니다. 포함된 Trade Manager EA는 사용자가 직접 진입한 뒤의 실행 관리를 맡아, 시장이 흔들리고 감정이 개입되기 쉬운 상황에서도 거래 원칙을 유지할 수 있도록 도와줍니다. 리페인트 없음. 종가 확정 후 신호만 표시. Forex, Gold, Indices 및 사용자가 거래하는 다양한 MT5 지원 상품에 맞게 설계되었습니다. 주요 기능 캔들이 마감된 후에만 표시되는 리페인트 없는 매수 및 매도 화살표. 각 신호마다 진입선, 구조적 손절선, 네 개의 익절 목표 표시. 현재 차트에서 매수와 매도 셋업을 별도로 평가하는 Edge Dashboard.
Grabber System MT5
Ihor Otkydach
4.83 (23)
탁월한 기술적 지표인 Grabber를 소개합니다. 이 도구는 즉시 사용 가능한 “올인원(All-Inclusive)” 트레이딩 전략으로 작동합니다. 하나의 코드 안에 강력한 시장 기술 분석 도구, 매매 신호(화살표), 알림 기능, 푸시 알림이 통합되어 있습니다. 이 인디케이터를 구매하신 모든 분들께는 다음의 항목이 무료로 제공됩니다: Grabber 유틸리티: 오픈 포지션을 자동으로 관리하는 도구 단계별 영상 매뉴얼: 설치, 설정, 그리고 실제 거래 방법을 안내 맞춤형 세트 파일: 인디케이터를 빠르게 자동 설정하여 최고의 성과를 낼 수 있도록 도와줍니다 다른 전략은 이제 잊어버리세요! Grabber만이 여러분을 새로운 트레이딩의 정점으로 이끌어 줄 수 있습니다. Grabber 전략의 주요 특징: 거래 시간 프레임: M5부터 H4까지 거래 가능한 자산: 어떤 자산이든 사용 가능하지만, 제가 직접 테스트한 종목들을 추천드립니다 (GBPUSD, GBPCAD, GBPCHF, AUDCAD, AU
Entry Points Pro for MT5
Yury Orlov
4.48 (138)
다시 색을 칠하지 않고 거래에 진입할 수 있는 정확한 신호를 제공하는 MT5용 지표입니다. 외환, 암호화폐, 금속, 주식, 지수 등 모든 금융 자산에 적용할 수 있습니다. 매우 정확한 추정값을 제공하고 매수와 매도의 가장 좋은 시점을 알려줍니다. 하나의 시그널로 수익을 내는 지표의 예와 함께 비디오 (6:22)시청하십시오! 대부분의 거래자는 Entry Points Pro 지표의 도움으로 첫 거래 주 동안 트레이딩 결과를 개선합니다. 저희의   Telegram Group 을 구독하세요! Entry Points Pro 지표의 좋은점. 재도색이 없는 진입 신호 신호가 나타나고 확인되면(시그널 캔들이 완성된 경우) 신호는 더 이상 사라지지 않습니다. 여타 보조지표의 경우 신호를 표시한 다음 제거되기 때문에 큰 재정적 손실로 이어집니다. 오류 없는 거래 게시 알고리즘을 통해 트레이드(진입 또는 청산)를 할 이상적인 순간을 찾을 수 있으며, 이를 통해 이를 사용하는 모든 거래자의 성공률이
Meridian Pro
Ottaviano De Cicco
5 (2)
Meridian Pro 2.00: Professional Multi-Timeframe Trend Matrix for MT5 Meridian Pro 2.00 is a professional adaptive trend matrix for MetaTrader 5. It combines the original Meridian trend engine, a clean chart ribbon, closed-bar signal arrows, an 8-timeframe dashboard, Fuel momentum, weighted consensus, synthetic HTF processing and chart-native higher-timeframe context lines. The goal is simple: read current trend, multi-timeframe structure, strength, momentum and EA-ready state from one discipline
OrderFlux | MetaTrader 5용 풋프린트 오더플로우 버전 2.0 – 액티브 트레이더를 위한 실시간 Bid/Ask 시각화 OrderFlux는 MT5를 위한 풋프린트 및 오더플로우 지표입니다. 가격이 어디로 이동했는지뿐만 아니라, 그 움직임 내부에서 어떤 일이 발생하고 있는지(가격 수준별 Bid/Ask 거래량, 델타, 임밸런스, 거래량 분포)를 보여줍니다. 많은 차트가 캔들의 최종 결과만 보여줍니다. OrderFlux는 그곳에 도달하기까지의 과정을 보여줍니다. 이것이 바로 캔들 모양뿐만 아니라 시장 참여자들의 동향을 읽고자 할 때 정확히 도움이 되는 부분입니다. 라이브 차트에서 OrderFlux는 주로 다음 세 가지 질문에 답합니다: 현재 어디에서 공격적인 매수 또는 매도 압력이 시장에 진입하고 있는가? 어떤 가격 수준에서 거래량이 흡수되거나 거부되고 있는가? 현재의 움직임이 세션 컨텍스트(배경)에 어떻게 부합하는가? 인터페이스에서 제공되는 기능 메인 차트는 Canvas
OmniSync Projection
Antonio-alin Teculescu
5 (1)
Chronos Fractal Engine is an innovative price projection indicator for MetaTrader 5, designed to transform your technical analysis by intelligently identifying and projecting historical price patterns. Built upon an advanced correlation algorithm and the fractal principles of the market, this powerful tool visualizes potential future price movements, giving you a unique edge in your trading decisions. What is Chronos Fractal Engine? At its core, the Chronos Fractal Engine employs a sophisticat
Trend Lines PRO MT5
Roman Podpora
5 (1)
트렌드 라인즈 프로       이 지표는 시장이 실제로 어떤 방향으로 전환되는지 파악하는 데 도움이 됩니다. 실제 추세 반전 지점과 주요 시장 참여자들이 다시 진입하는 지점을 보여줍니다. 보시다시피       BOS 라인       복잡한 설정이나 불필요한 노이즈 없이 더 높은 시간대의 추세 변화와 주요 레벨을 확인할 수 있습니다. 신호는 차트에 다시 그려지지 않고 캔들이 마감된 후에도 계속 표시됩니다. MT4 버전   -   RFI LEVELS PRO   표시기   와 결합 시 최대 잠재력을 발휘합니다. 지표가 보여주는 내용: 실제 변화       추세(BOS 라인) 한 번 신호가 나타나면 그 신호는 계속 유효합니다! 이는 신호를 발생시킨 후 변경될 수 있는 리페인팅 방식의 지표와 중요한 차이점입니다. 리페인팅 방식의 지표는 잠재적으로 자금 손실로 이어질 수 있습니다. 이제 더욱 높은 확률과 정확도로 시장에 진입할 수 있습니다. 또한 화살표가 나타난 후 목표가(익절)에 도달하거나
The Zone Trading Indicator is a technical analysis tool for MetaTrader 5 that automatically identifies and displays tradable price zones across multiple timeframes to assist with structured market analysis. The indicator plots Monthly, Weekly, Daily, and H4 tradable zones , allowing traders to view higher- and lower-timeframe price areas simultaneously. These zones are designed to support one-candle–based entry approaches by highlighting predefined areas where price interaction may be monitored.
RFI levels PRO MT5
Roman Podpora
3.67 (3)
이 지표는 추세 반전 지점과 가격 반등 영역을 정확하게 보여줍니다.       주요 투자자들   . 새로운 트렌드가 형성되는 곳을 파악하고 최대한 정확하게 의사결정을 내리며 모든 거래를 완벽하게 통제합니다. TREND LINES PRO   지표와 함께 사용할 때 최대의 잠재력을 발휘합니다.  VERSION MT4 지표가 보여주는 내용: 새로운 추세의 시작 시 활성화되는 반전 구조 및 반전 수준. 최소한의 위험 대비 수익률을 갖는 이익 실현   (TAKE PROFIT)   및   손절매(STOP LOSS)   레벨 표시       RR 1:2   . 지능형 손실 감소 로직이 적용된 손절매 기능. 지정된 지표에서 두 가지 추세 유형에 대한 반전 패턴을 표시합니다. 지표: 트렌드를 따라   트렌드 라인 프로   (글로벌 트렌드 변화) 트렌드 프로   (빠른 트렌드 변화) 간단하고 효과적입니다       스캐너       실시간 추세 (신규). 다중 시간 프레임 도구 필터링. 표시하다  
PZ Day Trading MT5
PZ TRADING SLU
2.83 (6)
Effortless trading: non-repainting indicator for accurate price reversals This indicator detects price reversals in a zig-zag fashion, using only price action analysis and a donchian channel. It has been specifically designed for short-term trading, without repainting or backpainting at all. It is a fantastic tool for shrewd traders aiming to increase the timing of their operations. [ Installation Guide | Update Guide | Troubleshooting | FAQ | All Products ] Amazingly easy to trade It provides
Trend Forecaster
Alexey Minkov
5 (7)
Trend Forecaster – Since 2023. The Trend Forecaster indicator utilizes a unique proprietary algorithm to determine entry points for a breakout trading strategy. The indicator identifies price clusters, analyzes price movement near levels, and provides a signal when the price breaks through a level. The Trend Forecaster indicator is suitable for all financial assets, including currencies (Forex), metals, stocks, indices, and cryptocurrencies. You can also adjust the indicator to work on any time
Advanced Currency Strength28 MT5
Bernhard Schweigert
5 (3)
초보자 또는 전문가 트레이더를 위한 최고의 솔루션! 이 지표는 우리가 독점 기능과 새로운 공식을 통합했기 때문에 독특하고 고품질이며 저렴한 거래 도구입니다. 단 하나의 차트로 28 Forex 쌍의 통화 강도를 읽을 수 있습니다! 새로운 추세 또는 스캘핑 기회의 정확한 트리거 포인트를 정확히 찾아낼 수 있기 때문에 거래가 어떻게 개선될지 상상해 보십시오. 사용 설명서: 여기를 클릭  https://www.mql5.com/en/blogs/post/697384 그것이 첫 번째, 원본입니다! 쓸모없는 지망생 클론을 사지 마십시오. 더 스페셜  강력한 통화 모멘텀을 보여주는 하위 창의 화살표 GAP가 거래를 안내합니다! 기본 또는 호가 통화가 과매도/과매도 영역(외부 시장 피보나치 수준)에 있을 때 개별 차트의 기본 창에 경고 표시가 나타납니다. 통화 강도가 외부 범위에서 떨어질 때 풀백/반전 경고. 교차 패턴의 특별 경고 추세를 빠르게 볼 수 있는 다중 시간 프레임 선택이 가능합
ARICoins
Temirlan Kdyrkhan
ARICoin is a powerful trading companion designed to generate high-probability entry signals with dynamic TP/SL/DP levels based on volatility. Built-in performance tracking shows win/loss stats, PP1/PP2 hits, and success rates all updated live. Key Features: Buy/Sell signals with adaptive volatility bands Real-time TP/SL/DP levels based on ATR Built-in MA Filter with optional ATR/StdDev volatility Performance stats panel (Success, Profit/Loss, PP1/PP2) Alerts via popup, sound, push, or email Cust
Weltrade Spike Sentinel
Batsirayi L Marango
5 (1)
Introducing Indicator for PainX and GainX Indices Traders on Weltrade Get ready to experience the power of trading with our indicator, specifically designed for Weltrade   broker's PainX and GainX Indices.  Advanced Strategies for Unbeatable Insights Our indicator employs sophisticated strategies to analyze market trends, pinpointing optimal entry and exit points.  Optimized for Maximum Performance To ensure optimal results, our indicator is carefully calibrated for 5-minute timeframe charts on
CRT Multi-Timeframe Market Structure & Liquidity Sweep Indicator Non-Repainting | Multi-Asset | MT4 Version Available MT4 Version: https://www.mql5.com/en/market/product/162556 Full Setup Guide: https://www.mql5.com/en/blogs/post/767525 Indicator Overview CRT Ghost Candle HTF Fractal is a complete institutional-grade market structure toolkit for MetaTrader 5. It projects higher-timeframe candle structure, CRT trap levels, session levels, previous period highs and lows, pivot points, and a real
Meta Cipher A
SILICON HALLWAY PTY LTD
5 (1)
Meta Cipher A: 정밀한 가격 행동용 오버레이 지표 Meta Cipher A 는 인기 있는 Market Cipher A 개념을 MetaTrader 5로 가져온 고정밀 오버레이 지표입니다. 가격 차트에 선행 신호를 직접 표시하도록 설계되었으며, 8 EMA 리본 , WaveTrend 분석 및 8가지 다양한 신호 유형을 결합하여 진입, 청산 및 고위험 구간을 미리 파악할 수 있도록 도와줍니다. Meta Cipher A는 단독으로도 강력하지만, Meta Cipher B 와 함께 사용할 때 더 깊이 있는 분석과 확실한 신호 확인이 가능합니다. 기능 요약 이 오버레이 시스템은 트렌드 기반 색상으로 표시되는 동적 EMA와 시각적 명확성을 높이기 위한 채움 영역을 사용합니다. 또한 Blood Diamond (반전 신호), Yellow Cross (시장 조작 경고), Blue Triangle (추세 지속 신호) 등 8가지 전문 신호를 제공합니다. WaveTrend 오실레이터는 백그라운드에
Meta Trend PRO MT5
Roman Podpora
5 (1)
메타 트렌드 프로       — 는 추세 추종 도구로, 거래에서 추측을 배제하고 시장이 이미 결정을 내린 지점을 보여줍니다. 이 지표는 추세, 추세선 및 구조가 변화하는 주요 지점을 식별하고 주요 참여자들이 포지션을 취할 수 있도록 가격이 되돌아오는 영역을 강조합니다. 단순히 가격 움직임만 보는 것이 아니라, 그 이면에 숨겨진 논리까지 이해할 수 있습니다. 모든 신호는 캔들 마감 후 기록되며, 다시 그려지지 않고 차트에 저장되므로 상황을 확실하게 분석하고 결정을 내릴 수 있습니다. 거래 목표(이익 실현) 또한 표시됩니다. 이 지표의 효과에 대해 완벽한 확신을 가지실 수 있도록 자동 통계 자료를 제공해 드립니다. 방향 전환 후에는 손절매 수준과 해당 수준이 지능적으로 점진적으로 이동하는 모습(Move SL)을 표시해주는데, 이는 매우 중요합니다.       감소시킨다       위험       위치별로. 손절매/이익실현/RR 오른쪽에 내장된 패널은 현재 글로벌 추세 방향의 시장 진입
==================================================================== SMC Pro v6.1 APEX AI — XAUUSD Gold Empire MetaTrader 5 Indicator · Smart Money Concepts · Predictive Intelligence Engine ==================================================================== SMC Pro v6.1 APEX AI is a professional Smart Money Concepts indicator system built exclusively for XAUUSD (Gold) on MetaTrader 5. It combines the complete SMC framework — Order Blocks, Liquidity sweeps, Fair Value Gaps, Break of Structure,
Meravith MT5
Ivan Stefanov
5 (1)
마켓 메이커를 위한 도구. Meravith는 다음과 같은 기능을 제공합니다: 모든 타임프레임을 분석하고 현재 유효한 추세를 표시합니다. 강세와 약세 거래량이 동일한 유동성 구간(거래량 균형 구간)을 강조 표시합니다. 서로 다른 타임프레임의 모든 유동성 레벨을 차트에 직접 표시합니다. 텍스트 기반 시장 분석을 생성하여 참고용으로 제공합니다. 현재 추세를 기반으로 목표가, 지지선 및 손절가를 계산합니다. 거래의 위험 대비 보상 비율(Risk/Reward)을 계산합니다. 계좌 잔고에 따라 포지션 크기를 산출하고 잠재 수익을 추정합니다. 시장에 중대한 변화가 발생할 경우 경고도 제공합니다. 지표의 주요 라인: 강세/약세 거래량 소진 라인 — 목표가로 사용됩니다. 시장 추세를 나타내는 라인. 시장이 강세인지 약세인지에 따라 색상이 변경되며 추세 지지선 역할을 합니다. 색상은 주로 시장 심리를 보여줍니다. 거래량 균형선(Eq). Eq(Volume Equilibrium) 라인은 시스템의 핵심입니
" Dynamic Scalper System MT5 " 지표는 추세 파동 내에서 스캘핑 방식으로 거래하도록 설계되었습니다. 주요 통화쌍 및 금에서 테스트되었으며, 다른 거래 상품과의 호환성이 가능합니다. 추가적인 가격 변동 지원을 통해 추세에 따라 단기 포지션 진입 신호를 제공합니다. 지표의 원리 큰 화살표는 추세 방향을 결정합니다. 작은 화살표 형태의 스캘핑 신호를 생성하는 알고리즘은 추세 파동 내에서 작동합니다. 빨간색 화살표는 상승 방향을, 파란색 화살표는 하락 방향을 나타냅니다. 민감한 가격 변동선은 추세 방향으로 그려지며, 작은 화살표의 신호와 함께 작용합니다. 신호는 다음과 같이 작동합니다. 적절한 시점에 선이 나타나면 진입 신호가 형성되고, 선이 있는 동안 미결제 포지션을 유지하며, 완료되면 거래를 종료합니다. 권장되는 작업 시간대는 M1~H4입니다. 화살표는 현재 캔들에 형성되며, 다음 캔들이 이미 시작되었더라도 이전 캔들의 화살표는 다시 그려지지 않습니다. 입
Bill Williams Advanced
Siarhei Vashchylka
5 (11)
Bill Williams Advanced is designed for automatic chart analysis using Bill Williams' "Profitunity" system. The indicator analyzes four timeframes at once. Manual (Be sure to read before purchasing) Advantages 1. Analyzes the chart using Bill Williams' "Profitunity" system. Signals are displayed in a table in the corner of the screen and on the price chart. 2. Finds all known AO and AC signals, as well as zone signals. Equipped with a trend filter based on the Alligator. 3. Finds "Divergence Bar
UZFX {SSS} 스캘핑 스마트 시그널 MT5는 급변하는 시장에서 정확한 실시간 시그널을 필요로 하는 스캘퍼, 데이 트레이더, 스윙 트레이더를 위해 설계된 리페인팅 없는 고성능 트레이딩 지표입니다. (UZFX-LABS)에서 개발한 이 지표는 가격 움직임 분석, 추세 확인, 스마트 필터링 기능을 결합하여 모든 통화 쌍과 시간대에서 확률이 높은 매수 및 매도 시그널을 생성합니다. 추천* 최적 시간대: 15분 이상. {1시간}이 제가 가장 선호하는 시간대입니다. 그리고 그 결과는 정말 놀라울 정도입니다...! 참고: { LTL 164343 } 지표와 함께 사용하면 신호 적중률을 높일 수 있습니다. LTL 신호를 통해 추세를 파악하고, SSS 신호를 진입 신호로 활용하세요. 이 접근 방식은 승률을 극대화하고 오신호를 방지하는 데 도움이 됩니다. 주요 기능 스마트 신호 감지 – 강력한 추세 반전 및 지속 패턴을 정밀하게 식별합니다. 다중 시간대 스캘핑 – 모든 시간대에서 완벽하게 작동
제작자의 제품 더 보기
Cumulative Volume Delta (CVD) MA-X: 지능형 오더 플로우 센티먼트 도구 Cumulative Volume Delta (CVD) MA-X 를 통해 시장의 숨겨진 메커니즘을 파악해 보세요. 일반적인 거래량 지표는 '얼마나' 거래되었는지만 알려주지만, CVD MA-X는 누가 구매자와 판매자 사이의 전투에서 승리하고 있는지, 그리고 그 시점이 언제 인지 알려줍니다. 틱(Tick) 단위의 가격 액션과 거래량 분포를 집계하여 시장의 확신과 고갈 지점을 명확한 지도로 제공합니다. 트레이더의 우위: 왜 CVD MA-X인가? 대부분의 트레이더가 실패하는 이유는 가격 후행성에 반응하기 때문입니다. CVD MA-X는 거래량에 가중치를 둔 캔들의 내부 압력(꼬리 대비 몸통 비율)을 분석하여 **선행적 우위(Leading Edge)**를 제공합니다. 실시간으로 세 가지 핵심 질문에 답합니다: 이 움직임은 실제 자금에 의해 뒷받침되는가? (CVD/제로 라인 정렬) 트렌드가 힘을 잃
The Ultimate Ichimoku MTF Dashboard: Your All-In-One Trading Edge Transform Your Trading with One Powerful Indicator Imagine having a professional trading assistant that monitors multiple timeframes simultaneously, identifies high-probability entries, warns you of potential reversals, and provides clear risk management guidance-all in one clean, intuitive display. That's exactly what the Ichimoku MTF Dashboard delivers.     Why This Isn't Just Another In
QQE Kalman Hybrid  Smarter Trend Detection. Faster Entries. Cleaner Decisions. QQE Kalman Hybrid is built to help you act on what’s happening now. This momentum and trend confirmation indicator combines the proven structure of classic QQE logic with a modern Kalman adaptive engine designed to reduce lag, smooth noise, and surface high-quality trade opportunities earlier. The result is a clean, decision-focused tool that helps traders identify:  What’s the trend structure?  Where’s the best
FREE
T3 MTF PureMaths : 멀티 타임프레임 Tillson T3 지표 대화형 대시보드가 탑재된 제로-래그(Zero-Lag) 컨플루언스 트레이딩 시스템 멀티 타임프레임 트레이딩의 우위 T3 MTF Pure Maths  는 월봉부터 5분봉까지 총 8가지 타임프레임 의 시장 구조를 동시에 집계하는 전문가급 트레이딩 대시보드입니다. 차트 전환이나 복잡한 계산 없이도 즉각적이고 실행 가능한 통찰력을 제공합니다. 순수 수학 최적화(인디케이터 핸들 미사용, CopyBuffer 호출 배제)로 구축된 이 지표는 표준 구현 방식보다 5~10배 빠른 성능 을 제공하며, 실전 매매와 고강도 전략 테스트(백테스팅) 모두에 최적화되어 있습니다. 이 지표는 어떤 질문에 답을 주나요? 트레이더의 질문 T3 MTF Pure의 답변 전체적인 추세 구조는 어떠한가? 색상으로 구분된 패널이 MN1-W1-D1-H4 정렬 상태를 한눈에 보여줍니다. 최적의 진입 시점은 어디인가? 진입 타임프레임(H1-M30-M15-
Cumulative Volume Delta MA-X MTF (Gradient Momentum 포함) 이 지표는 MetaTrader 5를 위한 다중 타임프레임(MTF) 누적 거래량 델타(CVD) 분석을 수행합니다. 틱 데이터 또는 리얼 볼륨 데이터를 분석하여 매수 압력과 매도 압력 사이의 순 차이를 계산함으로써, 오더 플로우의 심리 상태를 시각적으로 표현합니다. 지표 로직 및 주요 기능 본 지표는 다음과 같은 수학적 접근 방식을 통해 거래량을 분석합니다. 데이터 소스: 거래소 자산의 리얼 볼륨(Real Volume)과 외환(Forex)/CFD를 위한 OHLC 윅 프록시(OHLC Wick Proxy) 계산 방식을 모두 지원합니다. 그라데이션 시스템: 4색 이동평균선이 다음과 같이 추세 단계를 식별합니다. DeepSkyBlue(하늘색): 양수 값, 상승 중. Orange(오렌지색): 양수 값, 하락 중. Magenta(자주색): 음수 값, 하락 중. Purple(보라색): 음수 값, 상
Critical Market Session Information with a Single Glance Stop juggling multiple tools and squinting at time zone converters. The SessionInfoDisplay Indicator is your new, indispensable trading co-pilot that puts real-time market intelligence directly on your chart.   What It Does: Your Essential Trading Dashboard   This intelligent indicator provides three critical pieces of information at a glance: 1. Real-Time Session Detection    - Automatically identifies which major financial session is act
FREE
Clr-Dynamic RSI v SMA Indicator: A Comprehensive Analysis of Features and Advantages The Clr-Dynamic RSI v SMA indicator represents a significant evolutionary leap in technical analysis tools, transforming the classic Relative Strength Index (RSI) from a potentially ambiguous oscillator into a sophisticated, multi-dimensional trading system. At its core, this indicator retains the mathematical foundation of the RSI, measuring the speed and change of price movements, but radically enhances its
MTF Candlestick Patterns Detector: 당신의 궁극적인 프라이스 액션(Price Action) 지휘 본부 빠르게 급변하는 트레이딩의 세계에서, 단 하나의 반전 패턴을 놓치는 것은 수익성 있는 한 주와 기회를 날려버린 주 사이의 차이를 만듭니다. MTF Candlestick Patterns Detector 는 모든 타임프레임에서 24가지 이상의 전설적인 캔들스틱 패턴을 동시에 스캔, 감지 및 집계하도록 설계된 전문가급 MQL5 지표입니다. 차트를 뒤지며 추측하는 일을 멈추십시오. 알고리즘이 높은 확률의 셋업을 당신에게 직접 가져다줍니다. 트레이더의 우위: 왜 이 지표인가? 대부분의 캔들 지표는 지연된 데이터로 차트를 어지럽힙니다. 본 감지기는 콕핏(조종석) 역할을 하는 멀티 타임프레임(MTF) 패널 을 제공하여 가장 중요한 트레이딩 질문에 한눈에 답합니다: 추세 구조는 어떠한가? 패널은 "추세 패턴"(MN1 ~ H4)과 "진입 패턴"(H1 ~ M5)을 구분하여
MTF VWAP Indicator - Quick Overview   This indicator shows you where institutional money is flowing across multiple timeframes using Volume Weighted Average Price (VWAP) to identify high-probability trading zones.     What It Actually Does:     1. Tracks Smart Money Levels: - Shows Daily, Weekly, and Monthly VWAP lines where big players (banks, funds) are trading - Tells you if price is above or below these key institutional levels - Shows distance from VWAP as a percentage (tells you how extend
Indicator Overview This is a sophisticated Multi-Timeframe (MTF) indicator that not only applies the classic Fisher Transform formula but integrates it into a comprehensive trading system featuring a real-time dashboard. The indicator excels at pinpointing reversals through advanced divergence detection and providing a clear, multi-timeframe view of market structure.     How It Works: Core Fisher Logic   1.   Normalization and Signal Generation         The indicator transforms price (using med
MTF WAD Simplified Indicator - Professional Trading Solution     Overview The MTF WAD Simplified is a sophisticated multi-timeframe volume-based indicator designed to track smart money flow across financial markets. By monitoring the Williams Accumulation/Distribution (WAD) across 8 different timeframes, this tool provides traders with unprecedented insight into institutional accumulation and distribution patterns.     Core Benefits for Traders     1. Smart Money Tracking - Detect Institutional
RSI v SMA MTF Indicator : Professional Trading Edge in One Tool   Summary The RSI v SMA MTF Indicator is a sophisticated, multi-timeframe momentum analysis tool that transforms the traditional RSI into a powerful, actionable trading system. By combining RSI slope analysis with SMA crossover signals, divergence detection, and real-time multi-timeframe confluence, this indicator provides traders with a more comprehensive view of market momentum across all relevant timeframes.     Core Utility an
MTF Connecting Fractals Multi-Timeframe Market Structure. One Glance. Real Decisions. MTF Connecting Fractals is not just another arrow-printing indicator. It’s a complete multi-timeframe market structure intelligence system designed to answer the most important trading questions in real time - clearly, visually, and without clutter. Built around fractals as objective structure anchors, this tool gives traders a decisive edge by combining price action, structural context, proximity risk, and
Multi-Timeframe Money Flow Index (MTF MFI) with Smart Divergence and Dashboard Unlock the flow of institutional money across every timeframe. Are you tired of guessing the trend only to be trapped by a sudden reversal? The Multi-Timeframe Money Flow Index (MTF MFI) is a professional-grade trading tool designed to provide a bird's-eye view of market liquidity and momentum. By aggregating volume-weighted data from W1 down to M1, this indicator eliminates noise and highlights high-probability tra
MTF Parabolic SAR Maximize your trading efficiency with the Multi-Timeframe Parabolic SAR Trend and Momentum Dashboard. Designed for serious traders who value clarity over clutter, this tool aggregates price action across six timeframes into a single, sleek visual interface.  By combining that reliable classic Parabolic SAR logic with advanced momentum scoring and risk assessment, this indicator transforms raw data into actionable trade signals.  The Strategic Edge: Why This Indicator? Most tra
Multi-Timeframes Heiken Ashi Dashboard : The Trend is your Friend Indeed Confluence Trading System     Transform Your Trading with Crystal-Clear Market Structure Visualization Tired of confusing charts and conflicting signals? The Multi-Timeframe Heiken Ashi Dashboard is your complete solution for professional-grade market analysis. This all-in-one indicator combines smoothed Heiken Ashi candles with an intelligent multi-timeframe panel to give you unprecedented clarity in any market condition
Hybrid BB-LRMA [Trend and Volatility Engine]   Master the markets with the Hybrid BB-LRMA, a professional-grade technical analysis tool that fuses the volatility-tracking power of Bollinger Bands (BB) with the hyper-responsive Linear Regression Moving Average (LRMA) to eliminate lag and pinpoint high-probability entries with arrow Signals   Why Hybrid BB-LRMA? Most moving averages are too slow, and Bollinger Bands alone can be noisy. The Hybrid BB-LRMA solves this by using a gradient-based LRMA
Hybrid FATL Fractal: Professional Digital-Signal Logic   Simplify the Complexity of Market Structure.   Unlock the power of digital signal processing combined with price action geometry. The Hybrid FATL Fractal is a professional-grade technical analysis tool designed to eliminate market noise and pinpoint high-probability institutional turning points. By merging the Fast Adaptive Trend Line (FATL) algorithm with Dynamic Fractal Breakout logic, this indicator provides a dual-layered filter that a
VOLUME PROFILE SAF-XII MT5용 전문가급 마켓 프로파일 분석 도구 (그리드 스타일 트레이더를 위한 드림 인디케이터) 볼륨 프로파일(Volume Profile)이란? 볼륨 프로파일은 단순히 '시간'에 따른 거래량을 보여주는 일반 지표와 달리, 특정 '가격 수준'에서의 거래 활동을 표시하는 전문 기관용 도구입니다. 설정한 기간 내에 거래가 '어디서' 발생했는지를 시각화하여 다음을 식별할 수 있도록 돕습니다. 가치 영역 (VAH/VAL) – 전체 거래의 대부분이 발생한 가격대. 제어 지점 (POC) – 거래량이 가장 많이 집중된 단일 가격 수준. 유동성 불균형 – 각 가격대에서의 매수(Bull) vs 매도(Bear) 지배력. 지지/저항 – 실제 거래 활동에 기반한 자연적인 가격 지지 및 저항선. 3가지 작동 모드 – "설정 후 방치(Set and Forget)" 가능 VP_MANUAL (스윙 트레이딩 및 주요 레벨 분석) 사용자가 수직선을 드래그하여 분석 범위를 직접
Fisher Transform MTF Pro v4.03 Professional Multi-Timeframe Trading Decision System Fisher Transform MTF Pro turns complex multi-timeframe data into clear, actionable trade decisions in seconds. It answers instantly:  What’s the trend?  Where’s the entry?  How strong is the setup?  What are the risks?  Should I buy, sell, or wait?  The Edge   Zero-Line Filter (Trend Protection) Prevents counter-trend trades by default:  No buys above zero  No sells below zero This forces alignment with th
Turtles Pro
Ebrah Ssali
Turtles Professional v2.0 The Legendary Turtle Strategy, Reimagined for the Modern Trader Turtles Pro transforms the iconic 1980s Turtle Trading System into a high-performance, multi-timeframe decision engine. It eliminates guesswork by providing institutional-grade analysis on trend structure, entry quality, and volatility all on a single chart. The Strategic Edge Turtles Professional uses a Smart Weighted Bias Engine to prioritize higher time frames, ensuring your trades align with the d
Hybrid Hull-LSMA : The Trend Meets Momentum Powerhouse Are you struggling with moving averages that are either too slow to react or too noisy to trust? The Hybrid Hull-LSMA is a solution, engineered to solve the "lag vs. noise" dilemma. By fusing the ultra-smooth Hull Moving Average (HMA) with the predictive Least Squares Moving Average (LSMA), this indicator delivers a high-definition view of market structure and entry timing. Why the Hybrid Hull-LSMA? Standard indicators follow the market; t
Divergent Fisher Transform MT5  Precision Momentum. Intelligent Filtering. EA-Ready Automation. The Divergent Fisher Transform for MT5 is a professional-grade momentum trading indicator designed to help traders answer the most important question in the market: “What should I do right now?” It transforms raw price into high-probability, structured trading decisions using a powerful combination of:  Fisher Transform momentum modeling  Zero-line structural filtering  Multi-level overbought/o
Divergent Stochastic Filter II Catch Reversals Early, Filter Noise, Trade with Confidence The Edge: Why This Stochastic is Different  Every trader knows the Stochastic oscillator. But knowing when to trust its signals, that's the real challenge. The Divergent Stochastic Filter II transforms this classic indicator into a precision reversal detection system by adding critical elements: divergence intelligence, signal filtering and exhaustion detection.  While standard Stochastic oscillators fire s
X-Hybrid Modular Z – 실행 지능 플랫폼 (Execution Intelligence Platform) 모든 인디케이터를 완전 자동 매매 시스템으로 전환하십시오 X-Hybrid Modular Z는 잘 설계된 모든 사용자 지정 인디케이터를 완전한 자동 트레이딩 시스템으로 변환하는 모듈형 실행 엔진입니다. 전문적인 수준의 체결 및 리스크 관리를 원하는 트레이더를 위해 설계되었으며, 코딩 없이도 신호 생성과 기관급 거래 관리 사이의 간극을 메워줍니다. 이 EA(Expert Advisor)의 차별점 기존의 EA와 달리, 이는 단순한 신호 판독기가 아닙니다. X-Hybrid Modular Z는 실행 프로세스를 고도로 인지하는 트레이딩 프레임워크로 다음과 같은 기능을 제공합니다: 적응형 슬리피지 제어 (ATR 및 스프레드 인지) 브로커 행동 프로파일링 (자기 학습형 실행 조정) 재시도 기반 실행 엔진 (Retry-based engine) 진입 간격 필터 및 시각적 갭 존 표시 (
Cumulative Volume Delta (CVD) MA-X Plus: 궁극의 오더 플로우 프레임워크 CVD MA-X Plus 와 함께 시장의 숨겨진 메커니즘을 파헤쳐 보세요. 일반적인 거래량 지표는 단순히 '얼마나' 거래되었는지만 알려주지만, CVD MA-X Plus는 누가 싸움에서 이기고 있는지, 언제 이기고 있는지, 그리고 '스마트 머니'가 어디에 닻을 내리고 있는지를 보여줍니다. 틱 단위 가격 액션(주식/선물/골드와 같은 규제 시장에서는 'Real Volume'으로 설정 가능)과 다층 거래량 분포를 집계하여 시장의 확신, 고갈 및 유동성에 대한 선명한 지도를 제공합니다. 본 지표는 다음 링크에서 제공되는 CVD MA-X의 진화 버전입니다: https://www.mql5.com/en/market/product/162375?source=Site+Profile+Seller 트레이더의 엣지: 왜 CVD MA-X Plus로 업그레이드해야 하는가? 대부분의 트레이더가 실패하는 이유는
Hybrid FATL-LRMA : Digital Precision Meets Statistical Certainty The Ultimate Trend-Momentum Convergence System with clear action protocols. Why Hybrid FATL-LRMA? The Edge some Traders Miss Are you tired of lagging indicators that signal entries after the move has already happened? Frustrated by noisy oscillators that keep you in chop while trends pass you by? The Hybrid FATL-LRMA is a dual-engine trading system that bridges the gap between high-frequency digital signal processing and stat
ADX ClrDynamic: The Gradient-Aware, Low-Lag Trend and Momentum ADX/DMI Evolution Tired of lagging indicators that signal a trend only after the move is over? Most ADX indicators are too slow for modern markets. ADX Gradient-Aware solves this by fusing Hull-style low-lag smoothing with a unique Gradient Momentum Logic. This isn't just an indicator; it's a complete decision-engine that identifies trend structure, measures strength, and pinpoints high-probability entries using dual-slope detection.
SERA - Sigma-Enhanced Regression Analysis – The Non-Repaint, Early-Entry MTF Trading System The Problem with Most Regression Tools (And How We Solved It) Traditional regression indicators lie to you. They repaint, they lag, and distort actionable data. Their flaws cost you in false back-tests, late entries/exits and therefore missed profits. Avoid catching a falling knife or chasing a train with SERA, she eliminates ALL three problems. One-Click Trading Style Selection – Choose Conservative, R
간소화된 3색 밴드 로직(Tri-Color Band Logic)은 스퀴즈(Squeeze) 감지 기능을 유지하면서 가격 움직임(Price Action)의 가독성을 최우선으로 합니다. 1. 철학의 전환: 당신의 방식대로 매매하세요 SignalMode 설정을 통해 인지케이터가 밴드 터치를 해석하는 방식을 선택할 수 있습니다. 이를 당신의 매매 성향이라고 생각하십시오. 가격이 ...에 닿을 때 돌파 모드 BREAKOUT (추세 트레이더) 반등 모드 BOUNCE (역추세 트레이더) 자동 모드 AUTO (하이브리드) 상단 밴드 매수 – "모멘텀 가속, 흐름에 올라타세요!" 매도 – "과매수 상태, 반전을 노리세요!" 가격에 따라 결정 – 돌파 마감 = 매수 / 안쪽 마감 = 매도 하단 밴드 매도 – "하락 모멘텀, 하락에 합류하세요!" 매수 – "과매도 반등이 임박했습니다!" 가격에 따라 결정 – 이탈 마감 = 매도 / 안쪽 마감 = 매수 SignalMode 파라미터는
필터:
리뷰 없음
리뷰 답변