Precision Strike Arrows MT5 by MoonPipz

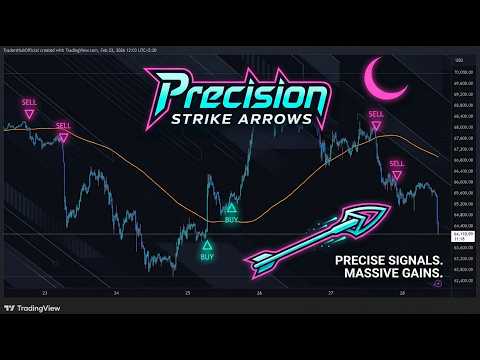
Precision Strike Arrows is a precision signal indicator for MetaTrader 5 built on the Momentum concept. It detects periods of market compression and fires a single clean arrow on the chart when momentum shifts direction, keeping your chart clear and your focus sharp.

Most arrow indicators paint signals on every minor fluctuation. Precision Strike Arrows is designed to do the opposite. It waits for the market to coil, identifies the moment momentum commits to a direction, and plots one decisive arrow. Nothing more.

How it works

Precision Strike Arrows uses a multi-layer internal calculation to assess market conditions on each bar running on a continuous background assessment of volatility, momentum and trend direction. A signal is only produced when all three agree. The result is a small number of high-confidence arrows rather than a constant stream of signals. The indicator does not signal partial setups. Either all conditions are met and an arrow appears, or the bar is left clean.

Signal limiter

The Max Signals Per Side parameter controls how many signals can fire in one direction before the opposite signal must occur first. Set to 1, the indicator alternates cleanly between buy and sell. This prevents signal clusters in trending conditions and keeps the chart readable. For some traders, 2/3 may be suitable too for multiple entries.

Free version

This version works on four symbols: EURUSD, GBPUSD, USDJPY and XAUUSD and on strategy tester or back test it works on every instrument. The indicator will not load on other instruments on live chart. For all the pairs and a professional dashboard for trade management, you may check out the pro version. 

Input parameters

  • SMA Length: Period of the moving average filter (default 200)
  • Use TrueRange: Include gap range in internal channel calculation (recommended on)
  • Show SMA Line: Display the 200 SMA line on the chart
  • Show Arrows: Enable or disable signal arrows
  • Use SMA Filter: Require price to be on the correct side of the 200 SMA before a signal is allowed
  • Max Signals Per Side: Maximum signals allowed in one direction before requiring the opposite (default 1)

Timeframes

The indicator performs best on the 15-minute timeframe. Higher timeframes will produce fewer signals. Lower timeframes may produce more noise.

Notes

The indicator shows the strongest results on XAUUSD and cryptocurrency pairs due to their momentum-driven price behaviour. On forex pairs it works well as a trend confirmation tool alongside other analysis. It is recommended to keep the SMA filter enabled at all times to avoid trading against the prevailing trend. The Max Signals Per Side setting is best left at 1 for a clean alternating signal structure.

추천 제품
Aggression Volume Profile
Edson Cavalca Junior
4.55 (11)
This indicator plots the volume profile by Price on the chart There are 5 ways to view it: By Total Volume Traded (Premium Version); Volume Ticks(Forex) Separated by Buyers and Sellers (Premium Version); Buyers Only (Premium Version); Sellers Only (Premium Version); Business balance (Buyers - Sellers) (Premium Version); . It is possible to select how many days the profiles will be calculated.( Premium Version) On the current day it recalculates the histogram data for each new candlestick.
FREE
Order Book, known also as Market Book, market depth, Level 2, - is a dynamically updated table with current volumes of orders to buy and to sell specific financial instument at price levels near Bid and Ask. MetaTrader 5 provides the means for receiving market book from your broker, but in real time only, without access to its history. The indicator OrderBook Cumulative Indicator accumulates market book data online and visualizes them on the chart. In addition, the indicator can show the market
Market Profile 3 ForexArby com
Hussien Abdeltwab Hussien Ryad
4 (15)
Market Profile 3 MetaTrader 5 indicator  version 4.70— is a classic Market Profile implementation that can show the price density over time, outlining the most important price levels, value area, and control value of a given trading session. This indicator can be attached to timeframes between M1 and D1 and will show the Market Profile for daily, weekly, monthly, or even intraday sessions. Lower timeframes offer higher precision. Higher timeframes are recommended for better visibility. It is als
FREE
Waves Sizer
Flavio Javier Jarabeck
3.86 (7)
Wyckoff fans, enjoy! Ideally to be used with the Weis Waves indicator, but it can be easily used alone, the Waves Sizer puts the range (in resulting Price movement) done by the Price on its market swings. You can control how accurate or loose will be the swings. This tool is very helpful for visually know how much the Price has traveled in your Timeframe. This way you can confront this level of effort with the resulting Volume, etc... Weis Waves indicator: https://www.mql5.com/en/market/produc
FREE
Volume-to-Price Movement Oscillator (VP Oscillator) for MT5 The VP Oscillator highlights the balance (or imbalance) between trading volume and price movement, helping traders spot hidden accumulation, distribution, or weakening trends. How It Works: Calculates each bar’s price range (High–Low) and tick volume. Normalizes both values over a set period (default: 14). Plots the absolute difference between them ×100 — showing how closely price action aligns with trading activity. Interpretation: Hig
FREE
Value Chart Candlesticks
Flavio Javier Jarabeck
4.69 (13)
The idea of a Value Chart indicator was presented in the very good book I read back in 2020 , " Dynamic Trading Indicators: Winning with Value Charts and Price Action Profile ", from the authors Mark Helweg and David Stendahl. The idea is simple and the result is pure genius: Present candlestick Price analysis in a detrended way! HOW TO READ THIS INDICATOR Look for Overbought and Oversold levels. Of course, you will need to test the settings a lot to find the "correct" one for your approach. It
FREE
Master SmoothedHMA Color
Som Prakash Gehlot
5 (2)
HMA Color – Master Smoothed A clean, high-precision visual Hull Moving Average indicator with fully smoothed trend color display. Designed for professional scalpers and algorithmic traders who want a simple, fast, powerful trend view without noise. This indicator is built with a " true   double smoothing system" , making the Hull curve extremely soft and responsive. When the trend is bullish, the HMA line automatically switches to Green and shows upward candles. When the trend is bearish, the HM
FREE
Cumulative Delta MT5
Evgeny Shevtsov
4.56 (61)
The indicator analyzes the volume scale and splits it into two components - seller volumes and buyer volumes, and also calculates the delta and cumulative delta. The indicator does not flicker or redraw, its calculation and plotting are performed fairly quickly, while using the data from the smaller (relative to the current) periods. The indicator operation modes can be switched using the Mode input variable: Buy - display only the buyer volumes. Sell - display only the seller volumes. BuySell -
FREE
Gm Volumes
Antonio Augusto Barreto De Melo
4 (3)
A simple volume indicator according to the color of the candle! - Custom background! - Supports Volume by Ticks or Real Volume. The original Metatrader Volume indicator does not show the colors of the bar according to the color of the Candle, it only changes color when the volume of a candle is greater than the previous one, this sometimes creates confusion for beginners and does not know the real reason for the color change. Free indicator, support may take a while to respond!
FREE
Volume Statistic
Syamsurizal Dimjati
5 (1)
Ritz Volume Statistic – Color Volume Histogram & Market Flow Insight Ritz Volume Statistic is a clean and powerful volume analysis indicator designed to visualize bullish and bearish market pressure through a dynamic color-graded volume histogram . The indicator transforms raw tick volume into an intuitive color spectrum , allowing traders to instantly identify volume expansion, exhaustion, and dominance shifts between buyers and sellers. A built-in statistical panel summarizes total volume, bul
FREE
Weis Waves
Flavio Javier Jarabeck
2.83 (18)
The original author is David Weis, an expert in the Wyckoff Method. The Weis Wave is a modern adaptation of the 1930's Wyckoff Method, another expert in Tape Reading techniques and Chart Analysis. Weis Waves takes market volume and stacks it into waves according to price conditions giving the trader valuable insights about the market conditions. If you want to learn more about this subject you can find tons of videos in YouTube. Just look for "The Wickoff Method", "Weis Wave" and "Volume Spread
FREE
## HiddenGapVolume Indicator Overview **HiddenGapVolume** is a sophisticated MetaTrader 5 technical indicator designed to detect hidden market gaps and volume anomalies through statistical analysis. It combines rolling volume averages with dynamic color-coded visualization to identify potential trading opportunities. ### Core Features - **Statistical Volume Analysis**: Calculates moving average and standard deviation bands around volume - **Dynamic Color Coding**: 6-color histogram signaling
FREE
WinWiFi Ultra Signal
Nirundorn Promphao
"We have developed a highly accurate trading signal system applicable to all assets on the 15-minute (M15) timeframe. Calibrated against actual Gold price behavior, this system allows users to trade every candlestick effectively, regardless of market conditions—whether the market is trending, moving sideways, or reversing. The system features real-time arrows and color-coded indicators that signal immediate Buy or Sell entry points. This allows traders to use it as a reliable confirmation tool t
FREE
MultiFrame Volume Trend (MFVI) is a powerful VWAP-based indicator that displays volume trends across multiple timeframes in a clean, easy-to-read dashboard directly on your chart. Instantly capture the overall market direction in just seconds. Features Multi-timeframe VWAP analysis from M1 to MN1. Dashboard panel shows the trend state of each timeframe at a glance. Plots VWAP line and buy/sell arrows directly on the chart. Fully customizable: colors, line width, panel position, arrow symbols. Bu
FREE
Transaction Data Analysis Assistant: This is a statistical analysis tool for transaction data, and there are many data charts for analysis and reference. language: Support language selection switch (currently supports Chinese and English active recognition without manual selection) The main window shows: Balance display Total profit and loss display Now the position profit and loss amount is displayed Now the position profit and loss ratio is displayed The total order volume, total lot size, and
FREE
Weis Waves(와이스 웨이브) 는 데이비드 와이스(David Weis)가 개발하고 리차드 와이코프(Richard Wyckoff)의 원리에 기반한 기술적 지표입니다. 전통적인 거래량이 캔들마다 표시되는 것과 달리, Weis Waves는 거래량을 상승 또는 하락 “파동”으로 누적하며, 가격 방향이 바뀔 때마다 계산을 새로 시작합니다. 이 방법은 트레이더가 시장 움직임의 실제 힘 을 명확하게 파악할 수 있게 해줍니다. 각 파동은 일련의 캔들을 지탱하는 거래량의 강도를 보여줍니다. 주요 특징: 거래량을 매수 및 매도 파동으로 그룹화. 지배적인 압력(매수세 또는 매도세)을 강조. 추세 지속 또는 잠재적 반전 을 식별하는 데 도움. 와이코프 방법론에 기반하며, 거래량 및 흐름 분석에 널리 사용됨. Weis Waves는 가격과 거래량의 균형을 평가하기 위해 많은 전문 트레이더들이 활용하며, 시장 역학에 대한 더 깊은 통찰을 제공합니다.
FREE
CandleCountDownByLuc
Luc Emile Timmermans
Candle Countdown (MT5) — 현재 캔들 종료까지 남은 시간 Candle Countdown 는 MetaTrader 5용 경량 인디케이터로, 현재 캔들이 마감(종료)되기까지 남은 시간 을 실시간 카운트다운으로 표시합니다. 1초마다 업데이트되며, 차트를 지저분하게 만들지 않고 깔끔하게 보입니다. 주요 기능 실시간 캔들 카운트다운 (타임프레임에 따라 mm:ss 또는 hh:mm:ss) 3가지 표시 위치 가격 레벨 근처(TradingView 스타일) — 현재 가격 레벨 주변에 정렬 우측 상단 고정 — 차트 우측 상단에 고정 표시 스프레드/정보 위(우측 상단) — 스프레드/정보 텍스트와 겹치지 않도록 더 위에 표시 커스터마이징 가능 : 글꼴, 크기, 색상, 접두어(prefix), 여백 및 오프셋 MT5의 모든 종목 / 모든 타임프레임 에서 동작 작동 방식 현재 바(캔들)의 시작 시간과 타임프레임 길이를 이용해, 캔들 종료까지 남은 초를 계산하여 표시합니다. 가격 레벨(TV 스타일
FREE
Aggression Wave RSJ
JETINVEST
4.83 (6)
This indicator sums up the difference between the sells aggression and the buys aggression that occurred in each Candle, graphically plotting the waves of accumulation of the aggression volumes.   Through these waves an exponential average is calculated that indicates the direction of the business flow. Note: This indicator DOES NOT WORK for Brokers and/or Markets WITHOUT the type of aggression (BUY or SELL).   Be sure to try our Professional version with configurable features and alerts:  Agre
FREE
Time and Sales Tick
Pablo Filipe Soares De Almeida
Time & Sales Tick Indicator 는 MetaTrader 5 차트에서 실시간 거래 틱 정보를 표시하는 지표입니다. 가격, 틱 거래량 및 시간을 시각적으로 보여주며, 사용자가 시장 미세 구조를 분석할 수 있도록 도와줍니다. 기능 설명 가격, 거래량 및 시간을 포함한 틱 데이터를 차트 내 패널에 실시간으로 표시합니다. 틱 데이터를 사용자가 지정한 시간 또는 수량 간격으로 그룹화하고, 상승 틱은 녹색, 하락 틱은 빨간색으로 구분하여 표시합니다. 패널은 차트의 네 모서리 중 원하는 위치로 자유롭게 이동할 수 있으며, 표시 크기와 글꼴도 사용자 설정이 가능합니다. 모든 통화쌍 및 상품에 대응하며 MetaTrader 5 플랫폼 내에서 안정적으로 작동합니다. 이 인디케이터는 스캘핑 및 틱 기반 전략을 사용하는 트레이더에게 유용합니다.
A Média Móvel é um indicador que faz parte da Análise Técnica. Com ela, é possível identificar o equilíbrio dos preços no mercado, observando tendências de alta, neutra ou baixa. Este indicador customizado traz opções extras pera definir o método de cálculo podendo-se esclolher entre SMA,EMA,SSMA,LWMA,JJMA,JurX,ParMA,T3,Vidya,AMA,HULL MA. Também conta com varias opções para escolher o método de cálculo para o preço base a ser usado no cáculo da média.
Core Purpose ​ A permanent crosshair indicator designed exclusively for MetaTrader 5 (MT5). It addresses key limitations of MT5's default crosshair, including the need for manual activation, automatic disappearance on click, and solid lines obscuring price bars. This indicator optimizes chart analysis by delivering a smooth, professional-grade crosshair experience on MT5. ​ Key Features ​ Automatic activation: Enabled immediately after loading, replacing the default Ctrl+F function. The crossha
FREE
SMC Complete Indicator v4 - Trading Guide Introduction The SMC Complete Indicator v4 is a Smart Money Concepts (SMC) trading tool for MetaTrader 5. It automatically identifies institutional trading patterns to help traders align with "smart money" - banks, hedge funds, and market makers. Core Principle: Large institutions need liquidity to fill massive orders. They create predictable patterns: accumulating at key levels, hunting stop losses, leaving footprints (Order Blocks, FVGs), and creating
FREE
Accumulated Aggression
Edson Cavalca Junior
The indicator measures the accumulated balance of aggression. The formula is as follows:  Accumulated   = Previous Candle Accumulated + Purchase Volume - Sales Volume. Know our products    *** Did you like the product? Then, help us doing review in the " Reviews " tab. The indicator sends information to your email or cell phone when the accumulated balance changes direction. Example : Accumulated seller becomes a buyer. Note : It is recommended to use the default configuration and VPS valu
Show Pips for MT5
Roman Podpora
4.52 (27)
이 정보 표시기는 계정의 현재 상황을 항상 알고 싶어하는 사람들에게 유용합니다. VERSION MT 4 -   More useful indicators 표시기는 포인트, 백분율, 통화 단위의 이익뿐만 아니라 현재 쌍의 스프레드와 현재 기간에서 막대가 마감될 때까지의 시간과 같은 데이터를 표시합니다. 차트에 정보선을 배치하는 데는 여러 가지 옵션이 있습니다. 가격 오른쪽(가격보다 뒤에 있음) 코멘트(차트의 왼쪽 상단) 화면의 선택된 모서리에 있습니다. 정보 구분 기호를 선택할 수도 있습니다. | / \ # 이 표시기는 사용하기 쉽고 매우 유익합니다. 설정에서 불필요한 정보 항목을 비활성화할 수 있습니다. 설정 외모의 종류       - 정보 라인 표시 유형. 세 가지 옵션이 있습니다: 가격을 따르세요       - 가격을 따르세요. 댓글로       - 코멘트로; 화면의 선택된 모서리에서       - 화면의 선택한 모서리에 있습니다. 첨부용 그래프 코너       - 화면의 선택한
FREE
BoxInside MT5
Evgeny Shevtsov
5 (4)
This indicator calculates the volume profile and places labels that correspond to the VAH, VAL and POC levels, for each candle individually. Indicator operation features The indicator works on the timeframes from M3 to MN, but it uses the history data of smaller periods: M1 - for periods from M3 to H1, M5 - for periods from H2 to H12, M30 - for the D1 period, H4 - for the W1 period, D1 - for the MN period. The color and location of the VAL, VAH and POC labels on the current candle are considere
FREE
Stochastic Color Alerts
Pablo Filipe Soares De Almeida
5 (1)
Stochastic Color Alerts Stochastic Color는 모멘텀 방향과 교차 신호를 식별하기 위해 동적 색상 변화와 통합 알림 시스템을 갖춘 사용자 정의 스토캐스틱 오실레이터입니다. 메인 라인 (%K)은 자동으로 색상이 변경됩니다: 녹색: 상승 모멘텀 빨간색: 하락 모멘텀 주황색: 현재 형성 중인 캔들 이 지표는 클래식 %K, %D 및 Slowing 파라미터를 기반으로 하며, 기간을 설정할 수 있고 표준 레벨은 20과 80입니다. 포함된 알림 유형: 과매도 및 과매수 구간에서 %K와 %D 교차 시 매수/매도 알림 모든 레벨에서의 교차 알림 색상 변경 알림 (모멘텀 변화) 모든 알림은 캔들 종료 후 생성되며(리페인트 없음), 캔들당 하나의 알림만 발생하고 모바일 푸시 알림을 선택적으로 사용할 수 있습니다. 모든 종목과 모든 타임프레임에서 스캘핑, 데이 트레이딩 및 스윙 트레이딩에 적합합니다.
FREE
All-in-One Chart Patterns Professional Level: The Ultimate 36-Pattern Trading System All-in-One Chart Patterns Professional Level is a comprehensive 36-pattern indicator well known by retail traders, but significantly enhanced with superior accuracy through integrated news impact analysis and proper market profile positioning. This professional-grade trading tool transforms traditional pattern recognition by combining advanced algorithmic detection with real-time market intelligence.  CORE FEATU
FREE
Fibo scalping strategy
Komila Safarova
5 (2)
이 EA는 피보나치 되돌림과 피보나치 레벨을 기반으로 합니다. 피보나치 레벨에 기반한 신호가 있을 경우, 동시에 여러 매수 및 매도 포지션을 개설할 수 있습니다. 또한, 자유 증거금 수준에 따라 추세에 따라 계좌 자본금이 계좌 잔액보다 높을 경우 여러 포지션을 개설할 수 있습니다. 헤지 거래에는 센트 계좌를 사용하는 것을 권장합니다. 1,000달러를 입금하면 100,000센트가 됩니다. Exness Standard 센트 계좌에서 이 점을 확인했으며, 이 브로커를 추천해 드릴 수 있습니다. 제 EA는 고위험 계좌이므로 센트를 위험에 노출하는 것이 좋으므로 센트 계좌 유형을 사용하는 것을 강력히 권장합니다. 기본 설정을 사용하는 것을 권장합니다. 이 설정을 여러 번 테스트했기 때문입니다. 이 EA는 모든 통화쌍에서 작동할 수 있지만, XAUUSD(금) 상품만 사용하는 것을 권장합니다. 이 상품은 시장 변동성이 높고, 변동성이 가장 높은 상황에서도 매우 효과적일 수 있기 때문입니다. XA
FREE
Market Phase Analyzer
Mattia Impicciatore
4 (2)
개요 명확한 신호와 간단한 규칙으로 시장의 세 가지 핵심 단계를 식별합니다. 이 지표는 아시아 세션을 기반으로 한 축적(Accumulation) 단계를 실시간으로 감지하고, 조작(Manipulation) 단계에서 유동성 스윕을 식별하며, 분배(Distribution) 단계에서 추세 방향을 확인합니다. 상승 단계에는 녹색 화살표, 하락 단계에는 빨간색 화살표를 표시하며, 아시아 박스의 색상과 테두리를 사용자 정의할 수 있고, 옵션으로 일일 시가 라인을 표시하여 신속한 인트라데이 분석을 지원합니다. 작동 원리 축적 단계에서 지표는 기록된 고점과 저점 사이에 박스를 생성합니다. 조작 단계에서는 가격이 박스 범위를 설정한 핍 수 이상 초과했는지 확인합니다. 분배 단계에서는 ATR 기반 확인 또는 고정 핍 돌파를 통해 단계 변화를 검증합니다. 조건이 충족되면 해당 화살표와 단계 레이블을 차트에 표시합니다. 3단계 거래 로직 축적(Accumulation) – 아시아 세션 시간을 설정하고
FREE
️ Trade Manager oneclick  ( Reverse Trade,  Partial Close,  Breakeven, Close All Running Trade )   control – Smart Manual Trade Control for MT5 Trade Manager oneclick control is a powerful yet lightweight trade management utility built for manual traders who want precise control over their open positions — directly from the MT5 chart. This EA does not open or close trades automatically based on any strategy. It simply provides one-click management tools to handle your running trades efficient
FREE
이 제품의 구매자들이 또한 구매함
SuperScalp Pro
Van Minh Nguyen
5 (8)
SuperScalp Pro – 고급 다중 필터 스캘핑 인디케이터 시스템 SuperScalp Pro는 클래식 Supertrend와 여러 지능형 확인 필터를 결합한 고급 스캘핑 인디케이터 시스템입니다. 해당 인디케이터는 M1부터 H4까지 모든 타임프레임에서 효율적으로 작동하며, 특히 XAUUSD, BTCUSD 및 주요 외환 통화쌍에 적합합니다. 독립형 시스템으로 사용하거나 기존 거래 전략에 유연하게 통합할 수 있습니다. 이 인디케이터는 11개 이상의 필터를 통합하며, 빠른/느린 EMA, 추세 판별용 3개의 EMA, EMA 기울기(EMA slope), RSI, ADX, 거래량(Volume), VWAP, 볼린저 밴드 돌파(Bollinger Bands Breakout) 및 MACD 다이버전스 필터 등을 포함합니다. 스마트 캔들 필터는 캔들 종가를 확인하여 약한 신호를 제거하고, 3 EMA와 MACD 다이버전스 필터를 결합한 추세 인식 메커니즘은 더 높은 승률의 신호를 선별하는 데 도움을 줍니
이 지표를 구매하면 제 프로페셔널 트레이드 매니저를 무료로 드립니다. 우선 이 거래 시스템이 리페인팅, 리드로잉 및 레이그 인디케이터가 아니라는 점을 강조하는 것이 중요합니다. 이는 수동 및 로봇 거래 모두에 이상적인 것으로 만듭니다. 온라인 강좌, 설명서 및 프리셋 다운로드. "스마트 트렌드 트레이딩 시스템 MT5"은 새로운 및 경험이 풍부한 트레이더를 위해 맞춤형으로 제작된 종합적인 거래 솔루션입니다. 10개 이상의 프리미엄 인디케이터를 결합하고 7개 이상의 견고한 거래 전략을 특징으로 하여 다양한 시장 조건에 대한 다목적 선택이 가능합니다. 트렌드 추종 전략: 효과적인 트렌드 추이를 타기 위한 정확한 진입 및 손절 관리를 제공합니다. 반전 전략: 잠재적인 트렌드 반전을 식별하여 트레이더가 범위 시장을 활용할 수 있게 합니다. 스캘핑 전략: 빠르고 정확한 데이 트레이딩 및 단기 거래를 위해 설계되었습니다. 안정성: 모든 인디케이터가 리페인팅, 리드로잉 및 레이그가 아니므로 신뢰
Entry In The Zone and SMC Multi Timeframe is a real-time market analysis tool developed based on Smart Money Concepts (SMC). It is designed to analyze market structure, price direction, reversal points, and key zones across multiple timeframes in a systematic way. The system displays Points of Interest (POI) and real-time No Repaint signals, with instant alerts when price reaches key zones or when signals occur within those zones. It functions as both an Indicator and a Signal System (2-in-1), c
FX Trend MT5 NG
Daniel Stein
5 (4)
FX Trend NG: 차세대 멀티 마켓 트렌드 인텔리전스 개요 FX Trend NG 는 다중 시간 프레임 기반의 전문 트렌드 분석 및 시장 모니터링 도구입니다. 몇 초 만에 전체 시장 구조를 파악할 수 있도록 설계되었습니다. 여러 차트를 일일이 전환할 필요 없이, 어떤 종목이 추세에 있는지, 어디에서 모멘텀이 약화되고 있는지, 그리고 어떤 시간 프레임이 서로 정렬되어 있는지 즉시 확인할 수 있습니다. 출시 기념 특별 혜택 – FX Trend NG 를 $30 (6개월) 또는 $80 평생 라이선스 로 이용할 수 있습니다. 이미 Stein Investments 고객이신가요? -> 메시지를 보내 전용 고객 그룹에 참여하세요. 설정이나 사용 방법이 필요하신가요? -> Stein Investments 공식 페이지 를 방문하세요. 1. FX Trend NG가 특별한 이유 3단계 추세 로직 – 단순한 Buy / Sell이 아닙니다 • 대부분의 지표는 Buy 또는 Sell 두 가지 상태만 제
Divergence Bomber
Ihor Otkydach
4.89 (83)
이 지표를 구매하신 분께는 다음과 같은 혜택이 무료로 제공됩니다: 각 거래를 자동으로 관리하고, 손절/익절 수준을 설정하며, 전략 규칙에 따라 거래를 종료하는 전용 도우미 툴 "Bomber Utility" 다양한 자산에 맞게 지표를 설정할 수 있는 셋업 파일(Set Files) "최소 위험", "균형 잡힌 위험", "관망 전략" 모드로 설정 가능한 Bomber Utility의 셋업 파일 이 전략을 빠르게 설치, 설정, 시작할 수 있도록 돕는 단계별 영상 매뉴얼 주의: 위의 모든 보너스를 받기 위해서는 MQL5 개인 메시지 시스템을 통해 판매자에게 연락해 주세요. 독창적인 커스텀 지표인 “Divergence Bomber(다이버전스 봄버)”를 소개합니다. 이 지표는 MACD 다이버전스(괴리) 전략을 기반으로 한 올인원(All-in-One) 거래 시스템입니다. 이 기술 지표의 주요 목적은 가격과 MACD 지표 간의 다이버전스를 감지하고, **향후 가격이 어느 방향으로 움직일지를 알려주는
Game Changer Indicator mt5
Vasiliy Strukov
4.8 (20)
Game Changer는 모든 금융 상품에 적용 가능한 혁신적인 추세 지표로, MetaTrader를 강력한 추세 분석 도구로 탈바꿈시켜 줍니다. 모든 시간대에서 작동하며 추세 식별, 잠재적 반전 신호 제공, 트레일링 스톱 기능, 그리고 신속한 시장 대응을 위한 실시간 알림 기능을 제공합니다. 숙련된 전문가든 이제 막 시작하는 초보자든, Game Changer는 추세의 역학을 명확하게 이해하고 자신감 있고 규율 있는 거래를 할 수 있도록 도와줍니다. 이 지표는 차트 재구성 기능을 지원합니다. 구매 후 즉시 연락 주시면 특별 보너스를 드립니다. Strong Support 및 Trend Scanner 지표를 무료로 제공해 드립니다. [email protected]으로 메시지를 보내주세요. 참고로, 저는 텔레그램에서 EA나 특별 세트를 판매하지 않습니다. 모든 EA는 MQL5에서만 사용 가능하며, 세트 파일은 제 블로그(여기)에서만 다운로드하실 수 있습니다. 사기꾼을 조심하시고 다른 사
RFI levels PRO MT5
Roman Podpora
3.67 (3)
이 지표는 추세 반전 지점과 가격 반등 영역을 정확하게 보여줍니다.       주요 투자자들   . 새로운 트렌드가 형성되는 곳을 파악하고 최대한 정확하게 의사결정을 내리며 모든 거래를 완벽하게 통제합니다. TREND LINES PRO   지표와 함께 사용할 때 최대의 잠재력을 발휘합니다.  VERSION MT4 지표가 보여주는 내용: 새로운 추세의 시작 시 활성화되는 반전 구조 및 반전 수준. 최소한의 위험 대비 수익률을 갖는 이익 실현   (TAKE PROFIT)   및   손절매(STOP LOSS)   레벨 표시       RR 1:2   . 지능형 손실 감소 로직이 적용된 손절매 기능. 지정된 지표에서 두 가지 추세 유형에 대한 반전 패턴을 표시합니다. 지표: 트렌드를 따라   트렌드 라인 프로   (글로벌 트렌드 변화) 트렌드 프로   (빠른 트렌드 변화) 간단하고 효과적입니다       스캐너       실시간 추세 (신규). 다중 시간 프레임 도구 필터링. 표시하다  
Gold Entry Sniper
Tahir Mehmood
5 (5)
Gold Entry Sniper – 골드 스캘핑 & 스윙 트레이딩을 위한 전문 다중 시간 프레임 ATR 대시보드 Gold Entry Sniper 는 XAUUSD 및 기타 종목에 대해 정확한 매수/매도 신호 를 제공하는 고급 MetaTrader 5 지표입니다. ATR 트레일링 스톱 로직 과 다중 시간 프레임 분석 을 기반으로 설계되어 스캘핑과 스윙 트레이딩 모두에 적합합니다. 주요 기능 및 장점 다중 시간 프레임 분석 – M1, M5, M15 추세를 한눈에 확인. ATR 기반 트레일링 스톱 – 변동성에 따라 자동 조정. 전문 차트 대시보드 – 신호 상태, ATR 레벨, 회귀선, 매매 방향 표시. 명확한 매수/매도 마커 – 자동 화살표와 텍스트 라벨. 종료 알림 & 거래 관리 – 수익 보호를 위한 자동 종료 감지. 완전 사용자 설정 가능 – 대시보드 위치, 색상, ATR/회귀선 파라미터 조정. 골드(XAUUSD) 최적화 – M1~M15 스캘핑에 완벽, 외환/지수/암호화폐에도 적용 가능.
FX Power MT5 NG
Daniel Stein
5 (31)
FX Power: 통화 강세 분석으로 더 스마트한 거래 결정을 개요 FX Power 는 어떤 시장 상황에서도 주요 통화와 금의 실제 강세를 이해하기 위한 필수 도구입니다. 강한 통화를 매수하고 약한 통화를 매도함으로써 FX Power 는 거래 결정을 단순화하고 높은 확률의 기회를 발견합니다. 트렌드를 따르거나 극단적인 델타 값을 사용해 반전을 예측하고자 한다면, 이 도구는 귀하의 거래 스타일에 완벽히 적응합니다. 단순히 거래하지 말고, FX Power 로 더 스마트하게 거래하세요. 1. FX Power가 거래자에게 매우 유용한 이유 통화와 금의 실시간 강세 분석 • FX Power 는 주요 통화와 금의 상대적 강세를 계산하고 표시하여 시장 역학에 대한 명확한 통찰력을 제공합니다. • 어떤 자산이 앞서고 있고 어떤 자산이 뒤처지는지 모니터링하여 보다 현명한 거래 결정을 내릴 수 있습니다. 포괄적인 멀티 타임프레임 뷰 • 단기, 중기 및 장기 타임프레임에서 통화와 금의 강세를
Power Candles MT5
Daniel Stein
5 (6)
Power Candles – 모든 시장을 위한 강도 기반 진입 신호 Power Candles 는 Stein Investments의 검증된 강도 분석을 가격 차트에 직접 제공합니다. 가격 움직임에만 반응하는 대신, 각 캔들은 실제 시장 강도를 기준으로 색상화되어 모멘텀 형성, 강도 가속, 명확한 추세 전환을 즉시 파악할 수 있습니다. 모든 시장을 위한 단일 로직 Power Candles는 모든 거래 심볼 에서 자동으로 작동합니다. 현재 심볼이 Forex인지 비-Forex 시장인지 자동으로 감지하여 내부적으로 적절한 강도 모델을 적용합니다. Forex 및 Gold 는 FX Power Delta 값을 사용합니다 (절대값 범위 최대 100) 지수, 크립토 및 CFD 는 IX Power Strength 값을 사용합니다 (절대값 범위 최대 50) 필요한 강도 계산은 Power Candles에 완전히 내장되어 있습니다. 캔들 색상이나 신호 로직을 위해 추가 인디케이터는 필요하지 않습니다. 가격
Trend Lines PRO MT5
Roman Podpora
5 (1)
트렌드 라인즈 프로       이 지표는 시장이 실제로 어떤 방향으로 전환되는지 파악하는 데 도움이 됩니다. 실제 추세 반전 지점과 주요 시장 참여자들이 다시 진입하는 지점을 보여줍니다. 보시다시피       BOS 라인       복잡한 설정이나 불필요한 노이즈 없이 더 높은 시간대의 추세 변화와 주요 레벨을 확인할 수 있습니다. 신호는 차트에 다시 그려지지 않고 캔들이 마감된 후에도 계속 표시됩니다. MT4 버전   -   RFI LEVELS PRO   표시기   와 결합 시 최대 잠재력을 발휘합니다. 지표가 보여주는 내용: 실제 변화       추세(BOS 라인) 한 번 신호가 나타나면 그 신호는 계속 유효합니다! 이는 신호를 발생시킨 후 변경될 수 있는 리페인팅 방식의 지표와 중요한 차이점입니다. 리페인팅 방식의 지표는 잠재적으로 자금 손실로 이어질 수 있습니다. 이제 더욱 높은 확률과 정확도로 시장에 진입할 수 있습니다. 또한 화살표가 나타난 후 목표가(익절)에 도달하거나
Azimuth Pro
Ottaviano De Cicco
5 (4)
LAUNCH PROMO Azimuth Pro price is initially set at 299$ for the first 100 buyers. Final price will be 499$ . THE DIFFERENCE BETWEEN RETAIL AND INSTITUTIONAL ENTRIES ISN'T THE INDICATOR — IT'S THE LOCATION. Most traders enter at arbitrary price levels, chasing momentum or reacting to lagging signals. Institutions wait for price to reach structured levels where supply and demand actually shift. Azimuth Pro maps these levels automatically: swing-anchored VWAP, multi-timeframe structure lines, an
Smart Stop Indicator – 차트 위에서 직접 작동하는 지능형 스톱로스 시스템 개요 Smart Stop Indicator는 감이나 추측이 아닌 명확하고 체계적인 방식으로 스톱로스를 설정하고 싶은 트레이더를 위한 맞춤형 솔루션입니다. 이 도구는 클래식 프라이스 액션 논리(고점, 저점 구조)와 현대적인 브레이크아웃 인식을 결합하여 실제로 가장 논리적인 다음 스톱 레벨을 정확히 식별합니다. 추세, 박스권, 빠른 브레이크아웃 상황 등 어떤 시장에서도 인디케이터는 최적의 SL 구역과 상태(“new”, “broken”, “valid”)를 차트에 직접 표시합니다. 새로운 기능으로 SL 거리의 %ADR 표시가 추가되었습니다. 핵심 기능 자동 시장구조 기반 스톱 설정 • 시장 구조와 실시간 가격 움직임을 기반으로 의미 있는 스톱로스 레벨을 자동으로 탐지합니다. 스마트 브레이크아웃 감지 • 빠른 방향 변화나 돌파 상황에서도 불필요한 조기 스톱 조정을 강요하지 않으며 유연하게 반응합
Trend Screener Pro MT5
STE S.S.COMPANY
4.84 (101)
트렌드 표시기, 트렌드 트레이딩 및 필터링을 위한 획기적인 고유 솔루션, 하나의 도구 안에 내장된 모든 중요한 트렌드 기능! Forex, 상품, 암호 화폐, 지수 및 주식과 같은 모든 기호/도구에 사용할 수 있는 100% 다시 칠하지 않는 다중 시간 프레임 및 다중 통화 표시기입니다. Trend Screener는 차트에 점이 있는 화살표 추세 신호를 제공하는 효율적인 지표 추세 추종 지표입니다. 추세 분석기 표시기에서 사용할 수 있는 기능: 1. 트렌드 스캐너. 2. 최대 이익 분석이 있는 추세선. 3. 추세 통화 강도 측정기. 4. 경고가 있는 추세 반전 점. 5. 경고가 있는 강력한 추세 점. 6. 추세 화살표 Trend Screener Indicator가 있는 일일 분석 예, 일일 신호 성능...등은 여기에서 찾을 수 있습니다. 여기를 클릭하십시오. LIMITED TIME OFFER : Trend Screener Indicator는 50$ 및 평생 동안만 사용할 수 있습니다.
Atomic Analyst MT5
Issam Kassas
4.1 (29)
우선적으로 언급할 점은이 거래 지표가 다시 그리지 않고 지연되지 않으며 이를 통해 수동 및 로봇 거래 모두에 이상적이라는 점입니다. 사용자 매뉴얼: 설정, 입력 및 전략. Atomic Analyst는 가격의 강도와 모멘텀을 활용하여 시장에서 더 나은 이점을 찾는 PA Price Action Indicator입니다. 고급 필터를 장착하여 잡음과 거짓 신호를 제거하고 거래 잠재력을 높이는 데 도움이 됩니다. 복잡한 지표의 다중 레이어를 사용하여 Atomic Analyst는 차트를 스캔하고 복잡한 수학적 계산을 간단한 신호와 색상으로 변환하여 초보 트레이더가 이해하고 일관된 거래 결정을 내릴 수 있도록합니다. "Atomic Analyst"는 새로운 및 경험이 풍부한 트레이더를위한 종합적인 거래 솔루션입니다. 프리미엄 지표와 최고 수준의 기능을 하나의 거래 전략에 결합하여 모든 종류의 트레이더에 대한 다재다능한 선택지가되었습니다. 인트라데이 거래 및 스캘핑 전략 : 빠르고 정확한 일일
FX Levels MT5
Daniel Stein
5 (13)
FX Levels: 모든 시장을 위한 뛰어난 정확도의 지지와 저항 간단 요약 통화쌍, 지수, 주식, 원자재 등 어떤 시장이든 믿을 만한 지지·저항 레벨을 찾고 싶나요? FX Levels 는 전통적인 “Lighthouse” 기법과 첨단 동적 접근을 결합해, 거의 보편적인 정확성을 제공합니다. 실제 브로커 경험을 반영하고, 자동화된 일별 업데이트와 실시간 업데이트를 결합함으로써 FX Levels 는 가격 반전 포인트를 파악하고, 수익 목표를 설정하며, 자신 있게 트레이드를 관리할 수 있게 돕습니다. 지금 바로 시도해 보세요—정교한 지지/저항 분석이 어떻게 여러분의 트레이딩을 한 단계 끌어올릴 수 있는지 직접 확인하세요! 1. FX Levels가 트레이더에게 매우 유용한 이유 뛰어난 정확도의 지지·저항 존 • FX Levels 는 다양한 브로커 환경에서도 거의 동일한 존을 생성하도록 설계되어, 데이터 피드나 시간 설정 차이로 인한 불일치를 해소합니다. • 즉, 어떤 브로커를 사용하
ARIPoint
Temirlan Kdyrkhan
ARIPoint is a powerful trading companion designed to generate high-probability entry signals with dynamic TP/SL/DP levels based on volatility. Built-in performance tracking shows win/loss stats, PP1/PP2 hits, and success rates all updated live. Key Features: Buy/Sell signals with adaptive volatility bands Real-time TP/SL/DP levels based on ATR Built-in MA Filter with optional ATR/StdDev volatility Performance stats panel (Success, Profit/Loss, PP1/PP2) Alerts via popup, sound, push, or email Cu
Grabber System MT5
Ihor Otkydach
4.82 (22)
탁월한 기술적 지표인 Grabber를 소개합니다. 이 도구는 즉시 사용 가능한 “올인원(All-Inclusive)” 트레이딩 전략으로 작동합니다. 하나의 코드 안에 강력한 시장 기술 분석 도구, 매매 신호(화살표), 알림 기능, 푸시 알림이 통합되어 있습니다. 이 인디케이터를 구매하신 모든 분들께는 다음의 항목이 무료로 제공됩니다: Grabber 유틸리티: 오픈 포지션을 자동으로 관리하는 도구 단계별 영상 매뉴얼: 설치, 설정, 그리고 실제 거래 방법을 안내 맞춤형 세트 파일: 인디케이터를 빠르게 자동 설정하여 최고의 성과를 낼 수 있도록 도와줍니다 다른 전략은 이제 잊어버리세요! Grabber만이 여러분을 새로운 트레이딩의 정점으로 이끌어 줄 수 있습니다. Grabber 전략의 주요 특징: 거래 시간 프레임: M5부터 H4까지 거래 가능한 자산: 어떤 자산이든 사용 가능하지만, 제가 직접 테스트한 종목들을 추천드립니다 (GBPUSD, GBPCAD, GBPCHF, AUDCAD, AU
RelicusRoad Pro MT5
Relicus LLC
5 (24)
RelicusRoad Pro: 퀀트 시장 운영 체제 70% 할인 평생 이용권 (한정 시간) - 2,000명 이상의 트레이더와 함께하세요 왜 대부분의 트레이더는 "완벽한" 지표를 가지고도 실패할까요? 진공 상태에서 단일 개념 만으로 거래하기 때문입니다. 문맥 없는 신호는 도박입니다. 지속적인 승리를 위해서는 컨플루언스(중첩) 가 필요합니다. RelicusRoad Pro는 단순한 화살표 지표가 아닙니다. 완전한 퀀트 시장 생태계 입니다. 독점적인 변동성 모델링을 사용하여 가격이 이동하는 "공정 가치 로드"를 매핑하고, 단순 노이즈와 실제 구조적 돌파를 구분합니다. 추측은 그만두세요. 기관급 로드 로직으로 거래를 시작하세요. 핵심 엔진: "Road" 알고리즘 시스템의 중심에는 시장 상황에 실시간으로 적응하는 동적 변동성 채널인 Road Algo 가 있습니다. 세이프 라인(평형) 과 가격이 수학적으로 반전될 가능성이 높은 확장 레벨 을 투영합니다. Simple Road: 일반적인 시장을 위
Entry Points Pro for MT5
Yury Orlov
4.48 (138)
다시 색을 칠하지 않고 거래에 진입할 수 있는 정확한 신호를 제공하는 MT5용 지표입니다. 외환, 암호화폐, 금속, 주식, 지수 등 모든 금융 자산에 적용할 수 있습니다. 매우 정확한 추정값을 제공하고 매수와 매도의 가장 좋은 시점을 알려줍니다. 하나의 시그널로 수익을 내는 지표의 예와 함께 비디오 (6:22)시청하십시오! 대부분의 거래자는 Entry Points Pro 지표의 도움으로 첫 거래 주 동안 트레이딩 결과를 개선합니다. 저희의   Telegram Group 을 구독하세요! Entry Points Pro 지표의 좋은점. 재도색이 없는 진입 신호 신호가 나타나고 확인되면(시그널 캔들이 완성된 경우) 신호는 더 이상 사라지지 않습니다. 여타 보조지표의 경우 신호를 표시한 다음 제거되기 때문에 큰 재정적 손실로 이어집니다. 오류 없는 거래 게시 알고리즘을 통해 트레이드(진입 또는 청산)를 할 이상적인 순간을 찾을 수 있으며, 이를 통해 이를 사용하는 모든 거래자의 성공률이
FX Dynamic MT5
Daniel Stein
5 (5)
FX Dynamic: 맞춤형 ATR 분석으로 변동성과 트렌드를 파악하세요 개요 FX Dynamic 는 Average True Range(ATR) 계산을 활용하여 트레이더에게 일간 및 일중 변동성에 대한 뛰어난 인사이트를 제공하는 강력한 도구입니다. 80%, 100%, 130%와 같은 명확한 변동성 임계값을 설정함으로써 시장이 평소 범위를 초과할 때 빠르게 경고를 받고, 유망한 수익 기회를 재빨리 식별할 수 있습니다. FX Dynamic 는 브로커의 시간대를 인식하거나 수동으로 조정할 수 있으며, 변동성 측정 기준을 일관되게 유지하며, MetaTrader 플랫폼과 완벽하게 연동되어 실시간 분석을 지원합니다. 1. FX Dynamic이 트레이더에게 매우 유용한 이유 실시간 ATR 인사이트 • 하루 및 일중 변동성을 한눈에 모니터링하세요. ATR의 80%, 100%, 130% 임계값이 도달 또는 초과되면, 시장의 중요한 지점에 있음을 알 수 있습니다. • 변동성이 완전히 폭발하기
매일 많은 트레이더들이 공통적인 도전에 직면합니다: 가격이 주요 레벨을 돌파하는 것처럼 보여 거래에 진입하면, 시장이 반전하여 스톱로스가 발동됩니다. 이것을 거짓 돌파(False Breakout)라고 합니다 — 가격이 지지 또는 저항 수준을 잠시 넘어선 후 방향을 반전하는 움직임입니다. 이러한 움직임은 실제 가격 방향이 명확해지기 전에 스톱로스가 발동되는 결과를 초래할 수 있습니다. 기술적 분석에서 이 현상은 일반적으로 "유동성 스윕"(liquidity sweep) 또는 "스톱 헌팅"(stop hunt)이라고 합니다. Mirage Trading System은 거짓 돌파 패턴을 감지하도록 설계된 지표입니다. "Mirage"(신기루)라는 이름은 시장에서 빈번하게 발생하는 기만적인 가격 움직임이라는 환상을 의미합니다. 거짓 돌파가 많은 트레이더를 당황하게 할 수 있지만, Mirage Trading System은 이러한 패턴이 언제 형성되는지 식별하고 후속 가격 움직임의 잠재적 방향을 나
Trend Forecaster
Alexey Minkov
5 (7)
The Trend Forecaster indicator utilizes a unique proprietary algorithm to determine entry points for a breakout trading strategy. The indicator identifies price clusters, analyzes price movement near levels, and provides a signal when the price breaks through a level. The Trend Forecaster indicator is suitable for all financial assets, including currencies (Forex), metals, stocks, indices, and cryptocurrencies. You can also adjust the indicator to work on any time frames, although it is recommen
Trend indicator AI mt5
Ramil Minniakhmetov
5 (15)
트렌드 인공 지능 지표는 실행 가능한 진입 점 및 반전 경고와 추세 식별을 결합하여 상인의 시장 분석을 향상시킬 훌륭한 도구입니다. 이 표시기는 사용자가 자신감과 정밀도로 외환 시장의 복잡성을 탐색 할 수 있도록 지원합니다 기본 신호 외에도 트렌드 인공 지능 지표는 풀백 또는 되돌림 중에 발생하는 2 차 진입 점을 식별하여 거래자가 기존 트렌드 내에서 가격 수정을 활용할 수 있도록합니다. 중요한 장점: ·작동 4 및 5 *명확한 구매 또는 판매 신호 *다시 칠하지 않습니다 *모든 자산에서 작동 나는 전보 사기에 개 또는 세트를 판매하지 않도록주의. 모든 설정은 블로그에 여기에 무료.  중요! 지침 및 보너스를 얻기 위해 구입 후 즉시 저에게 연락! 진짜 가동 감시는 뿐 아니라 나의 다른 제품 여기에서 찾아낼 수 있습니다: https://www.mql5.com/en/users/mechanic/seller&nbsp ; 설정 및 입력: 모든 자산에 대해 기본 설정을 권
Quantum TrendPulse
Bogdan Ion Puscasu
5 (20)
SuperTrend   ,   RSI   ,   Stochastic   의 힘을 하나의 포괄적인 지표로 결합하여 트레이딩 잠재력을 극대화하는 궁극의 트레이딩 도구   인 Quantum TrendPulse를   소개합니다. 정밀성과 효율성을 추구하는 트레이더를 위해 설계된 이 지표는 시장 추세, 모멘텀 변화, 최적의 진입 및 종료 지점을 자신 있게 식별하는 데 도움이 됩니다. 주요 특징: SuperTrend 통합:   주요 시장 추세를 쉽게 따라가고 수익성의 물결을 타세요. RSI 정밀도:   매수 과다 및 매도 과다 수준을 감지하여 시장 반전 시점을 파악하는 데 적합하며 SuperTrend 필터로 사용 가능 확률적 정확도:   변동성이 큰 시장에서 숨겨진 기회를 찾기 위해 확률적 진동   을 활용하고 SuperTrend의 필터로 사용 다중 시간대 분석:   M5부터 H1 또는 H4까지 다양한 시간대에 걸쳐 시장을 최신 상태로 유지하세요. 맞춤형 알림:   맞춤형 거래 조건이 충족되면
IX Power MT5
Daniel Stein
4.92 (13)
IX Power: 지수, 원자재, 암호화폐 및 외환 시장 통찰력을 발견하세요 개요 IX Power 는 지수, 원자재, 암호화폐 및 외환 시장의 강도를 분석할 수 있는 다목적 도구입니다. FX Power 는 모든 가용 통화 쌍 데이터를 사용하여 외환 쌍에 대해 가장 높은 정확도를 제공하는 반면, IX Power 는 기초 자산 시장 데이터에만 초점을 맞춥니다. 이로 인해 IX Power 는 비외환 시장에 이상적이며, 다중 쌍 분석이 필요하지 않은 간단한 외환 분석에도 신뢰할 수 있는 도구입니다. 모든 차트에서 매끄럽게 작동하며, 거래 결정을 향상시키기 위한 명확하고 실행 가능한 통찰력을 제공합니다. 1. IX Power가 트레이더에게 유용한 이유 다양한 시장 강도 분석 • IX Power 는 지수, 원자재, 암호화폐 및 외환 심볼의 강도를 계산하여 각 시장에 맞는 통찰력을 제공합니다. • US30, WTI, 금, 비트코인 또는 통화 쌍과 같은 자산을 모니터링하여 거래 기회를 발견
Candle Smart Range
Gianny Alexander Lugo Sanchez
MetaTrader 5용 Candle Smart Range (CSR) Candle Smart Range는 여러 타임프레임에서 가격 범위를 자동으로 식별하도록 설계된 기술 지표입니다. 이 도구는 캔들 형성 및 이전 고점/저점과의 상호작용을 바탕으로 시장 구조를 분석합니다. 주요 기능: 범위 감지: 급격한 변동 전의 횡보 구간을 자동으로 식별합니다. 거짓 돌파 식별: 가격이 이전 수준을 넘어섰으나 캔들 종가 기준으로 범위 내에서 마감된 경우를 표시합니다. 멀티 타임프레임 분석: 사용자 정의 주기를 포함하여 최대 19개의 타임프레임 데이터를 한 차트에 표시합니다. 내부 시각화 (줌): 차트 변경 없이 상위 타임프레임 캔들 내부의 가격 움직임을 확인할 수 있습니다. 시간 필터: 주요 시장 세션 등 특정 시간대에만 작동하도록 설정 가능합니다. 과거 데이터 복기 모드: 과거 데이터를 단계별로 탐색하며 지표의 작동을 분석할 수 있습니다. 알림 시스템: 캔들 마감 및 새로운 범위 감지에 대한 사용
Advanced Supply Demand MT5
Bernhard Schweigert
4.53 (15)
현재 33% 할인! 초보자나 전문 트레이더를 위한 최고의 솔루션! 이 보조지표는 우리가 다수의 독창적 기능과 새로운 공식을 통합한 독특하고 고품질이며 저렴한 거래 도구입니다. 이 업데이트를 통해 이중 시간대를 표시할 수 있습니다. 더 높은 TF를 표시할 수 있을 뿐만 아니라 차트 TF와 더 높은 TF 모두를 표시할 수 있습니다: 중첩 영역 표시. 모든 Supply Demand 트레이더들이 좋아할 것입니다. :) 중요한 정보 공개 Advanced Supply Demand의 잠재력을 극대화하려면 다음을 방문하십시오. https://www.mql5.com/ko/blogs/post/720245   진입 또는 목표의 명확한 트리거 포인트를 정확히 찾아냄으로 해서 거래가 어떻게 개선될지 상상해 보십시오. 새로운 알고리즘을 기반으로 매수자와 매도자 간의 잠재적인 불균형을 훨씬 더 쉽게 분간할 수 있습니다. 왜냐하면 가장 강한 공급영역과 가장 강한 수요 영역과 과거에 어떻게 진행 되었는지를(이전
" Dynamic Scalper System MT5 " 지표는 추세 파동 내에서 스캘핑 방식으로 거래하도록 설계되었습니다. 주요 통화쌍 및 금에서 테스트되었으며, 다른 거래 상품과의 호환성이 가능합니다. 추가적인 가격 변동 지원을 통해 추세에 따라 단기 포지션 진입 신호를 제공합니다. 지표의 원리 큰 화살표는 추세 방향을 결정합니다. 작은 화살표 형태의 스캘핑 신호를 생성하는 알고리즘은 추세 파동 내에서 작동합니다. 빨간색 화살표는 상승 방향을, 파란색 화살표는 하락 방향을 나타냅니다. 민감한 가격 변동선은 추세 방향으로 그려지며, 작은 화살표의 신호와 함께 작용합니다. 신호는 다음과 같이 작동합니다. 적절한 시점에 선이 나타나면 진입 신호가 형성되고, 선이 있는 동안 미결제 포지션을 유지하며, 완료되면 거래를 종료합니다. 권장되는 작업 시간대는 M1~H4입니다. 화살표는 현재 캔들에 형성되며, 다음 캔들이 이미 시작되었더라도 이전 캔들의 화살표는 다시 그려지지 않습니다. 입
소개       Quantum Breakout PRO   , 브레이크아웃 존 거래 방식을 변화시키는 획기적인 MQL5 지표! 13년 이상의 거래 경험을 가진 숙련된 트레이더 팀이 개발한       퀀텀 브레이크아웃 PRO       혁신적이고 역동적인 브레이크아웃 존 전략으로 거래 여정을 새로운 차원으로 끌어올리도록 설계되었습니다. Quantum Breakout Indicator는 5개의 이익 목표 영역이 있는 브레이크아웃 영역의 신호 화살표와 브레이크아웃 상자를 기반으로 한 손절 제안을 제공합니다. 초보자 거래자와 전문 거래자 모두에게 적합합니다. Quantum EA 채널:       여기를 클릭하세요 중요한! 구매 후 설치 매뉴얼을 받으려면 개인 메시지를 보내주십시오. 추천: 기간: M15 통화쌍: GBPJPY, EURJPY, USDJPY,NZDUSD, XAUUSD 계정 유형: 스프레드가 매우 낮은 ECN, Raw 또는 Razor 브로커 시간: GMT +3 중개인 :
제작자의 제품 더 보기
Precision Trend Filter is an adaptive noise-filtering trend indicator that identifies real market direction while ignoring false moves and choppy price action. The indicator uses a proprietary filtering algorithm with ATR-based dynamic thresholding to separate genuine trend shifts from random market noise. The result is a clean, color-coded trend line that holds flat during consolidation and tracks price aggressively during real trends. Key Features - Color-changing trend line: green for bu
FREE
Standard RSI uses a fixed smoothing factor. Every bar gets the same weight whether the market is trending cleanly or chopping sideways. That is why most RSI signals fail during consolidation. Mystical RSI measures how chaotic price action is on every bar using the Fractal Dimension Index and dynamically adjusts its smoothing in real time. When the market trends, it reacts fast. When the market chops, it slows down and filters out noise. No manual adjustment needed. How It Works The indicator cal
FREE
Expanded Cloud is a trend-following overlay indicator that uses an adaptive expansion algorithm to identify market direction with clarity. Dynamic cloud zones expand and contract around price action based on real-time volatility, giving you a visual edge in reading trend strength and catching reversals early. The indicator includes a built-in information dashboard with two tabs — Signal and Cloud — displaying real-time data about current market conditions directly on your chart. How It Works A r
FREE
Precision Trend Filter   is an adaptive noise-filtering trend indicator that identifies real market direction while ignoring false moves and choppy price action. The indicator uses a proprietary filtering algorithm with ATR-based dynamic thresholding to separate genuine trend shifts from random market noise. The result is a clean, color-coded trend line that holds flat during consolidation and tracks price aggressively during real trends. Key Features - Color-changing trend line: green for
FREE
Mystic RSI by MoonPipz
Sarvaddnya Pathrabe
Standard RSI uses a fixed smoothing factor. Every bar gets the same weight whether the market is trending cleanly or chopping sideways. That is why most RSI signals fail during consolidation. Mystical RSI measures how chaotic price action is on every bar using the   Fractal Dimension Index   and dynamically adjusts its smoothing in real time. When the market trends, it reacts fast. When the market chops, it slows down and filters out noise. No manual adjustment needed. How It Works The indicator
FREE
Expanded Cloud is a   trend-following overlay indicator   that uses an adaptive expansion algorithm to identify market direction with clarity. Dynamic cloud zones expand and contract around price action based on real-time volatility, giving you a visual edge in reading trend strength and catching reversals early. The indicator includes a built-in information dashboard with two tabs — Signal and Cloud — displaying real-time data about current market conditions directly on your chart. How It Works
FREE
필터:
리뷰 없음
리뷰 답변