
Volume Statistic
- 지표
-
Syamsurizal Dimjati
 안녕하세요, 트레이더 여러분!
저는 2023년부터 MetaTrader 5를 위한 고품질 트레이딩 지표와 전문가용 자동매매 프로그램(EA)을 설계하고 개발하고 있습니다.
저의 목표는 트레이더들이 시장 분석 능력과 매매 전략을 향상시킬 수 있도록 신뢰할 수 있고 실용적이며 혁신적인 트레이딩 도구를 만드는 것입니다.
여러분의 피드백을 소중하게 생각합니다. 개선을 위한 제안, 아이디어 및 리뷰는 제품을 지속적으로 발전시키는 데 큰 도움이 됩니다.
**찾고 계신 특정 지표가 있으신가요?** - 버전: 1.1
- 업데이트됨: 16 2월 2026
Ritz Volume Statistic – Color Volume Histogram & Market Flow Insight
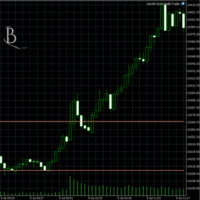
Ritz Volume Statistic is a clean and powerful volume analysis indicator designed to visualize bullish and bearish market pressure through a dynamic color-graded volume histogram.
The indicator transforms raw tick volume into an intuitive color spectrum, allowing traders to instantly identify volume expansion, exhaustion, and dominance shifts between buyers and sellers. A built-in statistical panel summarizes total volume, bullish volume, bearish volume, and net volume balance over recent bars, providing quick insight into current market strength.
Optimized for clarity and performance, Ritz Volume Statistic works smoothly on all symbols and timeframes, making it ideal for scalping, intraday trading, and trend confirmation. It can be used as a standalone volume tool or as a confirmation layer alongside price action, reversal, or Smart Money Concept strategies.


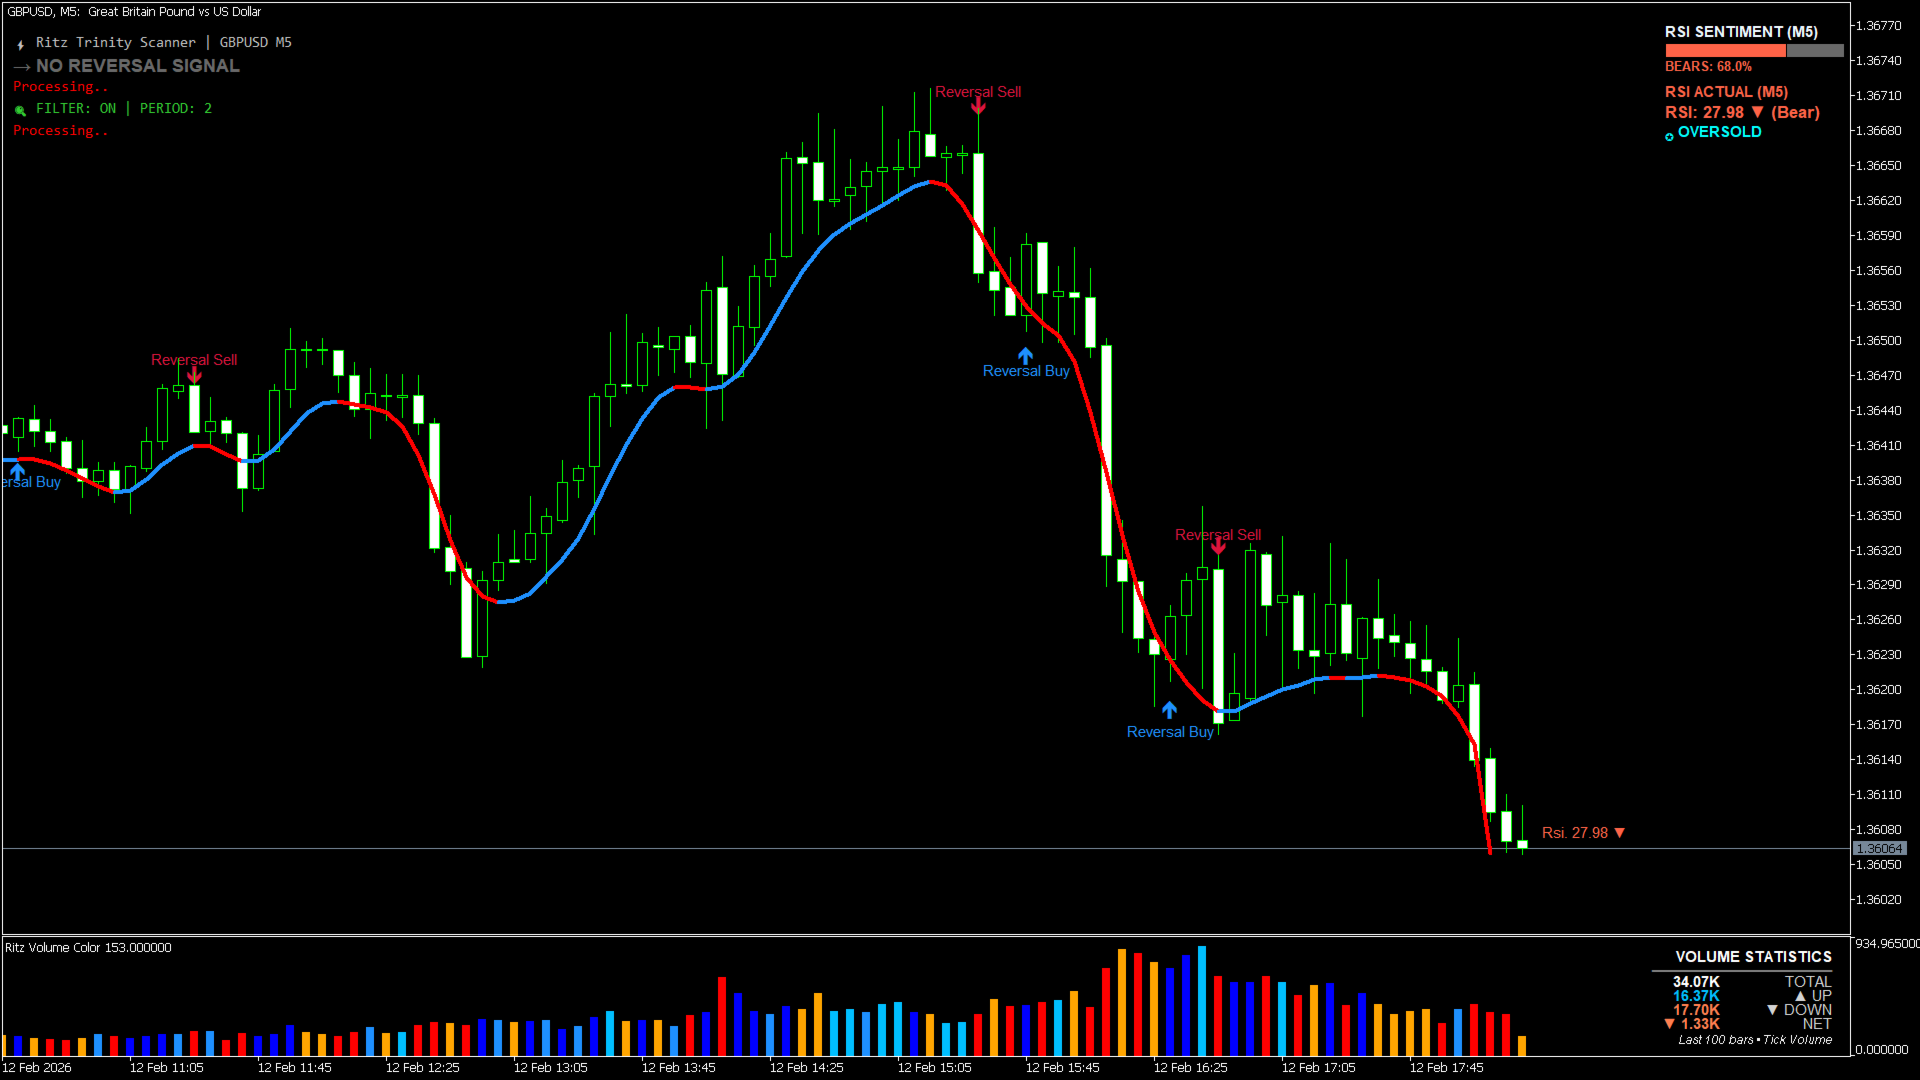

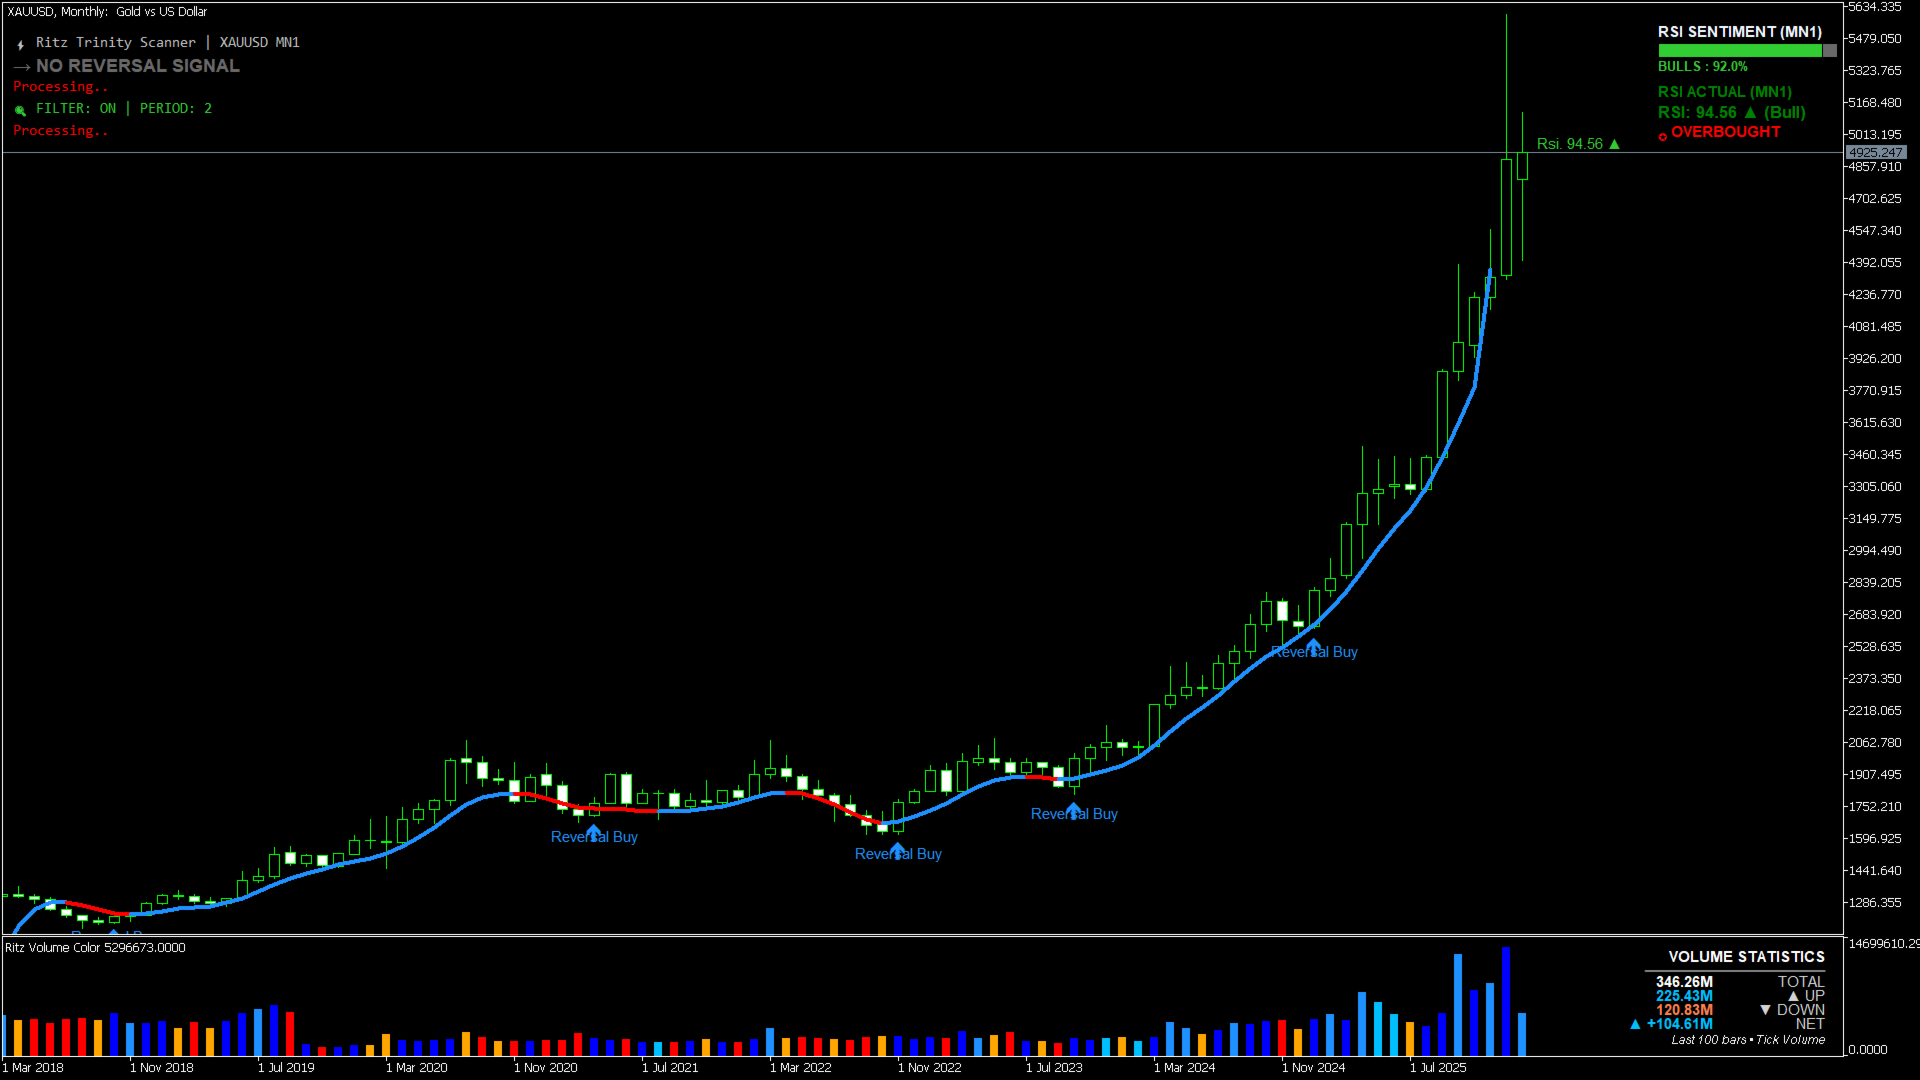

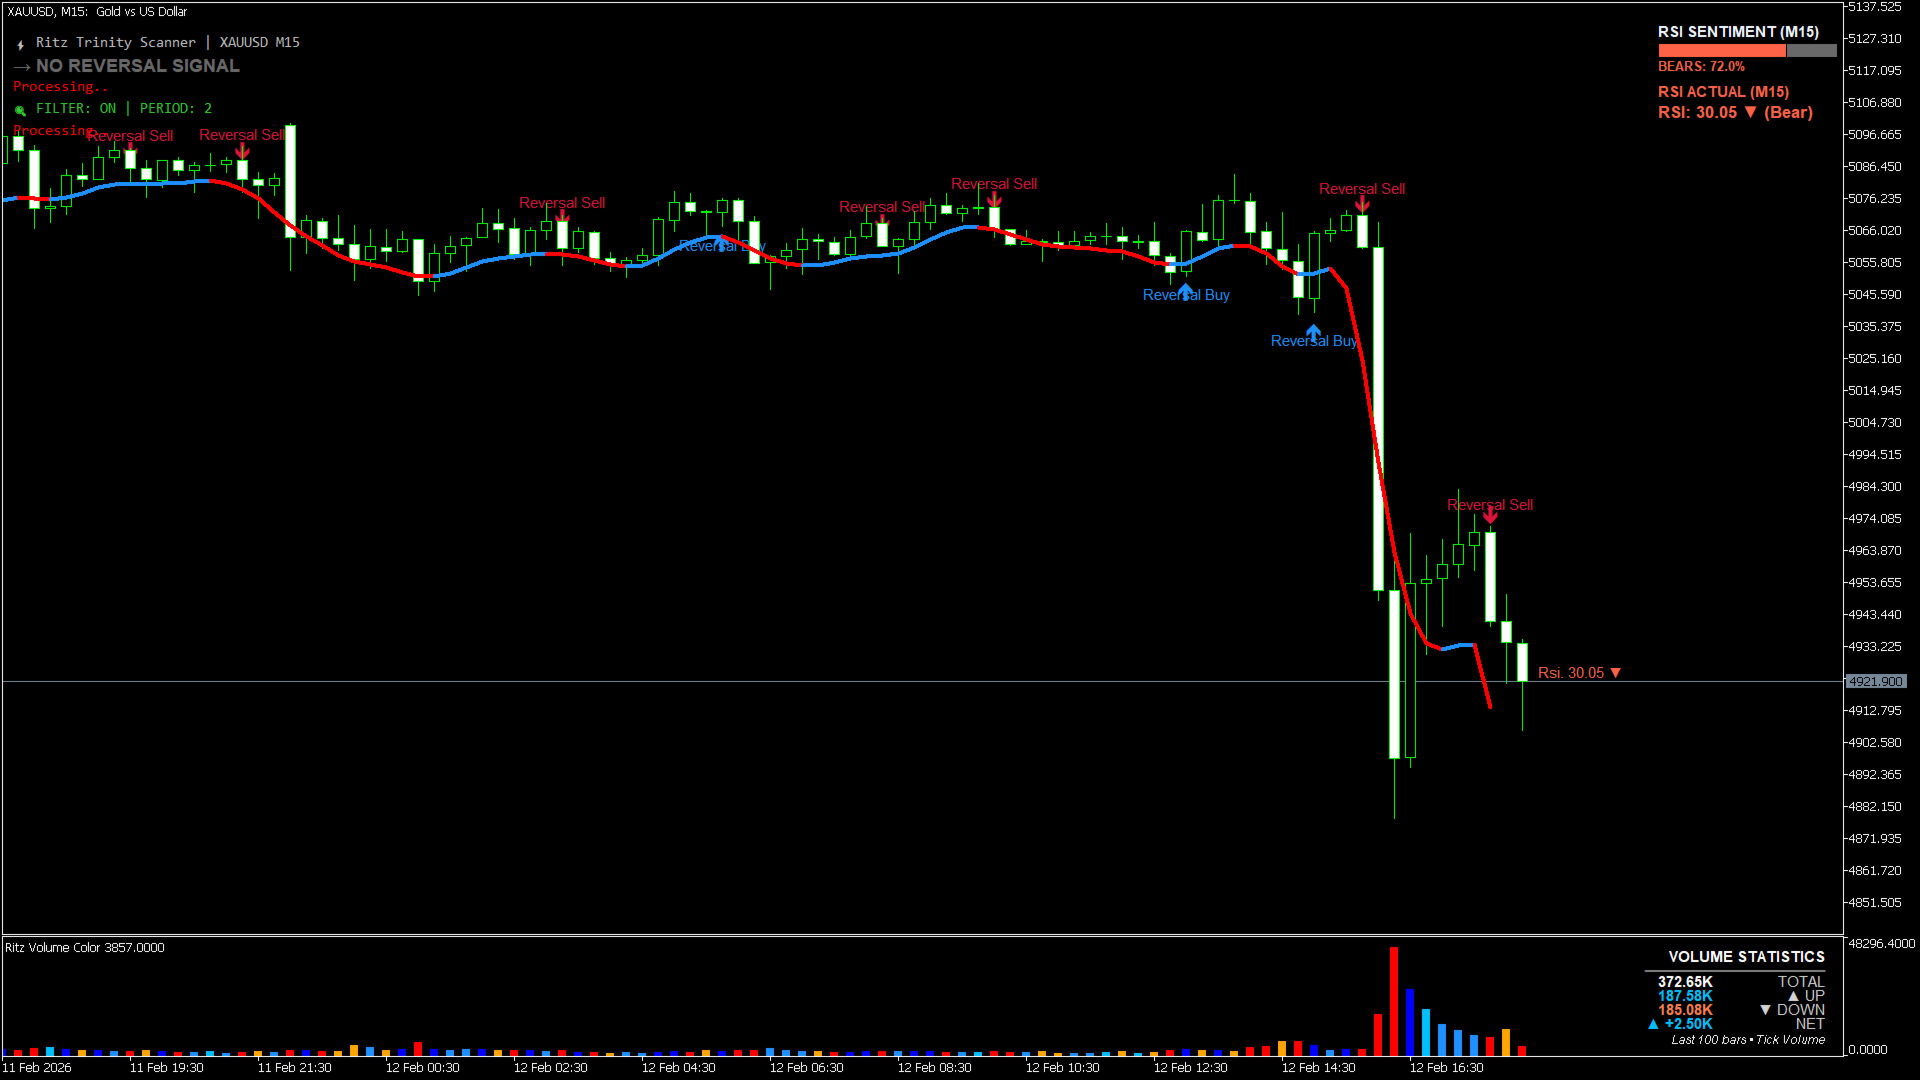




































































1-its also will be much better if can make a X/Y position with the volume-panel of sub-chart ,
2-up volume should go upside of 0-line, down volume should go downside of 0-line , so this will be much clearly;
thanks !