Precision Strike Arrows PRO MT5 by MoonPipz

  • 지표
  • Sarvaddnya Pathrabe
    Sarvaddnya Pathrabe
    Hello, We are creator of MoonPipz.
    After years of manual trading, revenge entries, and chasing holy grails that didn't exist, we started coding indicators that solve real problems like:
    Seeing clear trends without drowning in noise
    Catching high-probability divergences early
  • 버전: 2.0
  • 활성화: 10

Precision Strike Arrows PRO

Precision Strike Arrows PRO is a professional-grade signal indicator for MetaTrader 5 that plots precise buy and sell arrows directly on the price chart. Unlike most arrow indicators that repaint signals or flood the chart with entries on every minor price movement, Precision Strike Arrows PRO is built around a philosophy of signal quality over signal quantity. Every arrow that appears on the chart has passed through multiple internal conditions before being displayed. The indicator is designed for traders who want clear, actionable signals without the noise.

The PRO version includes a fully integrated Trade Manager that automatically calculates and draws Stop Loss, Take Profit, Break Even, and Trailing Stop levels on the chart the moment a signal fires. All levels are displayed as draggable lines that can be adjusted in real time with the mouse. Works on all symbols and all timeframes.

Signal Logic

The indicator runs a continuous background assessment of market conditions on every bar and every tick. Signals are only produced when a precise set of internal conditions align simultaneously across volatility, momentum, and trend direction. This multi-condition requirement is what keeps the signal count low and the quality high. A trader using this indicator should expect to see a small number of well-placed arrows per session rather than a chart covered in signals.

The built-in 200 period SMA serves as the primary directional filter. When this filter is active, buy signals are only produced when price is positioned bullishly relative to the SMA, and sell signals are only produced when price is positioned bearishly. This single filter eliminates a large portion of counter-trend entries that would otherwise reduce overall win rate. The SMA line is displayed on the chart and can be hidden if preferred. The filter itself can also be disabled entirely for traders who prefer to receive signals in both directions regardless of the broader trend.

Signal Quality Rating System

One of the features that separates the PRO version from other arrow indicators is the built-in signal quality scoring system. Every signal that fires is immediately evaluated and assigned a quality score displayed as 1, 2, or 3 stars directly on the chart next to the arrow. The score is calculated in real time based on multiple internal factors including signal strength, trend alignment, and higher timeframe agreement. A 3 star signal indicates the strongest possible confluence across all scoring factors. A 1 star signal still meets the minimum requirements to fire but with lower confluence.

The star rating gives traders an immediate read on signal confidence without requiring them to manually check additional charts or conditions. The current signal quality score is also displayed in the dashboard header so it is always visible regardless of which tab is active.

Multi-Timeframe Confirmation

The indicator includes a built-in multi-timeframe confirmation system that reads the trend direction on a user-selected higher timeframe and displays the result live in the dashboard. The higher timeframe can be set to any standard timeframe from M1 to Monthly. The dashboard clearly shows whether the higher timeframe trend is bullish, bearish, or neutral, and whether it agrees or conflicts with the direction of the most recent signal.

When a conflict is detected between the current signal and the higher timeframe trend, the dashboard displays a visible conflict warning so the trader can decide whether to act on the signal or wait. An optional MTF Filter mode can be enabled to automatically block signals when the higher timeframe disagrees with the signal direction. This mode is off by default to give traders full control, but enabling it effectively adds a second layer of trend filtering on top of the 200 SMA.

Trade Manager

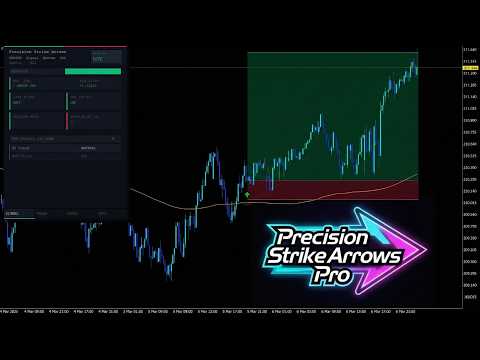
The Trade Manager is a fully integrated position planning system that activates automatically on every signal. The moment a buy or sell arrow appears on the chart, the Trade Manager calculates the appropriate Stop Loss, Take Profit, and Break Even levels based on the selected calculation mode and draws them directly on the chart as clearly labeled price lines. A green zone highlights the potential profit area between entry and Take Profit. A red zone highlights the risk area between entry and Stop Loss. Both zones extend forward from the signal bar in real time.

All three lines — Entry, Stop Loss, and Take Profit — are fully draggable with the mouse. Clicking and dragging any line recalculates all dependent values instantly. Dragging the Stop Loss adjusts the lot size calculation to maintain the configured risk percentage. Dragging the Entry line moves the entire trade setup while preserving the relative distances. Every change is reflected immediately in the Trade tab of the dashboard.

Stop Loss calculation supports three modes. Fixed Pips places the SL at a set distance from entry. ATR Multiplier places the SL based on recent volatility measured by Average True Range, which automatically adapts to market conditions across different pairs and timeframes. Swing mode places the SL behind the most recent swing high or low within a configurable lookback period.

Take Profit calculation also supports three modes. RR Ratio sets the TP at a multiple of the SL distance, ensuring a consistent risk to reward structure on every trade. ATR Multiplier sets the TP based on volatility. Fixed Pips sets the TP at a fixed distance.

Break Even can be enabled with a configurable trigger distance and buffer. When price reaches the trigger level, the Stop Loss is moved to entry plus the buffer, locking in a protected position. The Break Even level is displayed on the chart as a separate labeled line.

Trailing Stop supports two modes. Fixed Pips trails the Stop Loss at a set distance behind price. ATR mode trails based on a multiple of Average True Range, keeping the trail distance proportional to current volatility.

Automatic Lot Size Calculation

The Trade Manager calculates the correct lot size for every trade based on the configured risk percentage and the current Stop Loss distance. The calculation accounts for account balance, symbol tick value, tick size, and pip size, making it accurate across forex pairs, metals, indices, crypto, and commodities. The suggested lot size is displayed in real time on the Trade tab and updates whenever the Stop Loss line is moved.

Risk Monitor

The dashboard Trade tab includes a live risk monitor that tracks three key metrics throughout the session. Risk per trade shows the configured risk percentage and the maximum daily loss threshold. Daily P and L shows the combined realised and floating profit and loss for the current trading day as a percentage of account balance, colour coded green when positive, amber when approaching the daily limit, and red when the limit has been reached. Open Trades shows the number of currently open positions on the active symbol.

When the daily loss limit is reached, the indicator enters a locked state and stops producing new signals for the remainder of the trading day. The dashboard header displays a visible locked warning. The lock resets automatically at the start of the next trading day. This feature is particularly useful for prop firm traders who need to enforce strict daily drawdown rules.

Dashboard Panel

The dashboard is a professional multi-tab panel that sits in the top left corner of the chart and provides a complete read on market conditions, signal status, and trade management in one place. The panel is built with a DPI-aware layout system that scales correctly on all screen resolutions and monitor sizes.

The Signal tab displays a live momentum direction bar that fills left or right depending on current momentum state, the current SMA position relative to price, the last signal direction, SMA filter status, session buy and sell counts, and higher timeframe trend confirmation with conflict detection.

The Trade tab displays the current SL mode and TP mode, all calculated distances in pips, the actual risk to reward ratio, the suggested lot size, the absolute entry price, Stop Loss price, Take Profit price, and Break Even price, the live ATR reading, trailing stop configuration, risk percentage, daily P and L, and open trade count.

The Stats tab displays all active indicator settings and live momentum readings including the current momentum value, momentum direction, SMA position, session signal activity, and the full multi-timeframe confirmation breakdown.

The Info tab displays product information and support details.

Alerts

The indicator fires alerts on every new signal with three delivery options that can be enabled independently. Pop-up alert displays a notification window in MetaTrader 5. Push notification sends an alert to the MetaTrader mobile app. Email alert sends a message to the configured email address. Every alert message includes the symbol, timeframe, signal direction, star quality rating, entry price, Stop Loss price, and Take Profit price.

Signal Filters

Four additional signal filters can be configured independently of the main signal logic. Minimum Momentum Strength sets a threshold below which signals are suppressed, filtering out weak momentum crossovers. Cooldown Bars sets a minimum number of bars that must pass between consecutive signals of the same type, preventing cluster entries in fast-moving markets. Maximum Spread blocks signals when the current spread exceeds the configured threshold, protecting against entries during high spread conditions. MTF Filter blocks signals when the higher timeframe trend disagrees with the signal direction.

Input Parameters

Indicator section: SMA Length, Use True Range, Show SMA Line, Show Arrows, Use SMA Filter, Max Signals Per Side, Show Dashboard. Alerts section: Pop-up Alert, Push Notification, Email Alert. Multi-Timeframe section: Enable MTF, Higher Timeframe, MTF Filter Mode. Signal Filters section: Minimum Momentum Strength, Cooldown Bars, Maximum Spread. Trade Manager Stop Loss section: SL Mode, Fixed SL Pips, ATR Period, ATR SL Multiplier, Swing Lookback Bars. Trade Manager Take Profit section: TP Mode, RR Ratio, ATR TP Multiplier, Fixed TP Pips. Break Even section: Enable Break Even, BE Trigger, BE Buffer. Trailing Stop section: Enable Trailing Stop, Trail Mode, Trail Pips, ATR Trail Multiplier. Risk section: Risk Percentage, Max Daily Loss Percentage, Show Chart Lines.

Recommended Use

Best results on the 15-minute timeframe. Performs consistently on XAUUSD, major forex pairs, and Bitcoin. Compatible with all brokers and all account types. Can be tested on any symbol in the MetaTrader 5 Strategy Tester.

추천 제품
Introduction to Fractal Pattern Scanner Fractal Indicator refers to the technical indicator that makes use of the fractal geometry found in the financial market. Fractal Pattern Scanner is the advanced Fractal Indicator that brings the latest trading technology after the extensive research and development work in the fractal geometry in the financial market. The most important feature in Fractal Pattern Scanner is the ability to measure the turning point probability as well as the trend probabil
Ultimate Double Top & Bottom (Pro Volume Matrix) Stop trading retail breakouts. Start trading Institutional Traps. The   Ultimate Double Top & Bottom   is not a standard, lagging pattern scanner. It is a highly advanced, non-repainting structural engine equipped with a proprietary   3-Leg Volume Matrix . Designed exclusively for Smart Money Concepts (SMC) and order flow traders, this indicator mathematically dissects the tick volume inside M and W patterns to reveal true institutional intent:  
RAD Real Acummulation and Distribution
Jose Alejandro Jacome Jimenez
RAD CRITICAL LEVES RAD indicator tracks “Relevant Volume” in real time, identifying accumulation and distribution processes, projecting them in the chart as SUPPORT or RESISTANCE zones. Natural   support   and resistance levels are generated by Volume Accumulation and Distribution processes. As these processes evolve, levels at which the relevant volume in the market place is positioned, become difficult areas to cross upwards or downwards. By using this information, traders can identify very s
Scalp Signal with SL TP Indicator — Trading Guide What It Does Scalp Signal with SL TP detects high-probability reversal entries by combining RSI extremes with candlestick patterns. It prints buy/sell arrows on chart with auto-calculated SL and 3 TP levels based on ATR. Built for scalping and intraday trading on MT5. Signal Types The indicator generates 3 types of signals. Each requires RSI to be at an extreme level before triggering. 1. Engulfing (Default: ON) The primary and strongest signal.
RSIScalperPro
PATRICK WENNING
RSIScalperPro를 소개합니다 - 메타트레이더 5용 RSI 기반의 혁신적인 인디케이터로, 1분 차트에서의 스캘핑에 최적화되어 있습니다! RSIScalperPro를 사용하면 정확한 진입 및 청산 신호를 제공하는 강력한 도구를 손에 넣을 수 있습니다. RSIScalperPro는 서로 다른 두 가지 RSI 지표를 사용하여 과매수 및 과매도 레벨에 대한 명확한 신호를 제공합니다. 2개의 RSI의 시간 프레임 및 제한 값을 원하는 대로 조정하여 트레이딩 전략에 최적화된 결과를 얻을 수 있습니다. 차트 상의 개별 화살표는 거래 진입 및 청산 타이밍을 쉽게 파악하는 데 도움이 됩니다. 또한 RSIScalperPro의 특징 중 하나는 사용자 정의 가능한 3개의 이동 평균선입니다. 이를 통해 트렌드의 방향을 판단하고 강력한 거래 신호를 확인하는 데 도움이 됩니다. 이를 통해 조기에 트렌드를 감지하고 수익성 높은 거래에 참여할 수 있습니다. 뿐만 아니라 RSIScalperPro는 새로운 거래
MT5용 Crypto_Forex 지표 "TREND 히스토그램", 리페인트 불필요 ................................................................................ - TREND 히스토그램 지표는 표준 이동 평균 교차 분석보다 훨씬 민감하고 효율적입니다. - 지표는 두 가지 색상으로 제공됩니다. 약세 추세는 노란색(금색), 강세 추세는 녹색(색상은 설정에서 변경 가능). - TREND 히스토그램에는 모바일 및 PC 알림 기능이 내장되어 있습니다. - 이 지표를 다른 거래 방식(가격 변동, VSA, 기타 지표)과 함께 사용하면 더욱 효과적입니다. - 이 히스토그램은 가격과 거래량 데이터를 하나의 값으로 결합하는 최고의 지표 중 하나입니다. 여기를 클릭하여 고품질 트레이딩 로봇과 지표를 확인하세요! MQL5 웹사이트에서만 제공되는 오리지널 제품입니다.
Trend Speaker 지표 는 실시간으로 시장 동향을 쉽게 추적하고 분석하려는 트레이더를 위해 설계된 강력한 도구입니다. 차트에서 명확하고 신뢰할 수 있는 매수 및 매도 신호를 제공하여 시장의 현재 추세를 매우 편리하게 평가할 수 있습니다. 사용자 친화적인 인터페이스를 갖춘 Trend Speaker는 잠재적인 거래 기회를 놓치지 않도록 도와주며, 정보에 기반한 결정을 내리고 거래 전략을 향상시키는 데 도움을 줍니다. 이 지표는 모든 매수 및 매도 신호에 대해 Stop Loss와 Take Profit을 표시합니다. 스크린샷에서: 초록색 점은 TP1에서 TP7까지의 Take Profit을 나타냅니다 빨간색 점은 Stop Loss를 나타냅니다. 사용법: 모든 시간대에서 실행할 수 있습니다. 매수 및 매도 화살표의 색상과 두께를 쉽게 변경할 수 있습니다. 이 지표를 사용하는 것은 매우 간단하고 쉽습니다. 편안하게 앉아 있고 모든 것이 잘 될 것입니다. 속성을 변경하여 TP와 SL을 쉽게
UGenesys Volume MT5
Odaine Ramon Mcmillan
50% Off Today Only! Price Goes Back Up at 11 PM (EST) uGenesys Volume Indicator: Your Key to Mastering Market Volume Analysis What Traders Are Saying: "A must-have indicator...really a game-changer." – wuzzy66 "Amazing indicator...strongly recommend to beginners." – joinbehar Understanding Market Volume:   Volume in the market is a critical indicator of movement and opportunity. The uGenesys Volume Indicator is specially crafted to pinpoint when the market has the most volume, allowing you to
Harraz Master HUD
Muhammad Azraf Bin Dzul Fauzi
HARRAZ MASTER HUD v4.4 - The Ultimate Neural Trading Command Center ​ Transform your MetaTrader 5 into a professional, institutional-grade trading terminal. Harraz Master HUD is not just an indicator; it is a complete Artificial Intelligence ecosystem designed specifically for XAUUSD (Gold) and major pairs. ​ EXCLUSIVE FEATURES: ​1. Live Neural AI Typewriter (Jarvis Mode) Experience a live, animated Heads-Up Display that types out real-time market sentiment and advice. It acts as your persona
SnR Smart Eco2
Syamsurizal Dimjati
SUPPORT & RESISTANCE (S&R) Smart Ecosystem Support & Resistance Detection automatically identifies price zones where buying or selling pressure has repeatedly appeared in the past. Zones are built using price reaction strength, fractal behavior, ATR-based zone width, and historical validation. This module provides: Dynamic support and resistance zones Zone classification (weak, untested, verified, proven, turncoat) Optional zone merging and extension Visual clarity with theme-based or custom col
PriceDensity
Andriy Sydoruk
PriceDensity – Professional Price Density Indicator for Accurate Market Level Detection PriceDensity   is a smart, non-volume-based indicator that analyzes historical price action to determine   key price levels with the highest frequency of occurrence . It automatically detects where the market has spent the most time – revealing hidden areas of support and resistance based on actual market behavior, not subjective drawing. This tool is ideal for traders using price action, support/resistance c
MFOP Market Forecast
Oscar Josue Pin Bacuzoy
Develop this indicator for periods of 30 minutes or more, focus on getting market trends right and making sure they are met. MFOP v8.1 gets straight to the point: it scans the market and tells you exactly when there is enough strength to enter a trade. This indicator doesn't do magic, it uses mathematical algorithms to filter out market noise, not enter into false breakouts and show you clear BUY (blue arrow) and SELL (red arrow) opportunities. It is designed and optimized specifically to take
My PVSR
Ashok Kumar Singha
My PVSR   is based on All Type of Pivot Points. Use this Indicator to get proper Support / Resistance Zone and Trade accordingly.. Recommendation: Use this Indicator along with my another Indicator --->>> Dr. Trend   <<<--- Click Here ; To get the best output result feel free to contact me ; Best of Luck It can be used for: All Pairs: Forex, Cryptocurrencies, Metals, Stocks, Indices etc. All Timeframe All Brokers All type of Trading Style like Scalping, Swing, Intraday, Short-Term, Long-
Accurate Gold   지표는 트레이더들의 경험 수준과 관계없이 직관적이고 사용하기 쉬운 사용자 친화적인 도구입니다. 이 지표는 황금 시장의 M5 시간 프레임에서 정확한 신호를 찾는 트레이더들을 위해 설계되었습니다. 이 지표는 가격 움직임과 거래량 동태를 분석하기 위해 고급 수학적 알고리즘을 사용하여 정확한 매수 및 매도 신호를 생성합니다. 이 지표의 비리페인트 특성을 포함한 독특한 기능은 트레이더들에게 잠재적인 시장 반전에 대한 가치 있는 통찰력을 제공하여 판단력 있은 의사 결정을 가능케 합니다. 차트 상의 시각적 표현과 함께 청취 가능한 경고 및 푸시 알림이 사용자 경험을 향상시켜 황금 트레이더들의 도구 상자에 정확성과 신뢰성을 찾는 데 유용한 추가 요소가 됩니다. $ XX   – 한정된 기간 동안, 가격은 처음 5명의 후원자에게 $   XX   입니다.   (   %   매진)   $88   –   그 후, 출시 가격은 $88로 재개되며 골드 심볼로만 제한됩니
Oni Strength Pro - Multi-Asset Trend Analysis Dashboard "Personally, using this has amazingly eliminated my hesitation and kept me in such great form that I finally decided to release the MT5 version!" Product Overview   Oni Strength Pro is the ultimate trend analysis utility for MT5, integrating Currency Strength analysis with Multi-Asset monitoring. The biggest highlight of the latest   v15.00 update   is the   "Fully Automated Symbol Selection."   The system scans all monitored symbols in
Introducing   Trade Vantage : Professional Market Analyst Trade Vantage   is a highly effective analytical tool that uses a specialized algorithm for trading on the Forex and cryptocurrency markets. Its operating principle is based on price analysis for a certain time interval, identifying the strength and amplitude of price movements using a unique indication system. When a trend loses its strength and changes direction, the expert closes the previous position and opens a new one. The bot also
Analise Probabilistica
Valter Cezar Costa
4.78 (9)
I'm sure after a lot of research on the internet, you haven't found any indicator that can help you with forex or binary trading in the latest probability strategy created by famous trader Ronald Cutrim. The strategy is based on a simple count of green and red candles, checking for a numerical imbalance between them over a certain period of time on an investment market chart. If this imbalance is confirmed and is equal to or greater than 16%, according to trader Ronald Cutrim, creator of the pro
FREE
DuhokTrend
Ismael Nayif Ismael Ismael
How to Add a Product Description (MetaTrader Market) To add the product description effectively in MetaTrader's Market, follow these steps: 1. Log into the MetaTrader Market: Go to your MQL5 account . Navigate to the "Seller's Dashboard" or "Products" section. Select your product, DuhokTrend . 2. Writing the Description: To enhance the product's rating, write a detailed and structured description : Template for Product Description: DuhokTrend - Advanced Indicator for Trend Analysis Overview:
Rocket Trend
Andriy Sydoruk
The Rocket Trend indicator is trending. The indicator draws two-color points connected by lines along the chart. This is a trend indicator, it is an algorithmic indicator. It is easy to work and understand when a blue circle appears, you need to buy, when a red one appears, sell. The indicator is used for scalping and pipsing, and has proven itself well. Rocket Trend is available for analyzing the direction of the trend for a specific period of time. Ideal for novice traders learning the laws o
# MT5용 스퀴즈 모멘텀 지표 MetaTrader 5용으로 전문적으로 개발된 강력한 **스퀴즈 모멘텀 지표**로 폭발적인 시장 기회를 포착하세요. 이 고급 변동성 및 모멘텀 지표는 주요 시장 움직임이 발생하기 전 변동성이 낮은 구간을 파악하는 데 도움을 줍니다. 볼린저 밴드와 켈트너 채널의 장점을 결합한 이 지표는 시장이 "압축"되어 돌파를 준비하는 시점을 보여줍니다. 내장된 모멘텀 히스토그램을 통해 추세 방향과 모멘텀 변화를 쉽게 파악할 수 있어 트레이더는 자신감 있고 정확하게 거래에 진입할 수 있습니다. ## 주요 기능 * 고급 스퀴즈 감지 시스템 * 전문적인 MT5 구현 * 급격한 돌파 전 변동성 스퀴즈 감지 * 동적 색상 변화 모멘텀 히스토그램 * 시장 상황을 쉽게 파악할 수 있는 스퀴즈 상태 표시 * 다음 지표 결합: * 볼린저 밴드 * 켈트너 채널 * 선형 회귀 모멘텀 * 추세 변화 조기 감지 * 깔끔하고 반응성이 뛰어난 별도 창 표시 * 완벽하게 사용자
God Spike Boom
Pedro Luis Oiaz Villamar
Session Map Pro automatically plots the critical price levels from previous trading days and overlays visual session markers, giving you an instant "roadmap" of potential support and resistance.   It transforms your chart into a strategic trading battlefield.   Detailed Line Reference Guide (For visual display m1-m5 works best but can be attached to any time frame) Default lookbackDays=5. "Set to 1 for today only and a less cluttered display"  1.Horizontal lines (n) Days)    Solid GREEN Line (
Introduction This indicator detects volume spread patterns for buy and sell opportunity. The patterns include demand and supply patterns. You might use each pattern for trading. However, these patterns are best used to detect the demand zone (=accumulation area) and supply zone (=distribution area). Demand pattern indicates generally potential buying opportunity. Supply pattern indicates generally potential selling opportunity. These are the underlying patterns rather than direct price action. T
Simple Anchored VWAP MT5
Suvashish Halder
4.75 (4)
Simple Anchored VWAP   is a lightweight yet powerful tool designed for traders who want precise volume-weighted levels without complexity. This indicator lets you anchor VWAP from any point on the chart and instantly see how price reacts around institutional volume zones. MT4 Version - https://www.mql5.com/en/market/product/155320 Join To Learn Market Depth -   https://www.mql5.com/en/channels/suvashishfx Using VWAP bands and dynamic levels, the tool helps you understand where real buying and s
FREE
Bullhouse Anchored VWAP
Luiz Vinicius Pereira Rocha -
Anchored VWAP Indicator Track the true market consensus price from any point on the chart. This Anchored VWAP (Volume Weighted Average Price) indicator allows you to anchor the calculation to any candle — highs, lows, breakouts, or key events — offering precise control to identify institutional interest levels. Follow buyer or seller pressure in real-time Add multiple anchors to track various key points of interest simultaneously Ideal for professional and institutional-level analysis
Volume Profile Density v2
Vincent Jose Proenca
Volume Profile Density V2.40 가격 수준별 거래량 분포를 표시하여 기관 투자자의 관심 구간을 보여줍니다. 시간 기반 거래량과 달리, 실제 거래가 집중된 위치를 보여줍니다. 기본 원리: 수평 막대 = 가격별 거래량 막대가 길수록 거래량이 많음 빨간 구간 = 주요 지지 / 저항 구간 주요 사용 목적: 실제 지지선과 저항선 식별 POC (Point of Control) 확인 가치 영역 (총 거래량의 70%) 설정 낮은 거래량 구간을 손절 / 목표 지점으로 활용 색상 코드: 파란색 = 낮은 거래량 (빠른 이동 구간) 노란색 = 중간 거래량 (균형 구간) 빨간색 = 높은 거래량 (기관 매매 구간) 트레이딩 전략: 빨간 구간 반등 시 매수 VAH 또는 빨간 구간 저항 시 매도 거래량 동반 POC 돌파 시 진입 POC 회귀 시 재진입 파란 구간을 목표로 설정 설정: 초보자: 1.0 / 100% / 1.0 스캘핑: 0.5 / 200% / 0.5 스윙: 2.0 / 50% / 1
FREE
Vwap Bands Auto
Ricardo Almeida Branco
The Vwap Bands Auto indicator seeks to automatically map the maximum market frequency ( automatic update of the outermost band ) and has two intermediate bands that also adjust to daily volatility. Another tool from White Trader that combines price and volume, in addition to mapping the daily amplitude. The external band is updated automatically when the daily maximum or minimum breaks the current frequency, and can be an input signal, seeking a return to the daily vwap. Thus, in addition t
Game changer volume analysis and candle by candle also analysis   video link  https://youtu.be/oJgStY1xTlY for example 20 candle analysis 10 Candle also analysis even single candle also analysis  and buyers and sellers live showing in numbers  and fully customised panel   Strong selling activity    Market sentiment turning bearish Price continues rising Volume gradually decreases   Price ↑ + Volume ↑ = Strong Uptrend Price ↓ + Volume ↑ = Strong Downtrend Price ↑ + Volume ↓ = Weak Uptrend Price
【R】【Y】【M】   【R】【Y】【M】  【R】【Y】【M】 The   Linear Regression Channel Indicator   is a powerful technical analysis tool that helps traders capture price trends and potential reversal points. By calculating and displaying linear regression channels, bands, and future projections, this indicator offers an in-depth perspective on market dynamics. It aids in identifying overbought and oversold conditions, trend direction, and provides clear visual cues for potential future price movements. STILL ON I
SPATIAL TOPOLOGY SYSTEM (PRO) —— Decipher Market Psychology, Master Geometric Truths with Quantitative Trading Arsenal —— ️ Stop blindly following lagging indicators. Start trading with "Real Market Emotions"! Are you tired of moving average crossovers that are always a step too late? Fed up with being whipsawed by fake breakouts during ranging markets? Traditional indicators fail because they try to predict the "future direction" using "past prices." But the real market is never a rigid m
이 제품의 구매자들이 또한 구매함
SignalTech MT5
Yue Wang
5 (26)
SignalTech is an unique fully rule based trading system delivers an Institutional approach for both Independent Traders and Prop Firm Challengers. Never Repaint. Push Notification available. No over-optimization. All the winning trades with chart setups are published on the comments page. 2026-05 4107 Pips (Until 05-29 NY Closed) 2026-04 2243 Pips 2026-03 2165 Pips 2026-02 2937 Pips 2026-01 2624 Pips 2025-12 1174 Pips It can generate signals with Buy/Sell Arrows, Push Notification (To Mobile) an
PrimeScalping
Temirlan Kdyrkhan
PrimeScalping is a powerful trading companion designed to generate high-probability entry signals with dynamic TP/SL/DP levels based on volatility. Built-in performance tracking shows win/loss stats, PP1/PP2 hits, and success rates — all updated live. Key Features: Buy/Sell signals with adaptive volatility bands Real-time TP/SL/DP levels based on ATR Built-in MA Filter with optional ATR/StdDev volatility Performance stats panel (Success, Profit/Loss, PP1/PP2) Alerts via popup, sound, push, or e
UZFX {SSS} 스캘핑 스마트 시그널 MT5는 급변하는 시장에서 정확한 실시간 시그널을 필요로 하는 스캘퍼, 데이 트레이더, 스윙 트레이더를 위해 설계된 리페인팅 없는 고성능 트레이딩 지표입니다. (UZFX-LABS)에서 개발한 이 지표는 가격 움직임 분석, 추세 확인, 스마트 필터링 기능을 결합하여 모든 통화 쌍과 시간대에서 확률이 높은 매수 및 매도 시그널을 생성합니다. 추천* 최적 시간대: 15분 이상. {1시간}이 제가 가장 선호하는 시간대입니다. 그리고 그 결과는 정말 놀라울 정도입니다...! 참고: { LTL 164343 } 지표와 함께 사용하면 신호 적중률을 높일 수 있습니다. LTL 신호를 통해 추세를 파악하고, SSS 신호를 진입 신호로 활용하세요. 이 접근 방식은 승률을 극대화하고 오신호를 방지하는 데 도움이 됩니다. 주요 기능 스마트 신호 감지 – 강력한 추세 반전 및 지속 패턴을 정밀하게 식별합니다. 다중 시간대 스캘핑 – 모든 시간대에서 완벽하게 작동
SmartScalping
Temirlan Kdyrkhan
SmartScalping is a powerful trading companion designed to generate high-probability entry signals with dynamic TP/SL/DP levels based on volatility. Built-in performance tracking shows win/loss stats, PP1/PP2 hits, and success rates — all updated live. Key Features: Buy/Sell signals with adaptive volatility bands Real-time TP/SL/DP levels based on ATR Built-in MA Filter with optional ATR/StdDev volatility Performance stats panel (Success, Profit/Loss, PP1/PP2) Alerts via popup, sound, push, or e
ARIPoint
Temirlan Kdyrkhan
1 (1)
ARIPoint is a powerful trading companion designed to generate high-probability entry signals with dynamic TP/SL/DP levels based on volatility. Built-in performance tracking shows win/loss stats, PP1/PP2 hits, and success rates all updated live. Key Features: Buy/Sell signals with adaptive volatility bands Real-time TP/SL/DP levels based on ATR Built-in MA Filter with optional ATR/StdDev volatility Performance stats panel (Success, Profit/Loss, PP1/PP2) Alerts via popup, sound, push, or email Cu
이 제품은 2026년 시장에 맞게 업데이트되었으며 최신 MT5 빌드에 최적화되었습니다. 가격 업데이트 안내: Smart Price Action Concepts는 현재 $200 에 제공됩니다. 다음 30회 구매 후 가격은 $299 로 인상됩니다. 특별 혜택: 구매 후 저에게 개인 메시지를 보내시면 무료 보너스 + 선물 을 받을 수 있습니다. 먼저, 이 트레이딩 도구는 리페인트 없음, 재그리기 없음, 지연 없음의 인디케이터이므로 전문적인 트레이딩에 적합하다는 점을 강조하고 싶습니다. Online course , and manual Smart Price Action Concepts Indicator는 초보자와 경험 많은 트레이더 모두에게 매우 강력한 도구입니다. 20개 이상의 유용한 인디케이터를 하나로 결합하고, Inner Circle Trader Analysis와 Smart Money Concepts Trading Strategies 같은 고급 트레이딩 아이디어를 통합합니다. 이 인디
TrendProMaster
Temirlan Kdyrkhan
MasterTrend Indicator for MT5 A powerful trend-following and signal-evaluation tool MasterTrend   is a custom MT5 indicator that combines Moving Averages and ATR-based risk/reward logic to generate clear buy/sell signals. It visualizes dynamic SL/TP levels, evaluates past trade outcomes, and displays win/loss statistics in a clean on-chart panel. Key features include: Buy/Sell signals based on MA crossovers ATR-based SL/TP1/TP2/TP3 levels with visual lines and labels Signal outcome tracking wit
Azimuth Pro
Ottaviano De Cicco
5 (7)
Azimuth Pro V2: Synthetic Fractal Structure and Confirmed Entries for MT5 Overview Azimuth Pro is a multi-level swing structure indicator by Merkava Labs . Four nested swing layers, swing-anchored VWAP, ABC pattern detection, three-timeframe structural filtering, and closed-bar confirmed entries — one chart, one workflow from micro-swings to macro-cycles. This is not a blind signal product. It is a structure-first workflow for traders who care about location, context, and timing. V2 Launch Offe
ScalpPoint
Temirlan Kdyrkhan
ScalpPoint is a powerful trading companion designed to generate high-probability entry signals with dynamic TP/SL/DP levels based on volatility. Built-in performance tracking shows win/loss stats, PP1/PP2 hits, and success rates — all updated live. Key Features: Buy/Sell signals with adaptive volatility bands Real-time TP/SL/DP levels based on ATR Built-in MA Filter with optional ATR/StdDev volatility Performance stats panel (Success, Profit/Loss, PP1/PP2) Alerts via popup, sound, push, or emai
RelicusRoad Pro MT5
Relicus LLC
4.96 (24)
RelicusRoad Pro: 퀀트 시장 운영 체제 70% 할인 평생 이용권 (한정 시간) - 2,000명 이상의 트레이더와 함께하세요 왜 대부분의 트레이더는 "완벽한" 지표를 가지고도 실패할까요? 진공 상태에서 단일 개념 만으로 거래하기 때문입니다. 문맥 없는 신호는 도박입니다. 지속적인 승리를 위해서는 컨플루언스(중첩) 가 필요합니다. RelicusRoad Pro는 단순한 화살표 지표가 아닙니다. 완전한 퀀트 시장 생태계 입니다. 독점적인 변동성 모델링을 사용하여 가격이 이동하는 "공정 가치 로드"를 매핑하고, 단순 노이즈와 실제 구조적 돌파를 구분합니다. 추측은 그만두세요. 기관급 로드 로직으로 거래를 시작하세요. 핵심 엔진: "Road" 알고리즘 시스템의 중심에는 시장 상황에 실시간으로 적응하는 동적 변동성 채널인 Road Algo 가 있습니다. 세이프 라인(평형) 과 가격이 수학적으로 반전될 가능성이 높은 확장 레벨 을 투영합니다. Simple Road: 일반적인 시장을 위
Meravith MT5
Ivan Stefanov
5 (1)
마켓 메이커를 위한 도구. Meravith는 다음과 같은 기능을 제공합니다: 모든 타임프레임을 분석하고 현재 유효한 추세를 표시합니다. 강세와 약세 거래량이 동일한 유동성 구간(거래량 균형 구간)을 강조 표시합니다. 서로 다른 타임프레임의 모든 유동성 레벨을 차트에 직접 표시합니다. 텍스트 기반 시장 분석을 생성하여 참고용으로 제공합니다. 현재 추세를 기반으로 목표가, 지지선 및 손절가를 계산합니다. 거래의 위험 대비 보상 비율(Risk/Reward)을 계산합니다. 계좌 잔고에 따라 포지션 크기를 산출하고 잠재 수익을 추정합니다. 시장에 중대한 변화가 발생할 경우 경고도 제공합니다. 지표의 주요 라인: 강세/약세 거래량 소진 라인 — 목표가로 사용됩니다. 시장 추세를 나타내는 라인. 시장이 강세인지 약세인지에 따라 색상이 변경되며 추세 지지선 역할을 합니다. 색상은 주로 시장 심리를 보여줍니다. 거래량 균형선(Eq). Eq(Volume Equilibrium) 라인은 시스템의 핵심입니
MasterTrend
Temirlan Kdyrkhan
MasterTrend Indicator for MT5 A powerful trend-following and signal-evaluation tool MasterTrend   is a custom MT5 indicator that combines Moving Averages and ATR-based risk/reward logic to generate clear buy/sell signals. It visualizes dynamic SL/TP levels, evaluates past trade outcomes, and displays win/loss statistics in a clean on-chart panel. Key features include: Buy/Sell signals based on MA crossovers ATR-based SL/TP1/TP2/TP3 levels with visual lines and labels Signal outcome tracking wit
KT Alpha Hunter Arrows MT5
KEENBASE SOFTWARE SOLUTIONS
대부분의 화살표 인디케이터는 신호만 보여주고, 나머지 판단은 모두 트레이더에게 맡깁니다. KT Alpha Hunter Arrows는 완성된 트레이딩 플랜을 제공합니다. 각 신호 화살표가 표시될 때마다 진입선, 손절선, 네 개의 익절 목표, 그리고 현재 심볼과 시간대가 지금 거래할 가치가 있는지 알려주는 실시간 엣지 판정이 함께 그려집니다. 포함된 Trade Manager EA는 사용자가 직접 진입한 뒤의 실행 관리를 맡아, 시장이 흔들리고 감정이 개입되기 쉬운 상황에서도 거래 원칙을 유지할 수 있도록 도와줍니다. 리페인트 없음. 종가 확정 후 신호만 표시. Forex, Gold, Indices 및 사용자가 거래하는 다양한 MT5 지원 상품에 맞게 설계되었습니다. 주요 기능 캔들이 마감된 후에만 표시되는 리페인트 없는 매수 및 매도 화살표. 각 신호마다 진입선, 구조적 손절선, 네 개의 익절 목표 표시. 현재 차트에서 매수와 매도 셋업을 별도로 평가하는 Edge Dashboard.
ARICoins
Temirlan Kdyrkhan
ARICoin is a powerful trading companion designed to generate high-probability entry signals with dynamic TP/SL/DP levels based on volatility. Built-in performance tracking shows win/loss stats, PP1/PP2 hits, and success rates all updated live. Key Features: Buy/Sell signals with adaptive volatility bands Real-time TP/SL/DP levels based on ATR Built-in MA Filter with optional ATR/StdDev volatility Performance stats panel (Success, Profit/Loss, PP1/PP2) Alerts via popup, sound, push, or email Cust
OmniSync Projection
Antonio-alin Teculescu
5 (1)
Chronos Fractal Engine is an innovative price projection indicator for MetaTrader 5, designed to transform your technical analysis by intelligently identifying and projecting historical price patterns. Built upon an advanced correlation algorithm and the fractal principles of the market, this powerful tool visualizes potential future price movements, giving you a unique edge in your trading decisions. What is Chronos Fractal Engine? At its core, the Chronos Fractal Engine employs a sophisticat
AriX
Temirlan Kdyrkhan
1 (4)
AriX Indicator for MT5 A powerful trend-following and signal-evaluation tool AriX is a custom MT5 indicator that combines Moving Averages and ATR-based risk/reward logic to generate clear buy/sell signals. It visualizes dynamic SL/TP levels, evaluates past trade outcomes, and displays win/loss statistics in a clean on-chart panel. Key features include: Buy/Sell signals based on MA crossovers ATR-based SL/TP1/TP2/TP3 levels with visual lines and labels Signal outcome tracking with real-time stat
Gem SIGNAL
Shengzu Zhong
5 (1)
GEM Signal Pro GEM Signal Pro는 MetaTrader 5용 추세추종형 지표로, 차트에서 더 명확한 신호, 더 구조적인 트레이드 설정, 그리고 더 실용적인 리스크 관리를 원하는 트레이더를 위해 설계되었습니다. 단순한 화살표만 표시하는 것이 아니라, GEM Signal Pro는 전체 트레이드 아이디어를 더 깔끔하고 읽기 쉬운 방식으로 보여줍니다. 조건이 확인되면 진입가, 손절가, 목표가를 차트에 표시하여 트레이더가 설정을 더 효율적으로 검토할 수 있도록 도와줍니다. 작동 방식 이 지표는 먼저 내부 로직에 따라 유효한 초기 신호를 식별합니다. 확인 조건이 충족되면, GEM Signal Pro는 차트에 전체 설정을 표시합니다. 이를 통해 트레이더는 거래 구조를 더 명확하게 보고, 수동 분석 작업을 줄일 수 있습니다. 차트에 표시되는 거래 레벨 확인된 신호에 대해, GEM Signal Pro는 다음을 표시할 수 있습니다. 진입가 손절가 목표가 1 목표가 2 목표가 3 손
The Zain GOLD indicator
Haitham Gamal Abdelnaser Mohamed
Specializing in (All brokers supported): Professional Trading Tools Want the same tools used by professional traders? Get them now and start dominating the markets! Join our premium communities for free: Specializing in (All brokers supported): Gold (XAUUSD) - Unmatched accuracy Forex Pairs - Comprehensive global market coverage Binary Options - Highly accurate signals ️ Synthetic Derivatives - Trade pairs using Drive Cryptocurrencies - Professional cryptocurrency trad
CGE Trading Suite
Carl Gustav Johan Ekstrom
5 (2)
Institutional-Grade Analytics for MT5 C GE Trading Suite delivers the analytical edge typically reserved for professional trading desks. The platform integrates a full suite of analytical tools into one seamless workflow: dynamic grid mapping, liquidity behavior analysis, ECM, trend lines, MIDAS, trade cycles, and directional channel projections. Together, these provide a unified view of market structure and momentum. Directional clarity is further enhanced by the capital flow index, which meas
Flag Pattern Angelo
Brighton Mufaro Mudzingwa
Brandon Angelo Flag Pattern — how it works This indicator automatically detects classic bull and bear flag chart patterns in real time. The detection happens in three stages for each bar. First it looks for a flagpole — a sharp, strong directional move over a configurable number of bars ( FlagpoleBars , default 5) that must exceed a minimum percentage size ( FlagpoleMinPct ). For a bullish flag the pole must close net higher than it opened; for a bearish flag, net lower. Second it identifies th
First time on MetaTrader, introducing IQ Star Lines - an original Vedic Astrology based indicator. "Millionaires don't use astrology, billionaires do" . - J.P. Morgan, Legendary American financier and banker. Welcome to  the new and updated  IQ Star Lines , the ultimate fusion of ancient planetary harmonic cycles and modern quantitative trading. published for the   first time on Metatrader. This is an indicator built by the developer, who has spent almost 2 decades trading while studying Vedic
Big Player Range
Thalles Nascimento De Carvalho
5 (3)
BigPlayerRange – MT5 최고의 지표 BigPlayerRange 는 MetaTrader 5에서 미니 인덱스와 미니 달러를 위한 최고의 지표 로 평가받고 있습니다. 이 도구는 주요 기관 투자자들의 전략적 영역을 강조하여 높은 정확도의 기관 기술 분석을 제공합니다. BigPlayerRange 사용법: 이 지표는 매수 구간(녹색선)과 매도 구간(빨간선)을 표시합니다. 가격이 이 구간 밖에서 마감되면 추세 움직임이 예상됩니다. 녹색선 위에서 마감: 강한 매수세와 상승 추세 가능성. 빨간선 아래에서 마감: 매도 압력과 하락 가능성. 범위 내에서 마감: 횡보 시장, 돌파 신호 대기. 주요 혜택: 기관 투자자 영역 매핑: 주요 투자자들의 활동 구간을 식별합니다. 자동 목표 지점 산출: 거래 종료에 적합한 목표 지점을 제공합니다. 풀백 분석: 리스크 관리를 위한 가격 반등 가능성 평가. 활용 방법: BigPlayerRange와 함께 Imba
QuasarEdge
Yuki Miyake
1 (1)
[Special Limited Price] Release Commemoration Sale! Currently available at a special price to celebrate its release. The price will revert to normal without notice after a certain period or sales volume. Don't miss this chance to get a pro-level trading environment at the lowest price! Quasar Edge & Dual Dashboard ~ Transform the "chaos" of 28 pairs into "confident profits" with the ultimate MT5 market structure system ~ The reason many traders lose isn't due to indicator performance, but
Premium level Pro
Dmitriy Kashevich
Premium level is a unique indicator with more than 80% accuracy of correct predictions! This indicator has been tested for more than two months by the best Trading Specialists! The author's indicator you will not find anywhere else! From the screenshots you can see for yourself the accuracy of this tool! 1 is great for trading binary options with an expiration time of 1 candle. 2 works on all currency pairs, stocks, commodities, cryptocurrencies Instructions: As soon as the red arrow app
MetaTrader 5용 스마트 다층 브레이크아웃 및 풀백 탐지기 "스마트하고, 간단하고, 빠르게!" 고확률 브레이크아웃 진입을 놓치는 것에 지치셨나요? 여러 차트를 몇 시간씩 스캔하면서 브레이크아웃을 추세 방향과 통화 모멘텀에 맞추려고 하지만 — 결국 움직임을 놓치고 마나요? Break Pullback은 하나의 지표로 이 모든 문제를 해결합니다. Break Pullback이란 무엇인가요? Break Pullback은 시장 구조, 브레이크아웃, 추세 지속 설정을 거래하는 트레이더를 위해 특별히 설계된 전문가급 MetaTrader 5 지표입니다. 실시간으로 여러 통화 쌍에 걸쳐 Break와 Pullback 형성을 자동으로 감지하고 — 세 가지 확인 레이어를 통해 모든 신호를 필터링합니다: 구조적 브레이크아웃 탐지 — 차트의 주요 브레이크 레벨 식별 HTF 일봉 바이어스 — 진입을 지배적인 일봉 추세 방향에 맞춤 통화 강도 지수 — 쌍을 이룬 통화 간의 모멘텀 불균형 확인 결과: 오
" Dynamic Scalper System MT5 " 지표는 추세 파동 내에서 스캘핑 방식으로 거래하도록 설계되었습니다. 주요 통화쌍 및 금에서 테스트되었으며, 다른 거래 상품과의 호환성이 가능합니다. 추가적인 가격 변동 지원을 통해 추세에 따라 단기 포지션 진입 신호를 제공합니다. 지표의 원리 큰 화살표는 추세 방향을 결정합니다. 작은 화살표 형태의 스캘핑 신호를 생성하는 알고리즘은 추세 파동 내에서 작동합니다. 빨간색 화살표는 상승 방향을, 파란색 화살표는 하락 방향을 나타냅니다. 민감한 가격 변동선은 추세 방향으로 그려지며, 작은 화살표의 신호와 함께 작용합니다. 신호는 다음과 같이 작동합니다. 적절한 시점에 선이 나타나면 진입 신호가 형성되고, 선이 있는 동안 미결제 포지션을 유지하며, 완료되면 거래를 종료합니다. 권장되는 작업 시간대는 M1~H4입니다. 화살표는 현재 캔들에 형성되며, 다음 캔들이 이미 시작되었더라도 이전 캔들의 화살표는 다시 그려지지 않습니다. 입
Assembler
Darko Licardo
5 (1)
Introducing Assembler:  The best value for money,  Designed for advanced traders and professionals, yet accessible for ambitious beginners ready to elevate their trading game. Great for ICT, SMC, TREND and breakout traders . Combining advanced analytics, a sleek graphical interface, and highly customizable features, Assembler empowers you to trade with precision, clarity, and confidence. Key Features of Assembler 1. Dynamic Graphical User Interface (GUI): A fully draggable, customizable interf
Gold Xausd Hunter
Metin Erkamoglu
5 (1)
MATADOR GOLD XAUUSD M5 Scalp Signals for MT5 MATADOR GOLD is a decision-support indicator for MetaTrader 5, designed for traders who analyze short-term Gold movement on the M5 timeframe. The indicator does not open, close, or manage trades automatically. It provides buy and sell signal guidance so the user can make their own trading decisions according to their risk plan, broker conditions, and trade management rules. Main purpose MATADOR GOLD is built to help traders avoid noisy signal flow and
+++++++++++++++++++++++++++++++++++++++++++++++++++++++++++++++++++++++++++++++++++++++++++++++++ +++ Link to EURUSD Only Free Version -->  https://www.mql5.com/en/market/product/156904?source=Unknown +++++++++++++++++++++++++++++++++++++++++++++++++++++++++++++++++++++++++++++++++++++++++++++++++ Hallo Trader, This is a traditional GANN & FIBONACCI strategy based on detection of an impulsive move in the opposite direction. This is called a Breakout. At the moment of Breakout, the indicator draw
Hidden Trend Channel Project 17 Tool SPECIAL NOVEMBER SALE is now finished. Price goes back to normal.  This is an Automated Tool for Multi Timeframe Trend Channel Analysis Visualization with Intelligent Range Market, Trending Market, Reversal, Breakout Detection.  It draws multiple Trend Channels with multiple sub-trendlines levels inside the channel for perfectly give you the trader, the crystal clear Trend channels where price trend direction is moving. This tool is accurately useful for T
제작자의 제품 더 보기
Precision Trend Filter is an adaptive noise-filtering trend indicator that identifies real market direction while ignoring false moves and choppy price action. The indicator uses a proprietary filtering algorithm with ATR-based dynamic thresholding to separate genuine trend shifts from random market noise. The result is a clean, color-coded trend line that holds flat during consolidation and tracks price aggressively during real trends. Key Features - Color-changing trend line: green for bu
FREE
Standard RSI uses a fixed smoothing factor. Every bar gets the same weight whether the market is trending cleanly or chopping sideways. That is why most RSI signals fail during consolidation. Mystical RSI measures how chaotic price action is on every bar using the Fractal Dimension Index and dynamically adjusts its smoothing in real time. When the market trends, it reacts fast. When the market chops, it slows down and filters out noise. No manual adjustment needed. How It Works The indicator cal
FREE
Precision Strike Arrows   is a precision signal indicator for MetaTrader 5 built on the Momentum concept. It detects periods of market compression and fires a single clean arrow on the chart when momentum shifts direction, keeping your chart clear and your focus sharp. Most arrow indicators paint signals on every minor fluctuation. Precision Strike Arrows is designed to do the opposite. It waits for the market to coil, identifies the moment momentum commits to a direction, and plots one decisive
FREE
Precision Trend Filter   is an adaptive noise-filtering trend indicator that identifies real market direction while ignoring false moves and choppy price action. The indicator uses a proprietary filtering algorithm with ATR-based dynamic thresholding to separate genuine trend shifts from random market noise. The result is a clean, color-coded trend line that holds flat during consolidation and tracks price aggressively during real trends. Key Features - Color-changing trend line: green for
FREE
Precision Trailing Stop is a dynamic trailing stop indicator that anchors itself to real market structure instead of lagging moving averages or fixed ATR multiples. It identifies key structural price levels on both sides of the market, builds adaptive support and resistance bands, and engages a ratcheting stop that only moves in your favour. As market structure evolves, outdated levels drop out of the calculation automatically. The result is a trailing stop that stays tight to price action when
FREE
Precision Trailing Stop   is a dynamic trailing stop indicator that anchors itself to real market structure instead of lagging moving averages or fixed ATR multiples. It identifies key structural price levels on both sides of the market, builds adaptive support and resistance bands, and engages a ratcheting stop that only moves in your favour. As market structure evolves, outdated levels drop out of the calculation automatically. The result is a trailing stop that stays tight to price action whe
FREE
Expanded Cloud is a trend-following overlay indicator that uses an adaptive expansion algorithm to identify market direction with clarity. Dynamic cloud zones expand and contract around price action based on real-time volatility, giving you a visual edge in reading trend strength and catching reversals early. The indicator includes a built-in information dashboard with two tabs — Signal and Cloud — displaying real-time data about current market conditions directly on your chart. How It Works A r
FREE
Expanded Cloud is a   trend-following overlay indicator   that uses an adaptive expansion algorithm to identify market direction with clarity. Dynamic cloud zones expand and contract around price action based on real-time volatility, giving you a visual edge in reading trend strength and catching reversals early. The indicator includes a built-in information dashboard with two tabs — Signal and Cloud — displaying real-time data about current market conditions directly on your chart. How It Works
FREE
Mystic RSI by MoonPipz
Sarvaddnya Pathrabe
Standard RSI uses a fixed smoothing factor. Every bar gets the same weight whether the market is trending cleanly or chopping sideways. That is why most RSI signals fail during consolidation. Mystical RSI measures how chaotic price action is on every bar using the   Fractal Dimension Index   and dynamically adjusts its smoothing in real time. When the market trends, it reacts fast. When the market chops, it slows down and filters out noise. No manual adjustment needed. How It Works The indicator
FREE
필터:
리뷰 없음
리뷰 답변