Tct RSI Panel
- 지표
- 버전: 1.0
- 활성화: 5

🔥 TCT RSI PANEL - Relative Strength Dashboard
IDENTIFY OVERBOUGHT AND OVERSOLD CONDITIONS WITH PRECISION
The TCT RSI PANEL is a professional indicator that monitors the RSI (Relative Strength Index) and generates signals at extreme levels, combined with "thousandths" levels for precise entry points.
═══════════════════════════════════════════
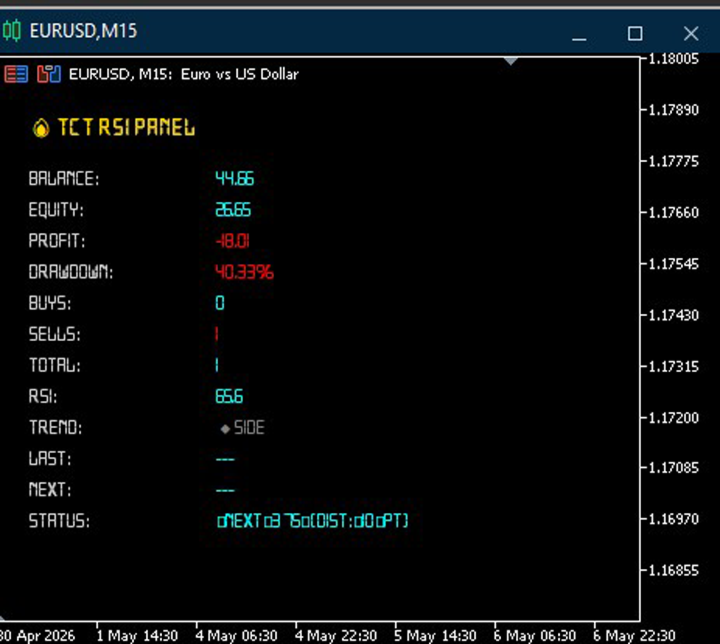
📊 WHAT YOUR DASHBOARD DISPLAYS
═══════════════════════════════════════════
✅ ACCOUNT DATA:
• Balance, Equity, Profit, and Drawdown in real-time
✅ OPEN POSITIONS:
• Buys, Sells, and Total
✅ RSI ANALYSIS:
• Current RSI value
• Overbought (>70) and Oversold (<30) zones
• Trend: HIGH (oversold), LOW (overbought), SIDE (sideways)
✅ THOUSANDTHS SYSTEM:
• Detects levels at .125, .250, .375, .500, .625, .750, .875
• Last thousandth level touched and how long ago
• NEXT THOUSANDTH level based on the RSI trend
• Distance in points to the next level
═══════════════════════════════════════════
🎯 TRADING SIGNALS
═══════════════════════════════════════════
The indicator AUTOMATICALLY GENERATES VISUAL SIGNALS when:
🔵 BUY: Special thousandth level + RSI oversold (<30)
🔴 SELL: Special thousandth level + RSI overbought (>70)
Ideal for reversal strategies at extreme levels! ═══════════════════════════════════════════
⚙️ CONFIGURABLE PARAMETERS
═══════════════════════════════════════════
• RSI Period (default: 14)
• Overbought (70) and Oversold (30) Limits
• Fractional Pip Tolerance
• Customizable Colors and Fonts
═══════════════════════════════════════════
✅ PERFECT FOR
═══════════════════════════════════════════
• Reversal traders
• Those trading RSI extremes
• Scalpers who use fractional pips as a filter
• Mean reversion strategies
═══════════════════════════════════════════
💰 INVESTMENT: ONLY $30
═══════════════════════════════════════════
TCT RSI PANEL – Capture reversals at the extremes! 🔄