Scalper Terminal X30
- 지표
-
Kenan Ozkarakas
 Hi welcome to my profile. I graduated from the Department of Mathematics. I started by writing in Simple Computer Programs and Python programming languages. I switched to Web Programming and I have been doing web design, Android Programming, E-Commerce web sites since 2016. Also, I have been
 - 버전: 1.0
- 활성화: 7
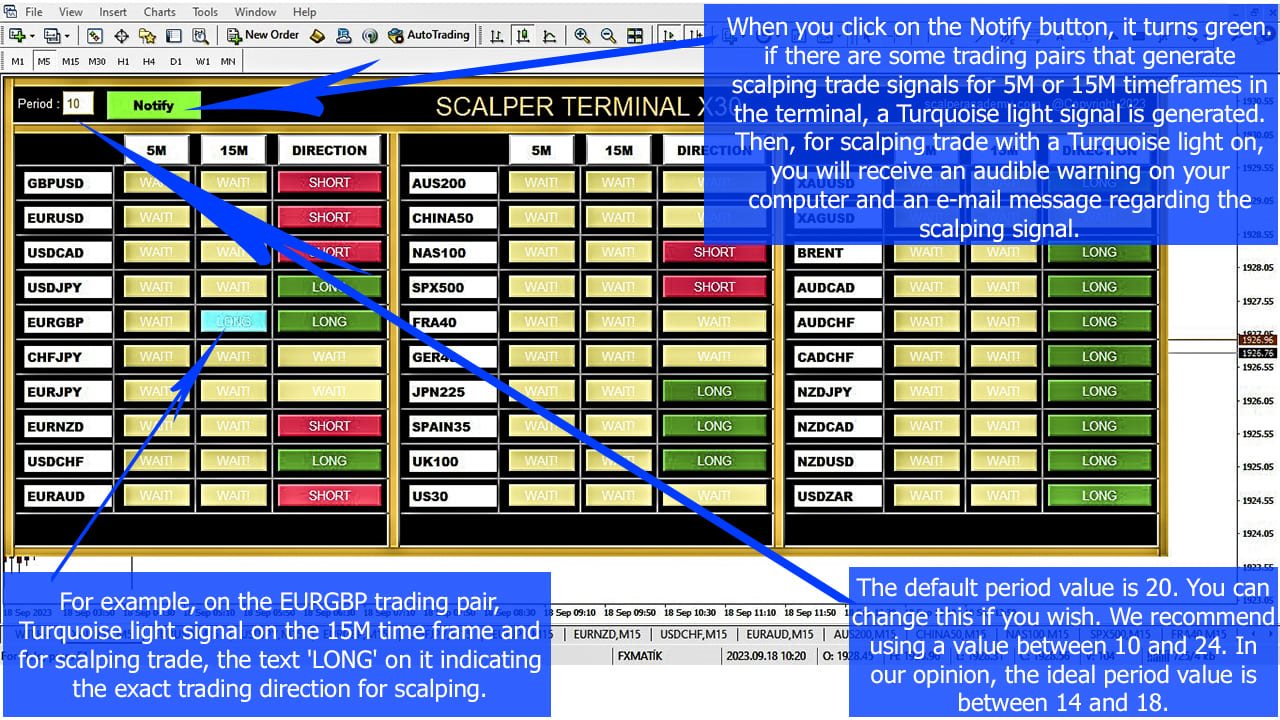
Scalper Terminal 인터페이스 소프트웨어는 지표이며 자동 구매-판매 거래에 참여하지 않습니다. 이 지표는 스캘핑 거래 기회가 발생했을 때 거래가 들어갈 수 있는 현재 거래 영역을 보여줍니다. 스캘핑 신호가 있는 경우 해당 거래 쌍의 오른쪽에 청록색 표시등이 켜지고 그 위에 정확한 거래 방향이 표시됩니다. 그런 다음 청록색 버튼을 클릭하여 거래를 입력하세요. 새 탭이 열립니다. 이후 스캘핑 거래 진입 조건인 캔들 클로징이 예상된다.
스캘퍼 터미널과 성공적인 스캘핑 거래 거래를 하기 위해서는
- 설명 섹션의 동영상을 꼭 시청하세요. Scalper Terminal 소프트웨어에 군인처럼 붙어보세요.
- 각 거래 쌍의 오른쪽에는 5M, 15M 및 DIRECTION 열이 있습니다. 먼저 알림 버튼을 클릭하고 녹색으로 만듭니다.
- 화면을 계속해서 볼 필요는 없습니다. 청록색 빛 신호 또는 메타 트레이더 경고 메시지 소리를 기다리십시오.
- 청록색 빛으로 표시된 정확한 작동 방향(DIRECTION 열 텍스트도 포함)을 읽으십시오. 정확한 거래 방향에서 스캘핑을 위해 청록색 버튼을 클릭하세요.
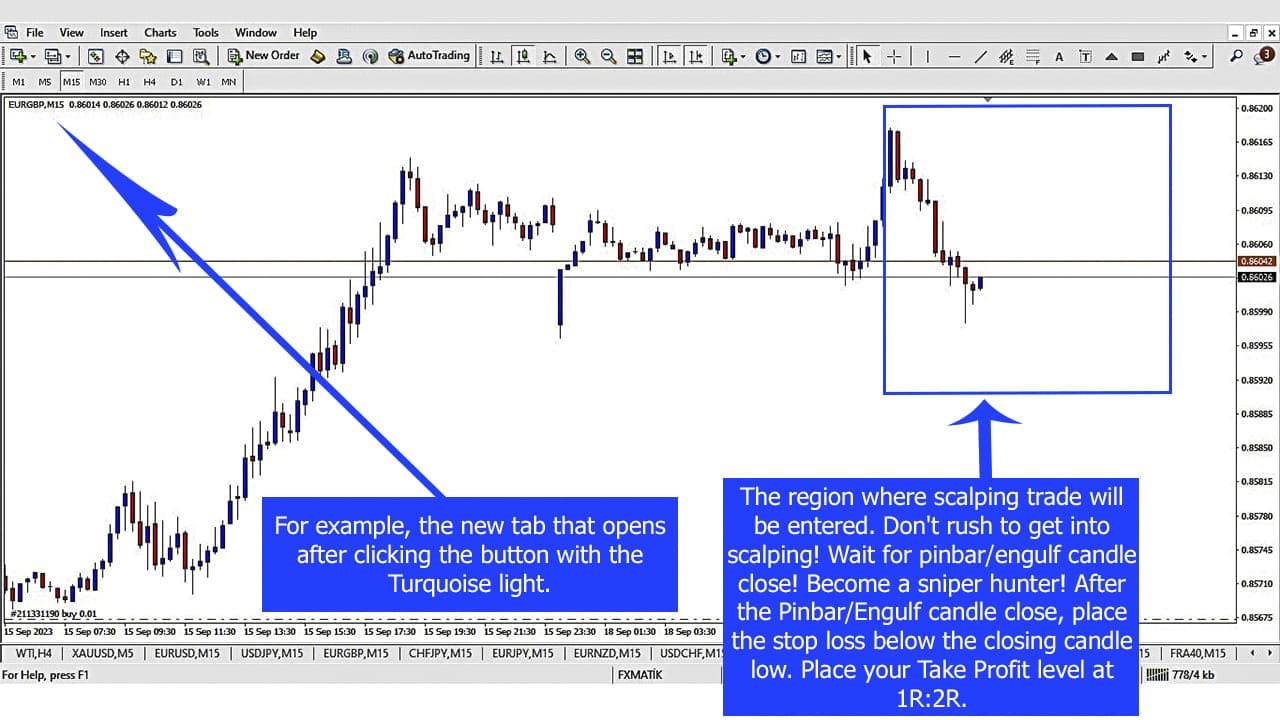
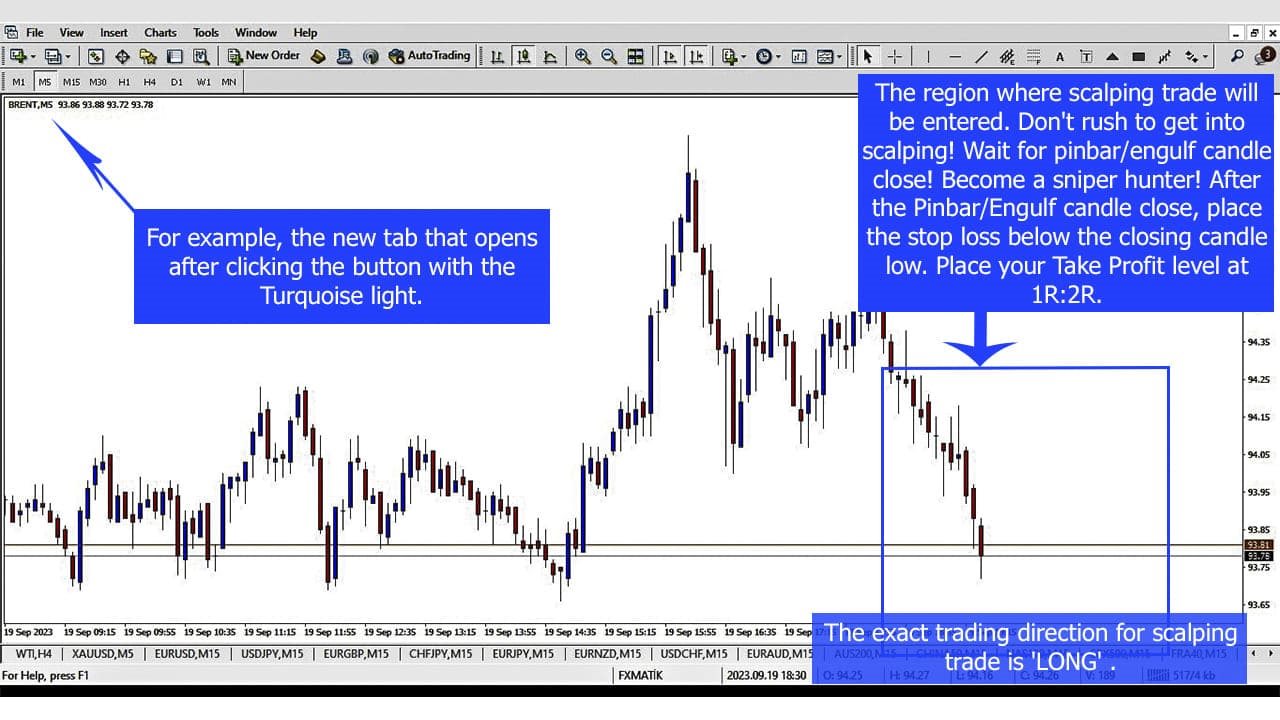
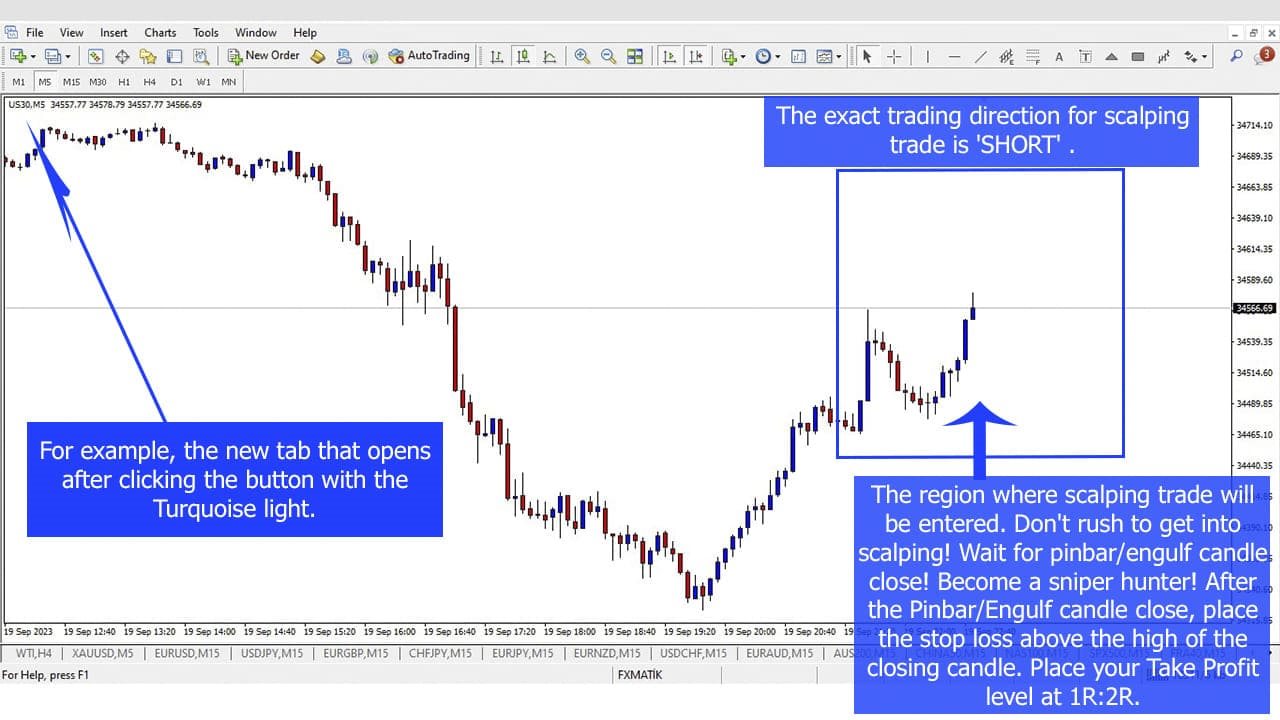
- 스캘핑 거래를 위해 열린 새 탭에서 핀바 또는 삼키기 캔들이 사냥꾼처럼 닫힐 때까지 기다리세요.
- 핀바 또는 인걸프 캔들 클로징이 포지션 진입 조건일 때, 스캘퍼 터미널이 지시하는 방향으로 포지션을 오픈합니다.
- 포지션 진입 방향 반대쪽에 손절매 주문을 추가합니다. (예를 들어 LONG 거래인 경우 손실정지 주문 위치는 마지막 마감 캔들의 가장 낮은 수준입니다.)
- 그런 다음 Takeprofit 주문을 1R:2R로 추가하세요.
- 성공을 위한 유일한 조건은 동일한 위험률로 모든 포지션에 진입하는 것이며 손절매는 1R, Takeprofit은 2R이어야 합니다. 포지션 크기 계산기(예: PSC Trader.ex4)와 같은 추가 무료 Metatrader4 플러그인을 사용하여 고정 위험에 적합한 로트 크기의 포지션을 입력하세요.
- 스캘퍼 터미널은 하루 동안 5-20개의 스캘핑 거래 신호를 생성할 수 있습니다. (소프트웨어 왼쪽 상단의 기간 값에 따라 다릅니다. 값 18을 사용하는 것이 좋습니다.)
- 저격수처럼 사냥꾼이 되어보세요! 인내심을 가지세요! 청록색 빛 신호를 기다린 다음 핀바/삼키기 양초가 닫힐 때까지 기다립니다.
- 모든 직책에 대해 Excel 스프레드시트를 보관하세요. 1R:2R 위험-보상 규칙을 따르면 성공은 불가피합니다.
- 인덱스 그룹에서 1쌍과 외환 그룹에서 1쌍만 동시에 선택하세요. 동일한 그룹의 둘 이상의 패리티에서 트랜잭션을 열면 안 됩니다.
- 청록색 신호가 들어오는 쌍에서 거래를 시작하면 다음 거래에 들어가기 위해 1-2시간 동안 휴식을 취하십시오. 두 번의 연속 거래 사이에 시간이 있다면 더 이상적이기 때문입니다.